All Activity
- Past hour
-

July 2025 Discussion-OBS - seasonable summer variability
steve392 replied to wdrag's topic in New York City Metro
Yessssssssssss, hold together mother nature, hold... Together(1).jpeg.cf4e9269e305707c4b60c28b439b034c.jpeg)
-

Occasional Thoughts on Climate Change
TheClimateChanger replied to donsutherland1's topic in Climate Change
For comparison, July 2020. Simple arithmetic mean of 99 stations: 77.1F. NCEI reports 76.9F, or 0.2F cooler. If they are conducting some sort of massive increase in recent temperatures, they seem to be omitting the Midwest from the warming. To be honest, the earlier sample has a much greater proportion of center city and rooftop sites, with all of the city observations moved out to suburban airports and the city WSOs closed. So it's actually kind of surprising, there's no deviation from the simple mean, because there are clearly non-climatic biases in the data. -

July 2025 Obs/Disco ... possible historic month for heat
dendrite replied to Typhoon Tip's topic in New England
Horrible. Save that shit for Christmas. -

July 2025 Obs/Disco ... possible historic month for heat
Modfan2 replied to Typhoon Tip's topic in New England
Nice line setting up from Manchester to Sterling/RI line -
July 2025 Obs/Disco ... possible historic month for heat
dendrite replied to Typhoon Tip's topic in New England
Hopefully better than he handles a daddy longleg. -
Occasional Thoughts on Climate Change
TheClimateChanger replied to donsutherland1's topic in Climate Change
Here is the average of all available data in Ohio for July 1895: The reported value for that month is 71.1F, just 0.1F different than a simple average of the data. This is not the case for states with more significant elevation changes. Generally, the early data is devoid or limited of high elevation stations, so the simple average is often much higher than the gridded average. But most of the data for the Midwest matches pretty close to the reported data - like I said there are some adjustments made to later decades, but these are reasonable (change in TOBs and instruments). Ideally, we would have just maintained the 5 pm / 6 pm observations and CRS readings, and then there would be no need for any adjustments. But unfortunately, we don't live in the universe where those changes weren't made. I think it is reasonable to consider whether maybe to reinstate them at certain or all sites? -
Should be even nicer tomorrow.
-
Occasional Thoughts on Climate Change
TheClimateChanger replied to donsutherland1's topic in Climate Change
Meh, most of what's called adjustments is actually just areal averaging/gridding of the data. With states like Ohio or Illinois, where there aren't huge variations in elevation, and the stations have been pretty well separated throughout history, there's little discrepancy in the pre-1920 data versus what NCEI reports. There's a small decrease to account for observation time, and adjustment for instrument bias, from about the 1920s gradually decreasing in the 1960s to 1970s. Recent decades are generally slightly less. Why - I'm not sure, I guess a small negative UHI adjustment. Obviously, looking at individual sites, there can be significantly larger inhomogeneities - especially with some of them that have been shuttered and/or threaded with a bunch of disparate locations, elevations and site exposures. -

July 2025 Obs/Disco ... possible historic month for heat
RUNNAWAYICEBERG replied to Typhoon Tip's topic in New England
Oh no the horror. What a brutal life update…how will you handle it? -

July 2025 Discussion-OBS - seasonable summer variability
forkyfork replied to wdrag's topic in New York City Metro
impressive event coming.thumb.gif.e3b835bfd608da039d253c44fcbcc463.gif)
-
It's all ghosted fake data - no doubt that adjusted data is exacty what they use on CinCin TV networks to show their man made "warming" climate
-
Occasional Thoughts on Climate Change
TheClimateChanger replied to donsutherland1's topic in Climate Change
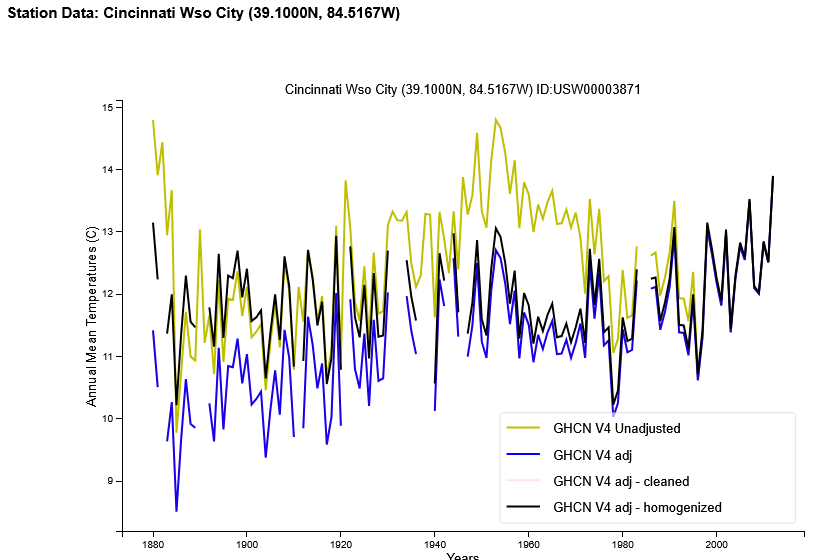
There was no Cincinnati WSO until nearly 2000 - much of that appears to be made up "ghosted" data as you have referred to it in the past. For the period where there actually is data [i.e., up until the 1960s & 1970s], the adjusted & homogenized final product appears to decrease the trend. Moreover, this is a rooftop urban station. In recent years, temperatures at the airport - several hundred feet higher in elevation, with an aspirated temperature sensor, sited over grass - have exceeded even those lofty early years. Here's what the site looked like in 1947 (see illustration below). I would 100% favor bringing back these stations today and actually reporting the observed temperatures. Guarantee they would be far warmer than whatever is shown on there. -
Thanks! 1. Based on the graph, June WCS PDO calculated to be ~-1.8. Based on recent relationships between WCS and NOAA, I had said that that likely meant the June NOAA PDO was likely down to the -2.5 to -2.9 range. So, the -2.51 jibes with my expectations. 2. The unrounded AMJ ONI is -0.11. That means RONI minus ONI, -0.38, has narrowed even more. It was -0.43 in MAM, -0.49 in FMA, -0.51 in JFM, and -0.53 in DJF.
-
July 2025 Obs/Disco ... possible historic month for heat
Modfan2 replied to Typhoon Tip's topic in New England
Have a lone cell approaching from IJD, wondering if this hinders later development? -

July 2025 Obs/Disco ... possible historic month for heat
ineedsnow replied to Typhoon Tip's topic in New England
81/60 storm potential looks meh around here -
It can work both ways like we saw last summer. The record subtropical warmth and stable conditions lead to the lull in activity from late August into early September. But then it became very active later in the season.
-

July 2025 Discussion-OBS - seasonable summer variability
donsutherland1 replied to wdrag's topic in New York City Metro
JFK: 3; LGA and NYC: 4; EWR: 6. -

July 2025 Obs/Disco ... possible historic month for heat
powderfreak replied to Typhoon Tip's topic in New England
Down to 63F here, dews 55F. Got chilly in a hurry. -
We had a nice morning for some lawn work here. And I got all the bird poop off the mailbox. It's amazing how much they poop on that thing. Anyway, @HillsdaleMIWeathermight cash in on a rogue storm soon.
-
Spectacular day in ocean city today
-

July 2025 Obs/Disco ... possible historic month for heat
BrianW replied to Typhoon Tip's topic in New England
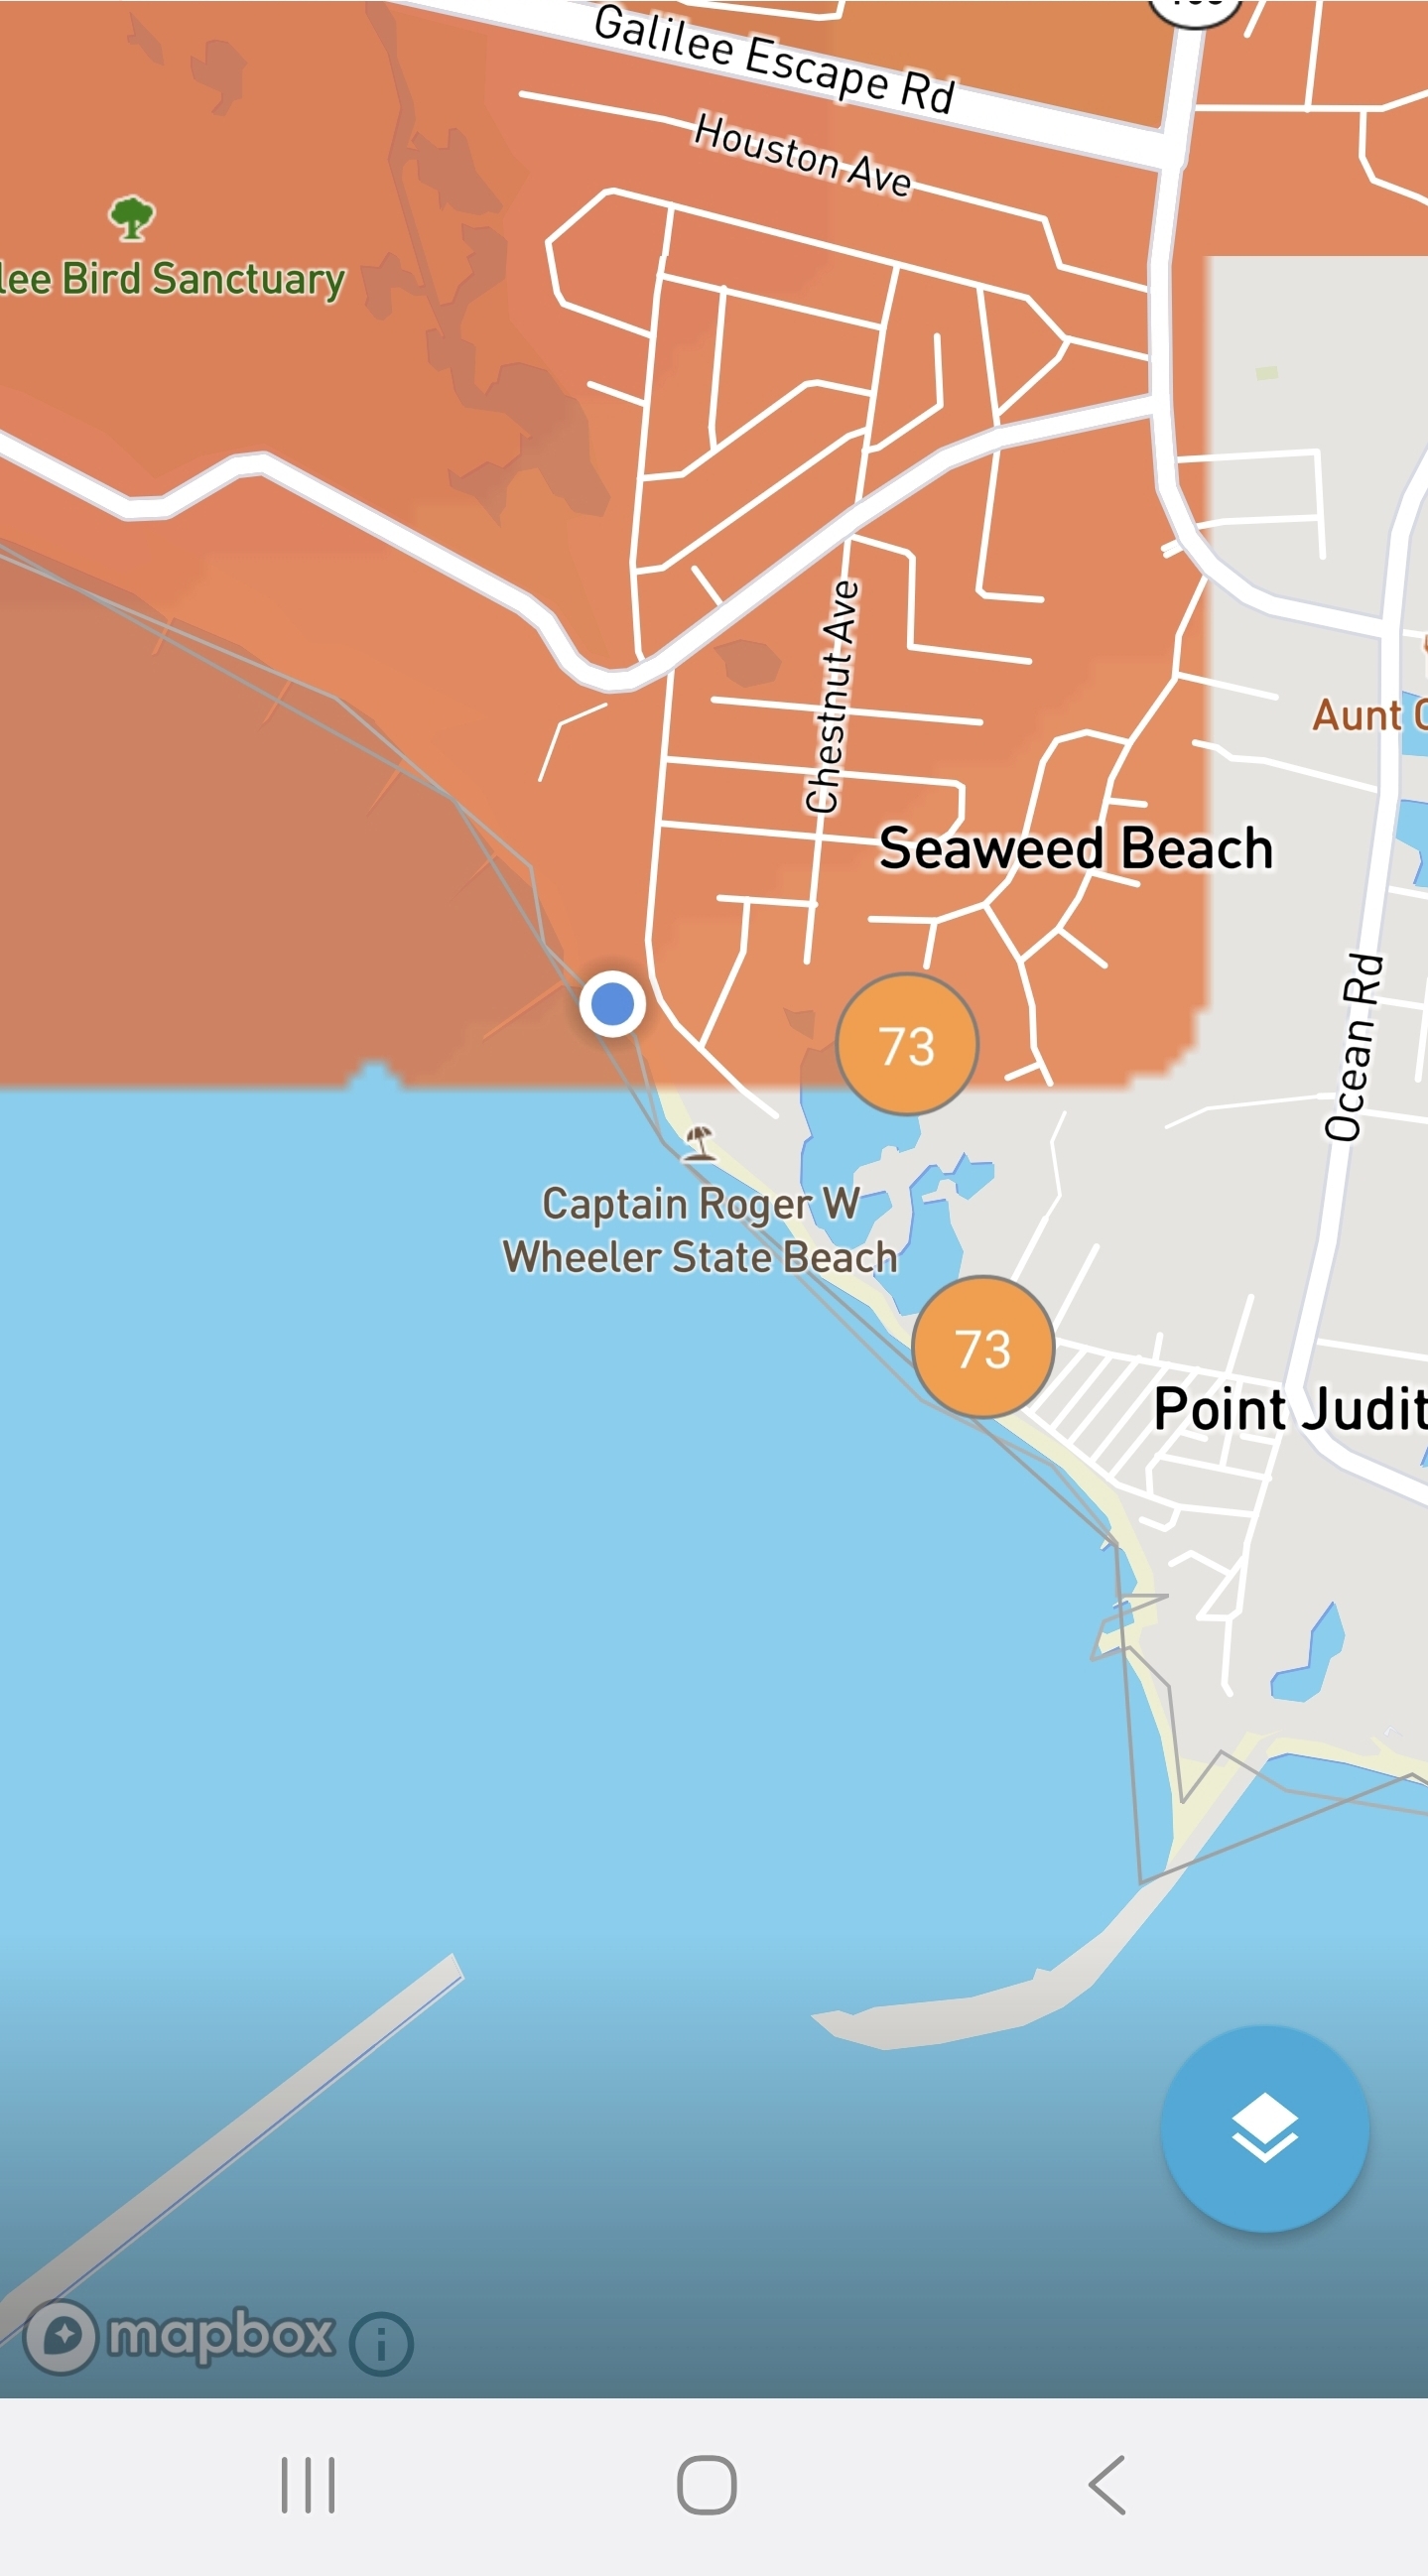
This is the spot for the ACATT crew. Been 73-75 here most of the day at Roger Wheeler Beach/ Pt Judith in RI.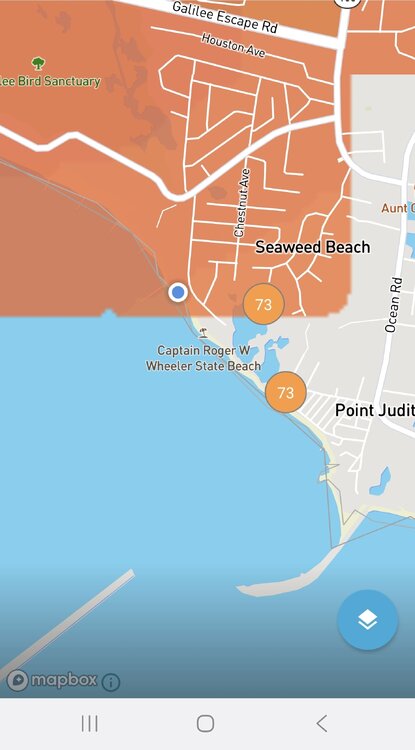
-

July 2025 Discussion-OBS - seasonable summer variability
bluewave replied to wdrag's topic in New York City Metro
The summer of 1966 heatwave was very short compared to our summers these days. The major heat only lasted for around 3 weeks. The summer before and after that period wasn’t very warm by today’s standards. Data for NEWARK LIBERTY INTL AP, NJ Click column heading to sort ascending, click again to sort descending. 1966-06-23 93 61 1966-06-24 97 73 1966-06-25 85 63 1966-06-26 78 62 1966-06-27 101 68 1966-06-28 90 74 1966-06-29 90 71 1966-06-30 94 72 1966-07-01 87 71 1966-07-02 102 70 1966-07-03 105 75 1966-07-04 100 78 1966-07-05 87 74 1966-07-06 87 73 1966-07-07 93 76 1966-07-08 91 70 1966-07-09 89 67 1966-07-10 93 70 1966-07-11 96 72 1966-07-12 98 72 1966-07-13 100 77 - Today
-
90 yesterday, 90 again today so far. Kids love the heat.
-

2025-2026 ENSO
PhiEaglesfan712 replied to 40/70 Benchmark's topic in Weather Forecasting and Discussion
AMJ ENSO (ONI): -0.1C AMJ RONI: -0.49C June PDO: -2.51 -
The Queen City in Ohio joins the altered past climate group.....there really is a pattern here!

.gif.067d173478db611c6a4e368abf07b89a.gif)