All Activity
- Past hour
-
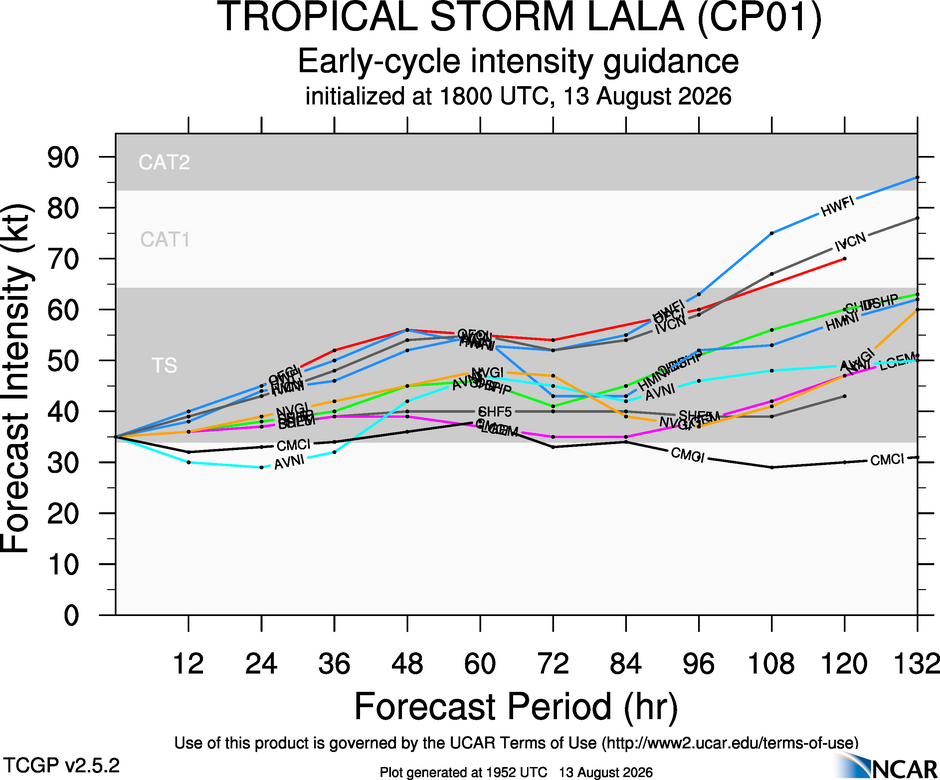
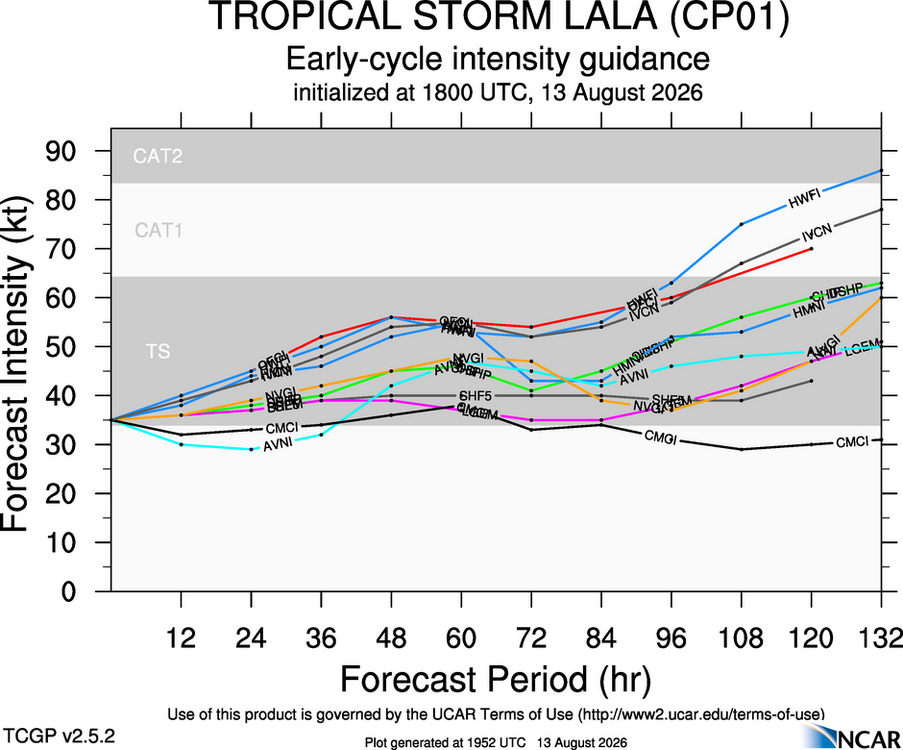
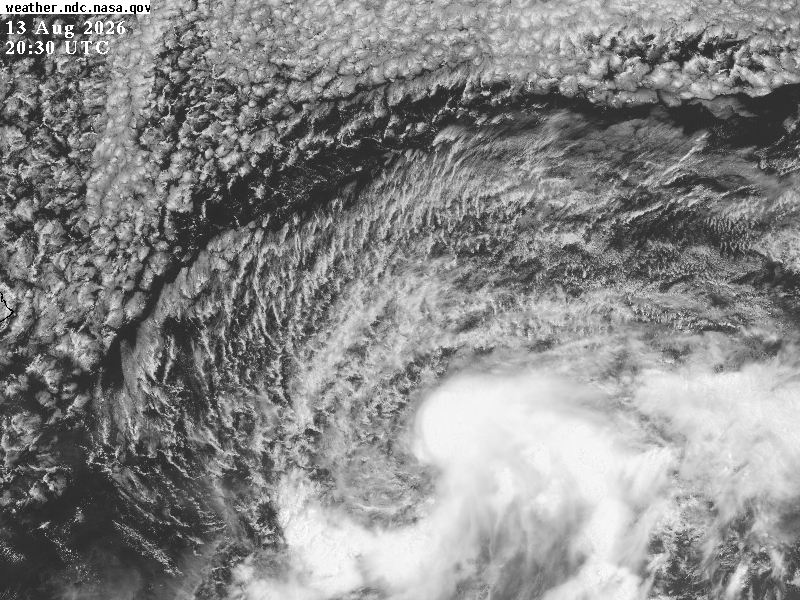
What model is this? Attached is main NHC model suite for intensity, and it looks reasonable given the environment. Regarding the environment, speculation for capping of intensity can be minimized b/c satellite tells the story. All the stratocu evident N and W of the TC indicates a stable atmosphere, which is not conducive for much strengthening beyond a minimal hurricane. See VIS image attached. 12z GFS gets it down to 996 mb near the Big Island before it weakens. ECMWF is the same. HAFS-A min is 998 mb and HAFS-B is 988 mb, but only b/c HAFS-B is farther S and doesn't get the circulation tangled w/ the mountains of the Big Island. That may happen b/c overall, there seems to be a S trendfor the track w/ the most recent model consensus.
-

Augdewst 2026: Summer's Last Stand
weatherwiz replied to Prismshine Productions's topic in New England
These outflow gusts are pretty nuts -

2026-2027 Record-breaking El Nino
michsnowfreak replied to Stormchaserchuck1's topic in Weather Forecasting and Discussion
It was wintry here, excellent thick ice cover on lakes and persistent snowcover. But actual snowfall wasnt impressive - BECAUSE of the cold, many storms tracked south. In fact, Detroit (39.5") received less snow than NYC (43.4") for just the 2nd time the past 20 years. Snow was in the air and on the ground near constantly though, so A+ scenary wise. Despite the slightly below avg snowfall, the winter ranked as "Severe" on the AWSI, a testament to the deep cold and lasting snowpack. It was one of those winters that the public perceived as harsh. My mom (a fellow winter lover) loved how every night looking out at her backyard the snow shimmered like a million diamonds. At NYC, the 43 days of 1"+ snowcover ranked 17th most since 1912. So, 115 years, 16 years had more snowcover and 98 years had less (so much for there always being snow on the ground when old timers were kids ). At Detroit, the 63 days with 1"+ snowcover ranked 28th most since 1908. Moving into this Nino, these are great examples why the snow-lover in me doesnt always want to see a deep blue map. So many moving parts for the coming winter, which is why I follow this thread with such interest. I do expect an overall subpar winter by MI standards, but theres so many different ways that could (or could not) happen. -
Sunday looks like the next heavy rain threat
-
Can't wait for Autumn. These dew points are horrible.
-
Records: Highs: EWR: 102 (2005) NYC: 99 (2005) LGA: 100 (2005) JFK: 92 (2005) Lows: EWR: 55 (1950) NYC: 55 (1930) LGA: 56 (1979) JFK: 56 (1979) Historical: 1795: A major hurricane only ten days after a previous storm struck North Carolina and produced high winds as far inland as Winston-Salem. At Monticello, near Charlottesville, Thomas Jefferson noted that the loss of soil from the heavy rain thus far that month could be "modestly estimated at a year's rent." (David Ludlum)A "powerful torrent of rain" deluged Petersburg; creeks were at their highest point of the past 70 years.The second hurricane of the year caused flooding in the Virginia and North Carolina area contributing to a very wet summer. (Ref. for Hurricane of 1795) 1831 - The Great Barbados Hurricane was an intense Category 4 hurricane that left cataclysmic damage across the Caribbean and Louisiana in 1831. From August 11 through the 13, Bermudians were amazed to see the sun with a decidedly blue appearance, giving off an eerie blue light when it shone into rooms and other enclosed places. Ships at sea as far west as Cape Hatteras reported that "their white sails appeared a light blue colour." A month later it was learned that the astounding blue sunlight had coincided with a terrible hurricane that caused 1,477 people to lose their lives. It was assumed that the hurricane was intensive enough to cause an unusual disturbance in the higher atmospheric strata, and refraction, diffraction or absorption of light rays, to produce the blue reflection. Because the sun appeared bluish-green, Nat Turner took this as the final signal and began a slave rebellion a week later on August 21. 1913: Indianapolis, IN received 1.30 inches of rain in 15 minutes, 1.98 inches in 30 minutes and 2.68 inches in one hour. (Ref. Wilson Wx. History) 1919 - High winds and heavy rain struck the Middle Atlantic Coast Region. In New Jersey, winds gusted to 60 mph at Atlantic City, and nine inches of rain fell at Tuckerton. The wind and rain leveled crops and stripped trees of fruit causing several million dollars damage. (David Ludlum) 1935: A severe thunderstorm collapsed the roof of the B&O Hall of Transportation Building in Baltimore, MD which housed the most important collection of railroad models, pictures, exhibits and stock in the world. Many old, fragile locomotives like the Tom Thumb and Thomas Jefferson steam engines escape destruction when the largest locomotives lined up in the center of the building acted to hold up the collapsing roof. The collection would again be damaged by a collapsing roof in 2003 when the snowstorm dumped a record 28.2 inches of snow in four days, including 21.8 inches on February 16th. (Ref. Wilson Wx. History) 1953: At 10 p.m. on the 13th, Hurricane Barbara struck the North Carolina coast between Morehead City and Ocracoke. The storm then moved north and northeast, before going out to sea just south of Norfolk. Winds reached 63 mph with gusts to 76 mph at Norfolk. Winds at Cape Henry were sustained at 72 mph. (Ref. Hurricanes Late 20century - Hurricane Barbara) 1955: Hurricane Connie dumped 5 to 8 inches of rain on Southeastern Pennsylvania, ending a drought that had been plaguing the area. (Ref. AccWeather Weather History)Boston, Massachusetts area had 25 people killed by Hurricane Connie. (Ref. NOAA Boston Weather Events) 1977: Lightning strike near Indian point, NY triggered massive 24 hour power blackout in NY City. (Ref. Wilson Wx. History) 1978: Four inches of snow at fell at Salmon, ND. (Ref. AccWeather Weather History) 1980 - The afternoon high at New York City was just 89 degrees. But there were fifteen days of 90 degree heat during the month, their hottest August of record. (The Weather Channel) 1985 - Hail larger than golf balls, driven by 70 mph winds, moved down crops, stripped trees, and broke windows, near Logan KS. Road graders cleared three foot drifts of hail on Kansas Highway 9 east of Logan. (The Weather Channel) 1987 - Thunderstorms deluged the Central Gulf Coast States with torrential rains. Thunderstorms in Mississippi drenched Marion County with up to 15 inches of rain during the morning hours, with 12.2 inches reported at Columbia. Floodwaters swept cars away in the Lakeview subdivision of Columbia when the the Lakeview Dam broke. Flash flooding caused more than three million dollars damage in Marion County. (The National Weather Summary) (Storm Data) 1988 - A dozen cities in the northeastern U.S. reported record high temperatures for the date. Lansing MI reported a record 35 days of 90 degree weather for the year, Detroit MI reported a record 37 days of 90 degree heat for the year, and Williamsport PA reported a record 38 days of 90 degree weather for the year. (The National Weather Summary) 1989 - Thunderstorms developing in a tropical airmass over the northeastern U.S. soaked Connecticut and Massachusetts with four to eight inches of rain over the weekend, between the 11th and 13th of the month. Hartford CT received 7.70 inches of rain. (The National Weather Summary) (Storm Data) 1991 - Stockton, California received 0.05 inch of rainfall on this day. Since 1949, this is the only measured rainfall in Stockton on August 13th. 1995: Chicago, IL was in the midst of a four day heat wave where temperatures climbed into the middle 90s and lows were in the mid to upper 70s. The low temperature of 77° on this date tied for the record high minimum. Humidity was high and 27 deaths were attributed to the heat wave. The majority was in the Chicago area. (Ref. Wilson Wx. History) 2004: Hurricane Charley unexpectedly underwent rapid strengthening, jumping from a Category 2 to a powerful Category 4 storm in a few hours, while at the same time taking a sharp turn to the northeast. Charley made landfall as a Category 4 hurricane near Punta Gorda, Florida. Although the storm caused serious damage, much of this was limited to a narrow swath associated with the hurricane's eye wall. Charley was a very fast-moving, compact storm, and so much of its damage was attributed to high winds rather than heavy rain. Charley remained a hurricane across the entire Florida peninsula and passed through Orlando and near Daytona Beach. (Ref. More Information on Hurricane Charley) 2014 - An official, New York State 24 hour precipitation record was set at Islip, NY on August 12-13 when 13.57" of rain fell. 2014: In the New York City metro area early (Wednesday August 13, 2014) more than a foot of rain fell in just a few hours, causing extensive flooding on Long Island. As of 10 a.m. ET, Islip, New York had received 13.27 inches of rain, which set a state record for the heaviest 24-hour rainfall total in state history. This broke the previous record of 11.6 inches, set at Tannersville, New York in August of 2011 during Hurricane Irene. NY state record for the heaviest 24-hour rainfall(Ref.BY ANDREW FREEDMAN) Midwest and Mid-Atlantic Flooding: August 11-13. Five inches of rain in 24 hours inundated Detroit, Michigan, submerging cars up to their roofs, in one of the city's worst flooding episodes on record. Flooding also hit the Baltimore, Maryland, and Washington, D.C., areas, and Islip, Long Island, New York, measured 13.26 inches in 24 hours, setting a new state record. Economic costs exceeded $2 billion.Ref. (Weatherwise MAY-JUNE 2015, page 14)
-
Just touched 90 here
-

Augdewst 2026: Summer's Last Stand
tunafish replied to Prismshine Productions's topic in New England
Heavy phil on the trees here in South Portland. 70mph gust at PWM. -
Yeah it is a weird one.
-

Augdewst 2026: Summer's Last Stand
KoalaBeer replied to Prismshine Productions's topic in New England
That storm broke summers back in Portland. 75F to 55 in minutes with a 69mph gust. Got a pretty good video looking out toward the jetport of that dowburst.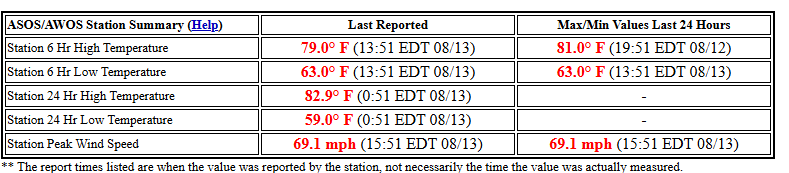
-
 http://mexisaferx.com/# mail order pharmacies
 -
My latest favorite weather app is EverythingWeather, which pulls all data directly from NWS (since they don't have an app). It even pulls space weather from SWPC.
-

2026-2027 Record-breaking El Nino
MJO812 replied to Stormchaserchuck1's topic in Weather Forecasting and Discussion
It was the snowiest in over a decade in NYC ( over 40 inches ) -
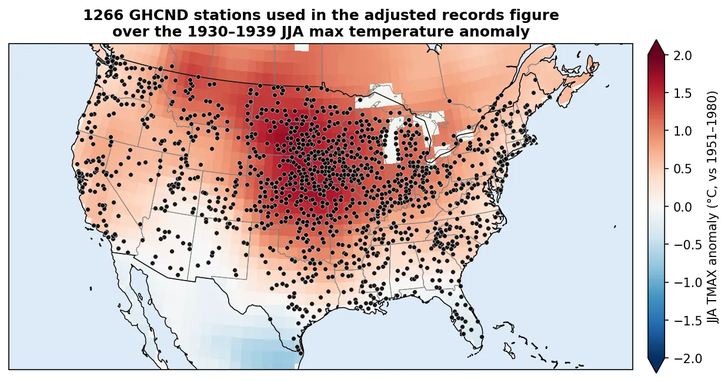
Nice analysis. Zeke Hausfather had a blog recently on how the 1930s warmth gets overestimated. Here's one of his plots. US stations were concentrated in the Great Plains in the 1930s, exactly where the warmth of the 1930s was focused. That is why it is important to grid the station data as you did. https://www.theclimatebrink.com/p/raw-data-wrong-answers
- Today
-

Augdewst 2026: Summer's Last Stand
vortex95 replied to Prismshine Productions's topic in New England
@CoastalWx : "What?, I HAZ snowed in August???!!!" -
This. Next winter might actually be a 0" for one of the nyc weather stations.
-
While the major 100° heat has been mostly focused in late June and July in recent years, September and October have been warming at a faster rate than the summer. NY Coastal Climate Division 1981-2025 Jun….+0.4 per decade Jul….+0.8 per decade Aug…+0.6 per decade Sep….+1.0 per decade Oct…..+1.0 per decade
-

Augdewst 2026: Summer's Last Stand
Lava Rock replied to Prismshine Productions's topic in New England
Posted on FB by someone on Sebago Lake -
Trust Pharma India [url=https://trustpharmaindia.com/#]Trust Pharma India[/url] Online medicine home delivery
-

Augdewst 2026: Summer's Last Stand
Damage In Tolland replied to Prismshine Productions's topic in New England
Not all CT …….soaked River west -
Was planning on hanging around Joshua Tree National Park a couple hours after sunset a couple nights ago, but had to get to Vegas by midnight to return the rental car. Did see the sunset from Keys View overlooking the Coachella Valley which was cool. Then stopped on the side of the road in the middle of the Mohave Desert so my son could pee. Stars were amazing and did see a bright meteor in those couple minutes.
-
Augdewst 2026: Summer's Last Stand
tunafish replied to Prismshine Productions's topic in New England
Or not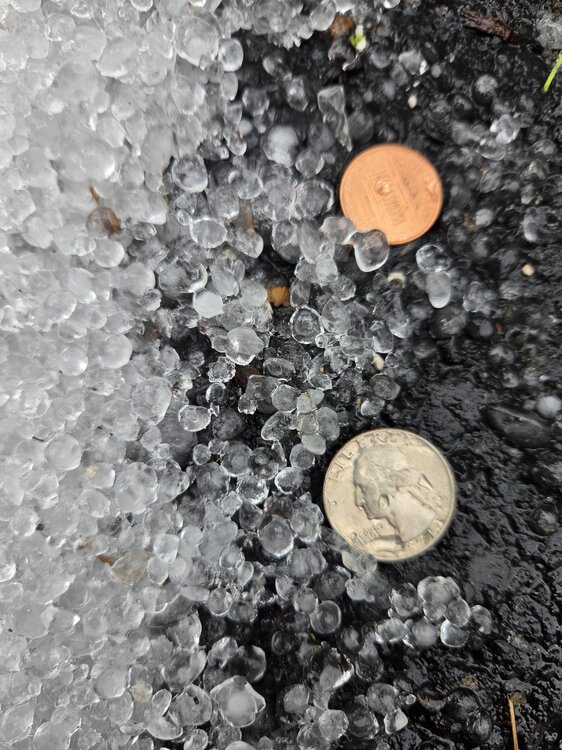
-
Augdewst 2026: Summer's Last Stand
vortex95 replied to Prismshine Productions's topic in New England
2026 - the year CT gets soaked and focused HVN-Hamden SVR! "Why can't that ever happen around Weymouth!?" -
Augdewst 2026: Summer's Last Stand
vortex95 replied to Prismshine Productions's topic in New England
-
You think ORH has a sub 10" seasonal total in the next 20 years?