All Activity
- Past hour
-
 Boom 90 Day 7 of longest 2025 heatwave rolls on
 -
Nice isolated shower here. Couple of rumbles.
-

Hurricane Erin: 160 MPH - 915mb - W @ 16
wthrmn654 replied to BarryStantonGBP's topic in Tropical Headquarters
-
Pretty sultry out there with dews pushing 80. Looks like today/tonight's action should just miss northeast. Matches up nicely with yesterday's miss west.
-
Hurricane Erin: 160 MPH - 915mb - W @ 16
wthrmn654 replied to BarryStantonGBP's topic in Tropical Headquarters
The eye is getting smaller atleast looking at a loop of it just now -
Hurricane Erin: 160 MPH - 915mb - W @ 16
Windspeed replied to BarryStantonGBP's topic in Tropical Headquarters
RE: US impacts, despite the westward adjustments, they overall will not change. The 500 dm heights of the WATL ridge may be slightly underdone versus modeling, and Erin may also be pumping the SW periphery at present due to its extreme intensity; however, the mid-latitudinal troughs are still coming with a dome behind them that is on a collision course with Erin by 70°W. Erin will go with the southerly flow as Azores ridging drops SW, hooking it N, then NE and swiftly out into the North Atlantic. Interestingly, Erin's deep transition combined with strong rebuilding of the Bermuda extension of WATL heights late next week may spell trouble for what might be down the pipeline, however. But we'll save that for the main seasonal thread. -

Hurricane Erin: 160 MPH - 915mb - W @ 16
WxWatcher007 replied to BarryStantonGBP's topic in Tropical Headquarters
Still impacts out there. The Virgin Islands are under a flash flood warning and are getting lashed by rain bands. -

Hurricane Erin: 160 MPH - 915mb - W @ 16
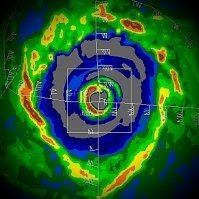
hawkeye_wx replied to BarryStantonGBP's topic in Tropical Headquarters
I sure would love to have a plane in there right now. The CDO is looking vicious. -
Hurricane Erin: 160 MPH - 915mb - W @ 16
wthrmn654 replied to BarryStantonGBP's topic in Tropical Headquarters
Insane that the euro shifted west, icon is west and euro AI is west... of course there not tropical models but still insane -
Nope, now I’m out in Dt Frederick (friend is visiting). Sun is shining and hitting up Maxwell’s (the walk back to Baker is gonna be tough lol).
-
From the main thread.
-
Erin's RI was insane as much as it was almost predictable with the hand it was dealt. Sent from my SM-G970U1 using Tapatalk
-

Hurricane Erin: 160 MPH - 915mb - W @ 16
WxFreak11 replied to BarryStantonGBP's topic in Tropical Headquarters
Thankfully we can enjoy the absolute magnificence of Erin with no land masses affected. This would have been catastrophic if it hit land. . -

Hurricane Erin: 160 MPH - 915mb - W @ 16
jconsor replied to BarryStantonGBP's topic in Tropical Headquarters
Powerful Hurricane Erin continues to track on the southern edge of the model spread on Sat, as shown in the attached image. Erin's actual track in six hour increments is shown in the black X's, with NHC's main consensus forecast model TVCN shown in blue, with darker shades indicating more recent forecast model runs. You can see Erin made a notable bend to the left (turning from west-northwest to due west) in the past 12-18 hours and is currently about 50-75 miles south of consensus model forecasts from 24 hours ago. Here's an in-depth post I wrote on Fri describing my concerns that ensemble forecasts are underdoing W. Atl ridging, and explaining why US impacts can't be ruled out yet. It wasn't posted until now due to coming down with a stomach virus and some technical issues. My thoughts on Erin's track and potential US impacts haven't changed much since Fri. Would appreciate if you can take a look at the post and send me feedback (you can PM me here or write to [email protected]), as well as spread the word about my Substack. Thank you guys! https://hurricanehacker.substack.com/p/arrested-development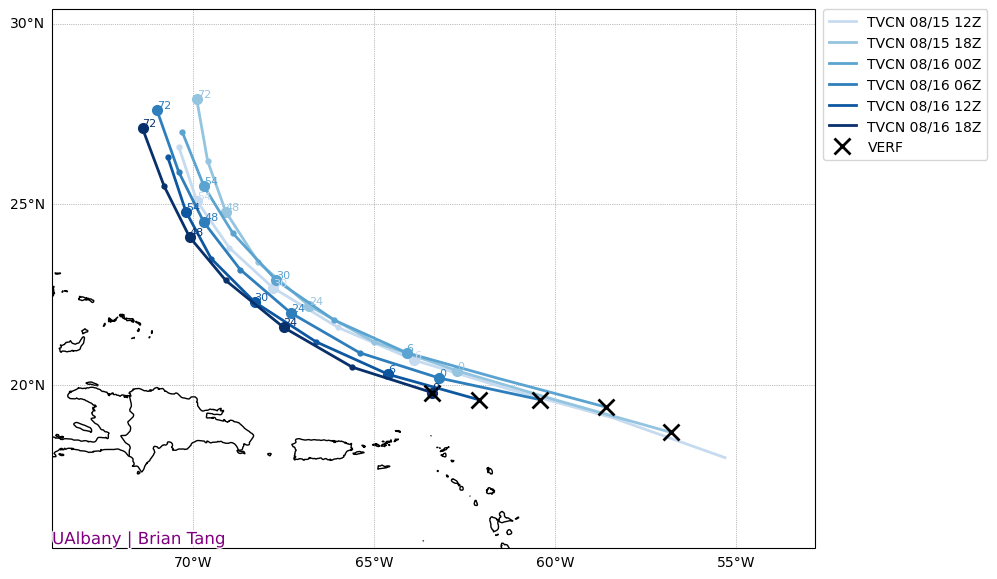
-
It did that before and snapped right back within one cycle. I think it’s still an outlier until other guidance (GFS) comes along. The only thing that was of modest interest to me though on that run was something I noted days ago. Depending on the timing of the trough there may be a fast moving PRE that sets up somewhere. Again, unless the Euro knows what it’s doing this is all moot. ——— THIS IS A WEENIE PRODUCT FOR INEEDSNOW
-
Let the social media panic begin Sent from my Pixel 9 Pro XL using Tapatalk
-
Hurricane Erin: 160 MPH - 915mb - W @ 16
Windspeed replied to BarryStantonGBP's topic in Tropical Headquarters
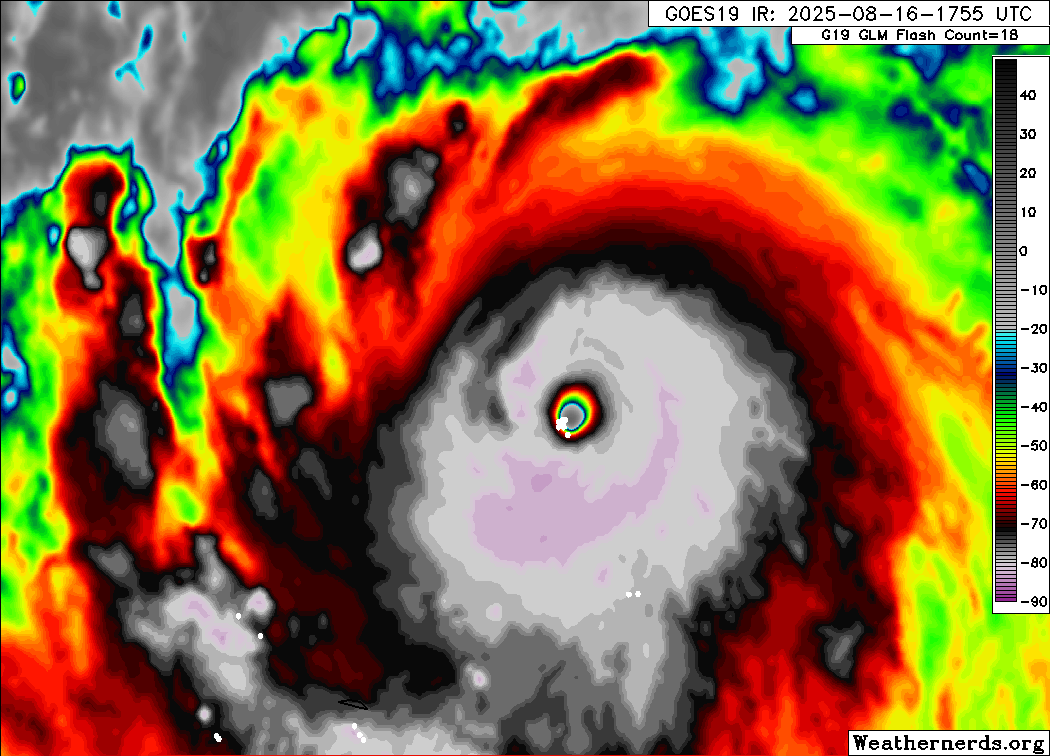
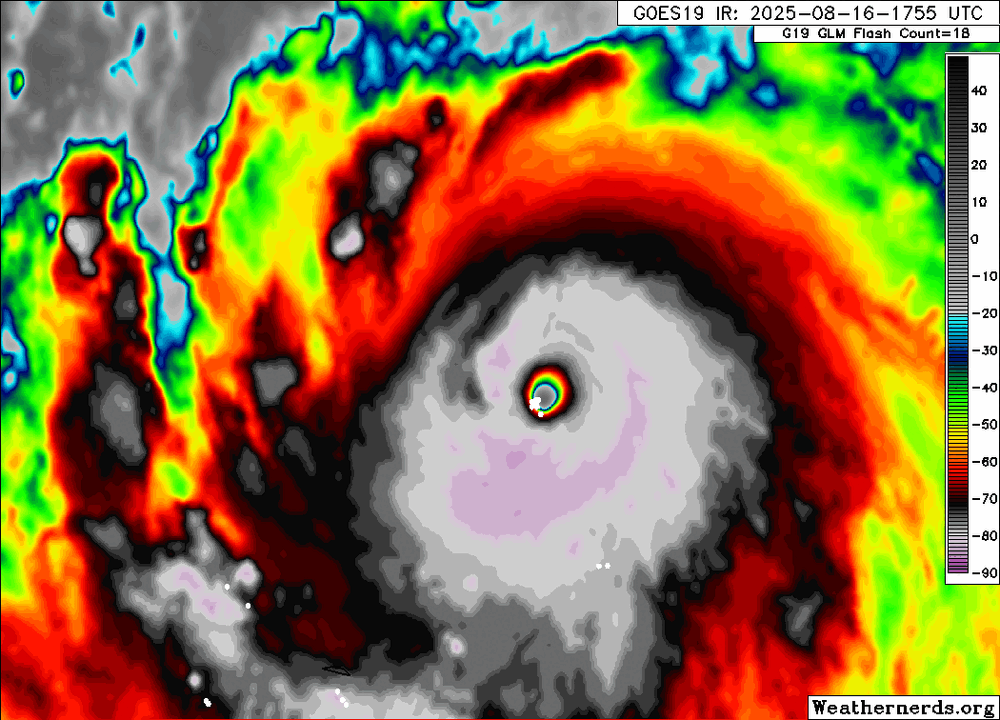
I dare say Erin has continued to deepen merely looking at radar and satellite imagery. We may be looking at a sub 910 hPa Atlantic hurricane now. This eyewall has taken on Irma and Dorian visuals for that location of the Atlantic Basin. -
Hurricane Erin: 160 MPH - 915mb - W @ 16
hawkeye_wx replied to BarryStantonGBP's topic in Tropical Headquarters
Erin appears to be strengthening a bit again. The ring around the center has become more uniform and the cloud tops have cooled. -

2025 Short Range Severe Weather Discussion
A-L-E-K replied to Chicago Storm's topic in Lakes/Ohio Valley
Looks like action expected around my arrival time, blessed -
12z Euro way west. Scrapes outer banks and maybe even lower Delmarva with outer rain bands.
-
Hurricane Erin: 160 MPH - 915mb - W @ 16
Windspeed replied to BarryStantonGBP's topic in Tropical Headquarters
scheiße... - Today
-
Wish we had this kind of weather AND the sun setting after 8:30pm.
-
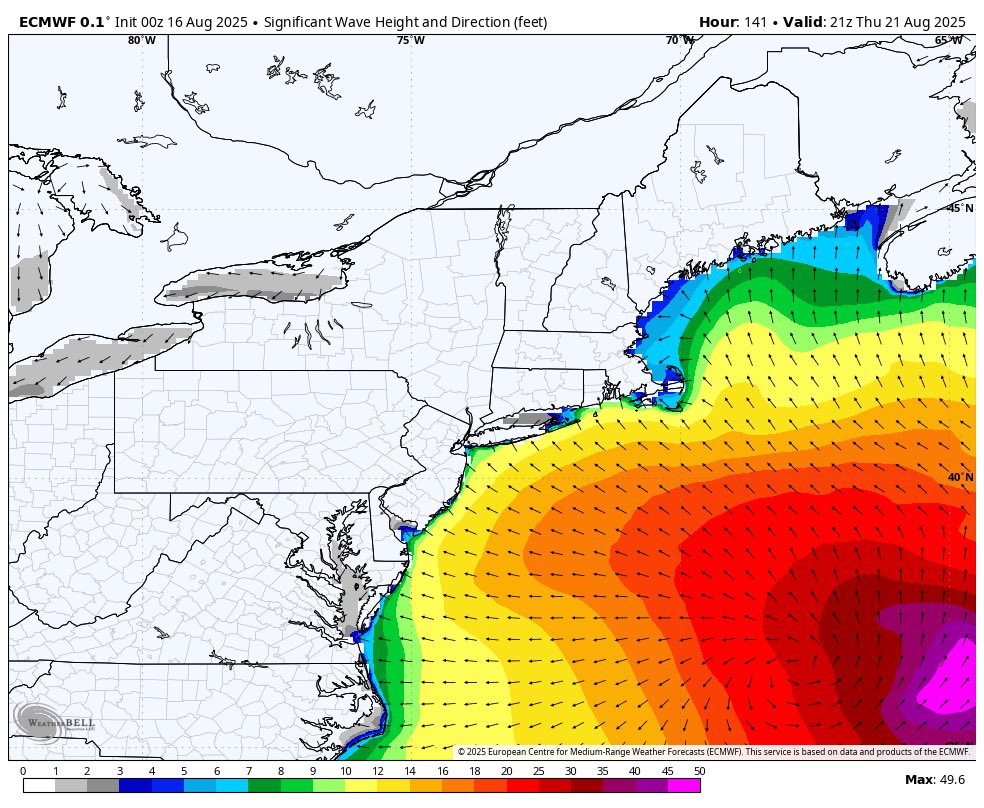
 It’s been a while since we had a 10”+foot hurricane swell in August.
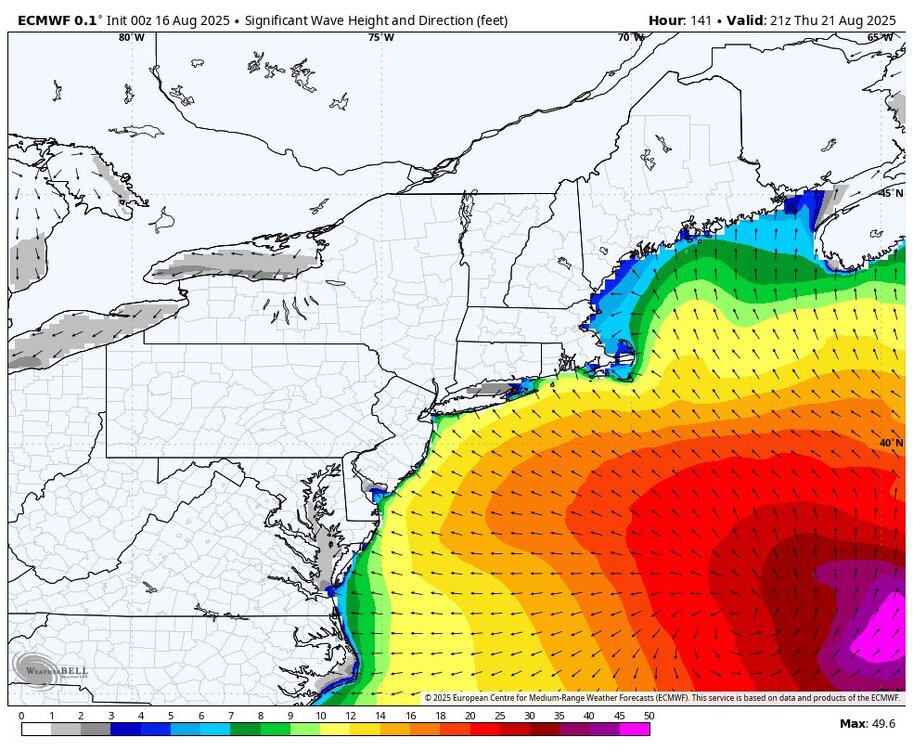
-
Just an FYI...it's not wise to make generalized statements based primarily on one station's data. Due to a major increase in UHI in Phoenix, that station has a much larger temperature increase trend compared to places that haven't seen that much UHI increase. PHX has seen their mean temperature go up nearly 3.5 degrees since the 1960s. Meanwhile, Flagstaff (which has seen virtually no increase in UHI) has only warmed about a degree over that same period, much more in line with global temp trends. Tucson has seen 1.5 degrees warming. So that chart, while accurate for Phoenix, is certainly exaggerated for the region overall.
.thumb.png.4150b06c63a21f61052e47a612bf1818.png)