donsutherland1
-
Posts
24,194 -
Joined
Content Type
Profiles
Blogs
Forums
American Weather
Media Demo
Store
Gallery
Everything posted by donsutherland1
-
That it will turn colder is likely. Some of the other outcomes depend on a range of factors (cross-polar flow, shortwaves, blocking, synoptic pattern/details, etc.), leading to greater uncertainty. Thus, they were listed as key uncertainties. Best guess: A 2-3 week period with generally colder than normal temperatures (probably running into the first week in March). No single digits in Central Park, but one or more days with lows in the teens. Several light snow events with perhaps a moderate event (3"-4"), which would wind up being this season's biggest event. No big events of 6" or more. All of this will culminate in a winter that will wind up being warmer than normal (likely including February's having a warm anomaly, in large part, due to the very warm first 10-14 days) and much below normal seasonal snowfall by the conclusion of the snow season. This guess is based on the combination of the guidance and statistical outcomes. It should be noted that 46-day maps or 46-day charts have very little skill overall in terms of specifics. Indeed, if they did, the NYC area wouldn't be looking at the distinct possibility of seeing an unprecedented second consecutive season with less than 10" snowfall. I think we'll avoid that outcome, but should February wind up less snowy than I'm thinking, then my thinking on that matter will likely be wrong.
-
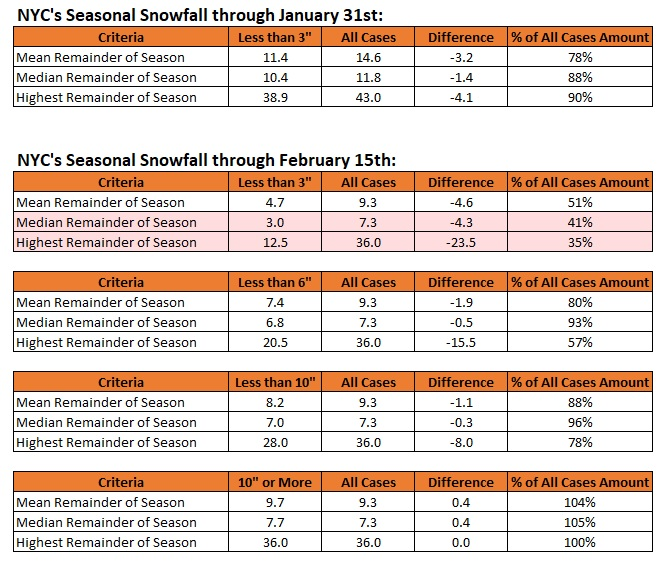
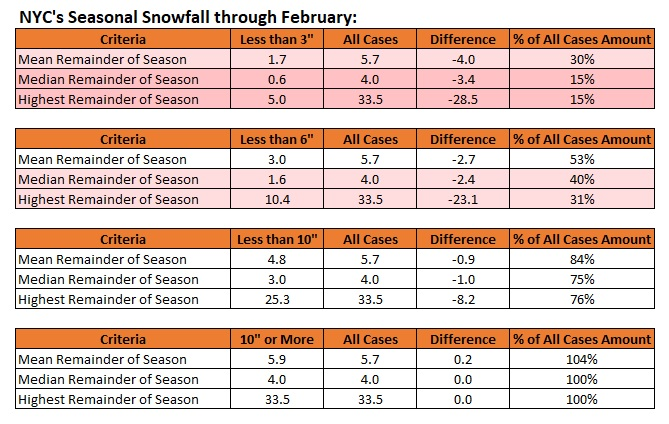
There's a table that shows mean/median/highest snowfall for the remainder of the snow season if NYC has less than 3", less than 6", less than 10", or 10" or more snow through February 15th.
-
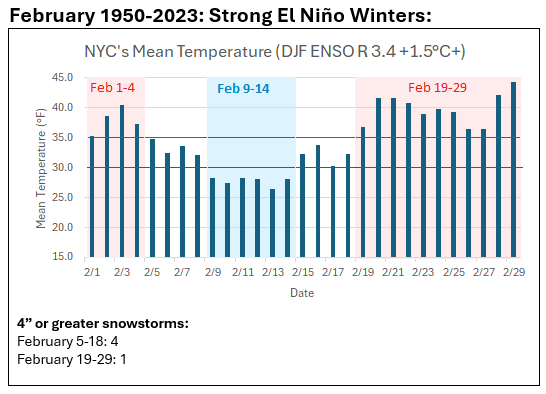
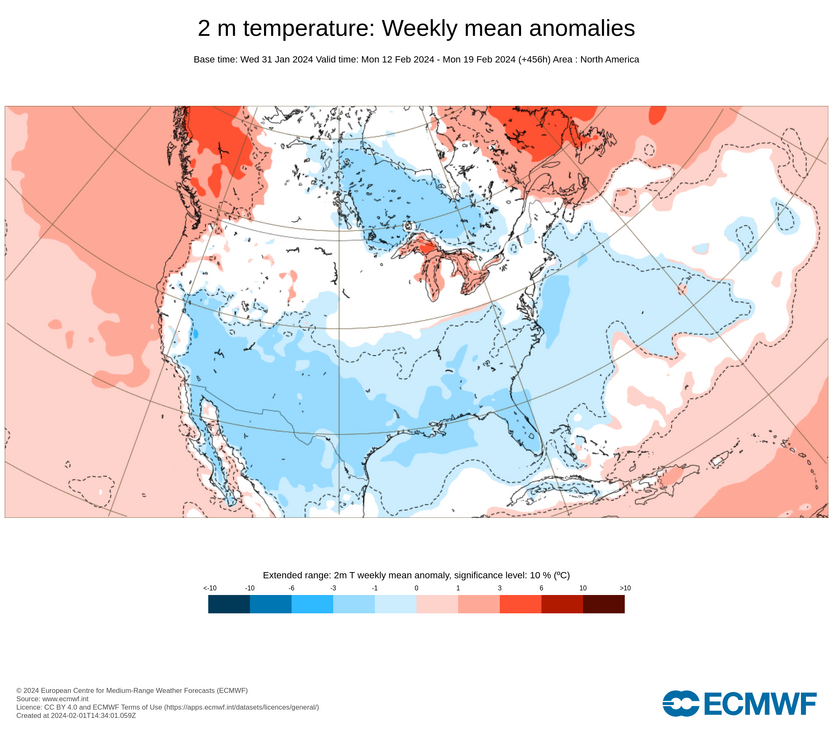
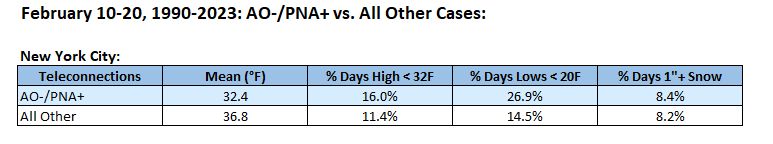
Near Mid-February Pattern Change: Even as generally warmer than normal weather will continue into at least the second week of this month, the idea that there will be a transition toward a sustained colder pattern beginning late in the second week of the month as mid-month approaches +/- a few days remains largely on track. Confidence in the idea is above average despite lower model/ensemble skill at that forecasting range for several reasons: Consistent signal on the ECMWF weeklies Outcomes consistent with AO-/PNA+ patterns during February 10-20 Historic strong El Niño climatology for February that favors colder weather before and around mid-month (existence of a cold period) ECMWF Weekly Forecast (February 12-19, 2024): AO-/PNA+ Outcomes: Sample sizes: AO-/PNA+: 119 days, All Other Cases: 255 days The timing would be somewhat later than is typical for strong El Niño winters. Such winters typically see their coldest February temperatures just before mid-month. Late in the month, readings warm up. If historic climatology provides some insight into the upcoming pattern evolution, the colder pattern could persist into the first week of March given the timing of its onset. Snowfall: Although snowfall details remain uncertain given the variables involved, should snowfall remain lower or much lower than normal as the month advances, the probability of much below normal seasonal snowfall for Winter 2023-2024 as a whole would increase. Below to much below normal seasonal snowfall from February 1-April 30 is more likely than not given historic experience with winters that have featured the kind of warmth and lack of snowfall seen through January 31st. Key Uncertainties: Whether there would be severe cold with low temperatures falling to the single digits on one or more days. Frequency and amount of snowfall. Whether there would be any significant (6" or above) snowstorms. Duration and magnitude of the cold period.
-
Winter 1895-96 had an even 3" at the end of January. I looked at cases with below 3".
-
Quantum computing should dramatically expand the kind of problems that can be addressed by computers.
-
The final numbers were Boise: 66 and International Falls: 53.
-
January is concluding with a monthly mean temperature of 37.0° in New York City. That is 3.3° above normal. The December 1-January 31 mean temperature will be 40.8°, which ranks 5th highest on record. With the exception of Winter 1931-32, all of the five warmest December-January periods have occurred since 2000. Records go back to 1869. Clouds could persist through much of tomorrow. It will turn milder with readings returning to the middle and upper 40s across the region. Philadelphia and southward could see the thermometer reach or exceed 50°. Showers and possibly a period of light rain is likely late tomorrow and tomorrow night. Friday through the weekend should feature dry and mild readings. The generally mild conditions will likely continue into at least the second week of February with only brief interruptions. No Arctic air is likely to reach the area during this time. The second week of February could see the evolution toward a sustained colder pattern begin late that week. Overall, February will likely wind up warmer than normal even as the second half of the month could see a sustained period of colder weather. Seasonal snowfall in New York City stood at 2.3" at the close of January. There were 19 prior winters that saw less than 3" of snow through January 31st. The mean snowfall for the remainder of the snow season for those winters was 11.4". The median snowfall was 10.4". The highest snowfall was 38.9" in 1914 with a blizzard on March 1-2 bringing 14.5" of snow. The historic figures for all winters are 14.6" and 11.8" respectively. The ENSO Region 1+2 anomaly was +0.7°C and the Region 3.4 anomaly was +1.7°C for the week centered around January 24. For the past six weeks, the ENSO Region 1+2 anomaly has averaged +0.97°C and the ENSO Region 3.4 anomaly has averaged +1.87°C. A basinwide El Niño event is ongoing. The ongoing El Niño event will continue to fade through much of February. The SOI was -21.52 today. The preliminary Arctic Oscillation (AO) was +3.079 today. On January 29 the MJO was in Phase 7 at an amplitude of 2.171 (RMM). The January 28-adjusted amplitude was 2.393 (RMM).
-
Yes, modification and refinement are likely. It's disappointing how painfully slow progress has been on development of a theory of quantum gravity, but the challenge is a very difficult one. Hopefully, advancing AI will be able to assist in that effort in the not too distant future.
-
This afternoon, Boise has reached 65° and International Falls has reached 50°, both setting January record high temperatures. Some of this warmer air will reach the East leading to a mild start to February. No Arctic shots appear likely through the first week of the coming month, and likely longer. However, it continues to look cooler toward mid-February, which would also be consistent with strong El Niño climatology.
-
The beauty of science is that it is evidence-based. It is also flexible to evidence-based changes in understanding. There is no constraint that any idea or theory is so important that it must be preserved regardless of the evidence. Such rigidity is counterproductive. Of course, evidence needs to be sufficient and credible to result in changes in understanding. Having said that, many understandings are unlikely to be overturned, even as further refinements are possible. Theories related to the Big Bang, General Relativity, Evolution, etc. are among those that will likely stand the test of time.
-
Unfortunately, the 12z RGEM shows no snowfall.
-
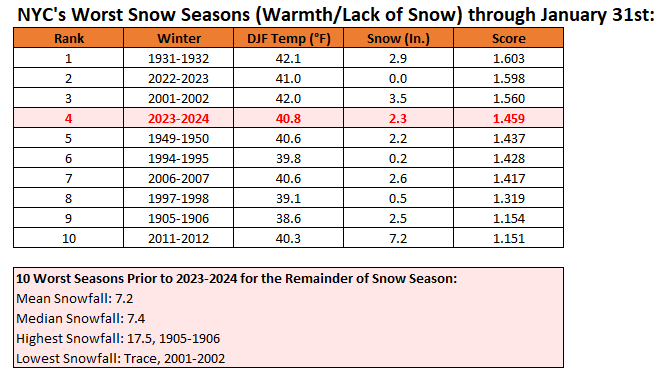
2001-02 would rank first at the end of the season.
-
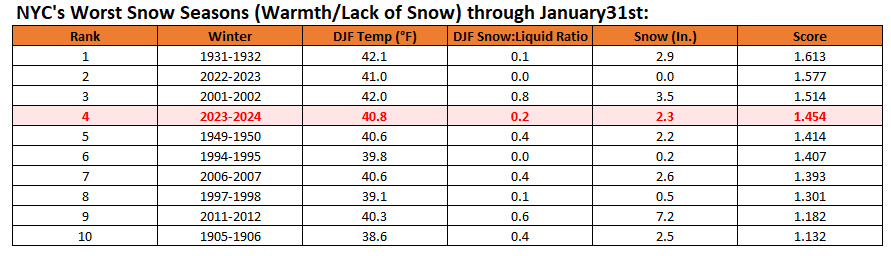
Adding a precipitation variable resulted in very few changes e.g., 1905-06 dropped from 9th to 10th. Simpler version: Expanded Version:
-
The data for clouds/sunshine is very limited (goes back to the 1990s). I will incorporate a rainfall variable (% of precipitation that falls as snow) into the mix later today.
-
New York City will have a Dec-Jan mean temperature of 40.8. This will mark the 9th winter with a Dec-Jan mean temperature of 40 or above, with 6 occurring since 2000. This will be the first case of 2 consecutive such winters. Records go back to 1869.
-
Unfortunately, the dataset for cloudy days only goes back to the late 1990s.
-
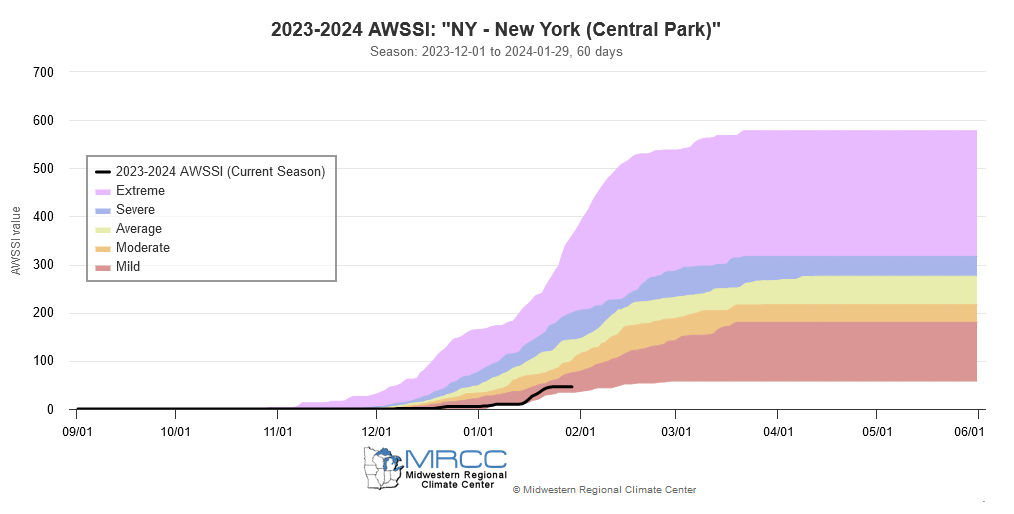
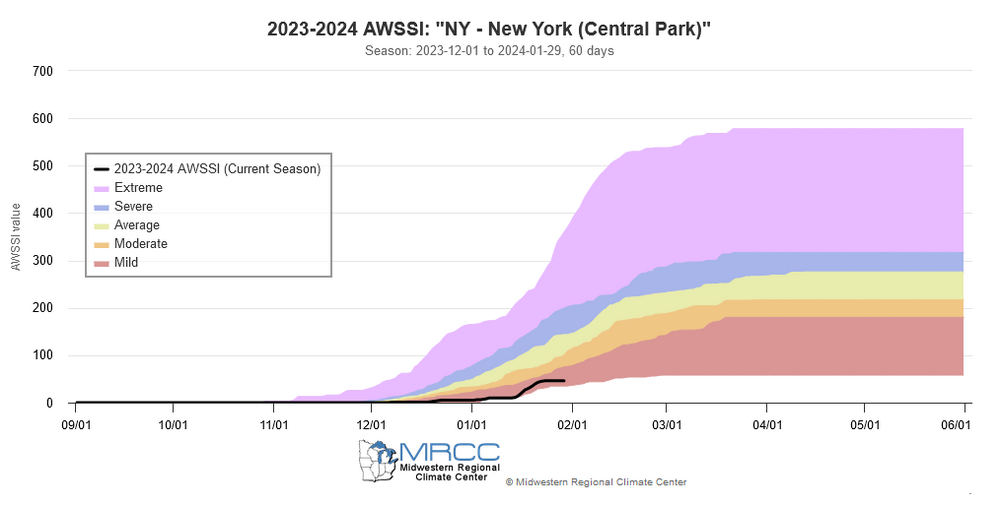
Winter 2023-2024 now ranks as the 4th worst winter in terms of warmth and lack of snowfall through January 31st: It is also categorized as a "mild" season on the Accumulated Winter Season Severity Index (AWSSI). The AWSSI is based on a more limited data set.

-
DCA _ NYC _ BOS __ ORD _ ATL _ IAH __ DEN _ PHX _ SEA 1.4 1.6 1.5 4.5 -0.1 0.6 3.0 0.0 3.0
-
Flurries in Larchmont.
-
I'm not surprised that somewhere in BC had zero sunshine. I suspect that somewhere in the Pacific Northwest would be the place to achieve it.
-
Generally dry weather will continue through much or all of the week, even as some flurries or drizzle is possible overnight. Clouds could persist into or through Thursday. January will wind up as a solidly warmer than normal month and Winter 2023-24 will become yet another warmer than normal winter in the New York City and Philadelphia areas. The generally mild conditions will likely continue through the first week of February with only brief interruptions. No Arctic air is likely to reach the area during this time. The second week of February could see the evolution toward a sustained colder pattern begin late in the week. There has been some increase in uncertainty concerning the timing of such an evolution. The overall February outlook remains uncertain. The outcome will be a function of often counteracting forces: the decay of the strong El Niño/ENSO region developments, concurrent marine heatwaves, shifting teleconnections, tropical convection, and ongoing background warming, among other factors. The ECMWF weeklies continue to show a shift toward a sustained colder pattern near mid-month, which would be consistent with strong El Niño climatology. However, there are some cautionary notes. For example, if the ENSO Region 1+2 anomaly averages +0.15°C or above, that typically results in a warmer, less snowy outcome for New York City for February cases with ENSO Region 3.4 anomalies of +0.50°C or above than those with a colder average anomaly for Region 1+2 (NYC monthly mean temperature: 35.0° vs. 31.2°; NYC average monthly snowfall: 6.0" vs. 16.4"). February 2016 (4.0") was a recent example of a warmer Region 1+2 case. February 2010 (36.9") was a recent example of a colder Region 1+2 cases. There can be exceptions. One exception was February 1983 that saw 21.5" of snow, largely from a major blizzard, despite an average Region 1+2 anomaly of +1.55°C. No snowfall is expected through the remainder of January. In New York City, there were 19 winters that saw less than 3" of snow through January 31st. The mean snowfall for the remainder of the snow season for those winters was 11.4". The median snowfall was 10.4". The highest snowfall was 38.9" in 1914 with a blizzard on March 1-2 bringing 14.5" of snow. The historic figures for all winters are 14.6" and 11.8" respectively. The ENSO Region 1+2 anomaly was +0.7°C and the Region 3.4 anomaly was +1.7°C for the week centered around January 24. For the past six weeks, the ENSO Region 1+2 anomaly has averaged +0.97°C and the ENSO Region 3.4 anomaly has averaged +1.87°C. A basinwide El Niño event is ongoing. The ongoing El Niño event will continue to fade through much of February. The SOI was -18.04 today. The preliminary Arctic Oscillation (AO) was +1.973 today. On January 28 the MJO was in Phase 7 at an amplitude of 2.393 (RMM). The January 27-adjusted amplitude was 2.521 (RMM). Based on sensitivity analysis applied to the latest guidance, there is an implied near 100% probability that New York City will have a warmer than normal January (1991-2020 normal). January will likely finish with a mean temperature near 37.0° (3.3° above normal).
-
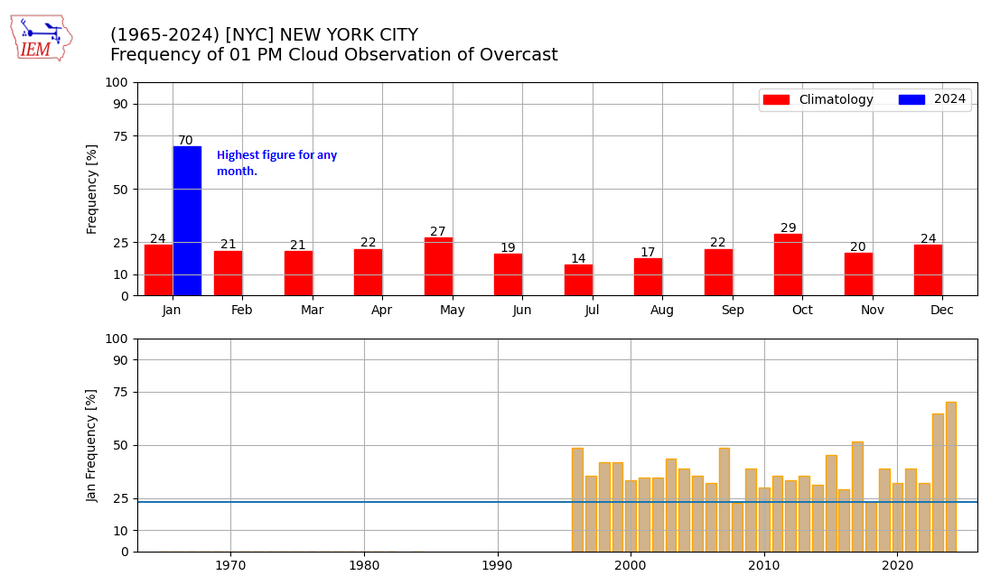
Through 1 pm, New York City has had 273 hours with overcast conditions. 21 days have seen overcast conditions at 1 pm. That is the most days for any month at 1 pm.
-
"Day after day, day after day, We stuck. No cold. No snow..." --Adapted from English poet Samuel Taylor Coleridge's "The Rime of the Ancient Mariner" Today, New York City and Newark have reached their 731st consecutive day on which there has been less than 2" daily snowfall. Following on the heels of New York City's least snowy winter on record, Winter 2023-2024 will record just 2.3" of snow through January. Prospects for a moderate or greater snowstorm remain bleak through at least the first week of February and beyond into the thick fog of low model skill. Below are some tables showing how New York City's snow season has fared after January, after February 15th, and after February. Comparisons are made between select season-to-date snowfall amounts and historic climatology (all cases). If New York City cannot muster 6" or more seasonal snowfall by the end of February, the City will be looking at a distinct possibility of recording its first case of two consecutive snow seasons with less than 10" of total snowfall.
-
It would be nice to see a little snow, but drizzle is a possibility.
-
In the wake of the region's most recent storm, generally dry weather will return and continue through much or all of the week. Clouds could still persist into the middle of the week. Based on January's warmth, January will wind up as a solidly warmer than normal month and Winter 2023-24 will become yet another warmer than normal winter in the New York City and Philadelphia areas. The generally mild conditions will likely continue through the first week of February with only brief interruptions. No Arctic air is likely to reach the area during this time. The second week of February could see the evolution toward a sustained colder pattern begin late in the week. There has been some increase in uncertainty concerning the timing of such an evolution. The overall February outlook is unusually uncertain. The outcome will be a function of often counteracting forces: the decay of the strong El Niño/ENSO region developments, concurrent marine heatwaves, shifting teleconnections, tropical convection, and ongoing background warming, among other factors. The ECMWF weeklies continue to show a shift toward a sustained colder pattern near mid-month, which would be consistent with strong El Niño climatology. However, there are some cautionary notes. For example, if the ENSO Region 1+2 anomaly averages +0.15°C or above, that typically results in a warmer, less snowy outcome for New York City for February cases with ENSO Region 3.4 anomalies of +0.50°C or above than those with a colder average anomaly for Region 1+2 (NYC monthly mean temperature: 35.0° vs. 31.2°; NYC average monthly snowfall: 6.0" vs. 16.4"). February 2016 (4.0") was a recent example of a warmer Region 1+2 case. February 2010 (36.9") was a recent example of a colder Region 1+2 cases. There can be exceptions. One exception was February 1983 that saw 21.5" of snow, largely from a major blizzard, despite an average Region 1+2 anomaly of +1.55°C. The ENSO Region 1+2 anomaly was +0.7°C and the Region 3.4 anomaly was +1.7°C for the week centered around January 24. For the past six weeks, the ENSO Region 1+2 anomaly has averaged +0.97°C and the ENSO Region 3.4 anomaly has averaged +1.87°C. A basinwide El Niño event is ongoing. The ongoing El Niño event will continue to fade. The SOI was -16.25 today. The preliminary Arctic Oscillation (AO) was +1.528 today. On January 27 the MJO was in Phase 6 at an amplitude of 2.521 (RMM). The January 26-adjusted amplitude was 2.423 (RMM). Based on sensitivity analysis applied to the latest guidance, there is an implied near 100% probability that New York City will have a warmer than normal January (1991-2020 normal). January will likely finish with a mean temperature near 36.9° (3.2° above normal).