

donsutherland1
-
Posts
24,112 -
Joined
Content Type
Profiles
Blogs
Forums
American Weather
Media Demo
Store
Gallery
Everything posted by donsutherland1
-
Arctic Sea Ice Extent, Area, and Volume
donsutherland1 replied to ORH_wxman's topic in Climate Change
On November 18, 2016 Arctic Sea Ice Extent (JAXA) was 8,320,714 square kilometers. That was a decline of 97,385 square kilometers from the previous day. It is also 948,831 square kilometers below the previous record minimum for the date of 9,269,545 square kilometers, which was set in 2012. The biggest 1-day declines in the October 1-December 31 timeframe: 1. 97,385 sq. km., 11/18/2016 (exceeded the biggest 2-day decline for this timeframe). 2. 54,064 sq. km., 12/25/2011 3. 53,292 sq. km. 12/1/2007 4. 51,274 sq. km. 12/17/2011 5. 48,440 sq. km. 10/25/2009 The November 17, 2016 decline of 46,717 square kilometers ranked 6th biggest for this timeframe. The 11/17-18/2016 2-day decline of 144,102 square kilometers exceeded the previous record of 81,804 square kilometers, which was established on 12/1-2/2007. -
Arctic Sea Ice Extent, Area, and Volume
donsutherland1 replied to ORH_wxman's topic in Climate Change
It was working this morning. Perhaps there's a temporary issue that is sending visitors to the site's twitter stream. -
Arctic Sea Ice Extent, Area, and Volume
donsutherland1 replied to ORH_wxman's topic in Climate Change
You can find the data here: http://ocean.dmi.dk/arctic/meant80n.uk.php -
Arctic Sea Ice Extent, Area, and Volume
donsutherland1 replied to ORH_wxman's topic in Climate Change
It does. To date, 2016 has set daily minimum records on 46% of days this year. -
Arctic Sea Ice Extent, Area, and Volume
donsutherland1 replied to ORH_wxman's topic in Climate Change
The 9/6 Arctic sea ice extent figure on JAXA was 4,022,615 square kilometers. That was a decrease of 22,855 square kilometers from 9/5. It would represent the 2nd lowest minimum figure on record. -
Arctic Sea Ice Extent, Area, and Volume
donsutherland1 replied to ORH_wxman's topic in Climate Change
9/5 JAXA figure: 4,045,470 square kilometers, down 10,836 kilometers. This would be the second lowest minimum figure on record. -
Arctic Sea Ice Extent, Area, and Volume
donsutherland1 replied to ORH_wxman's topic in Climate Change
9/4 JAXA figure: 4,056,306 square kilometers. This was a slight increase from 9/3, but it is not likely the minimum for this year. -
Arctic Sea Ice Extent, Area, and Volume
donsutherland1 replied to ORH_wxman's topic in Climate Change
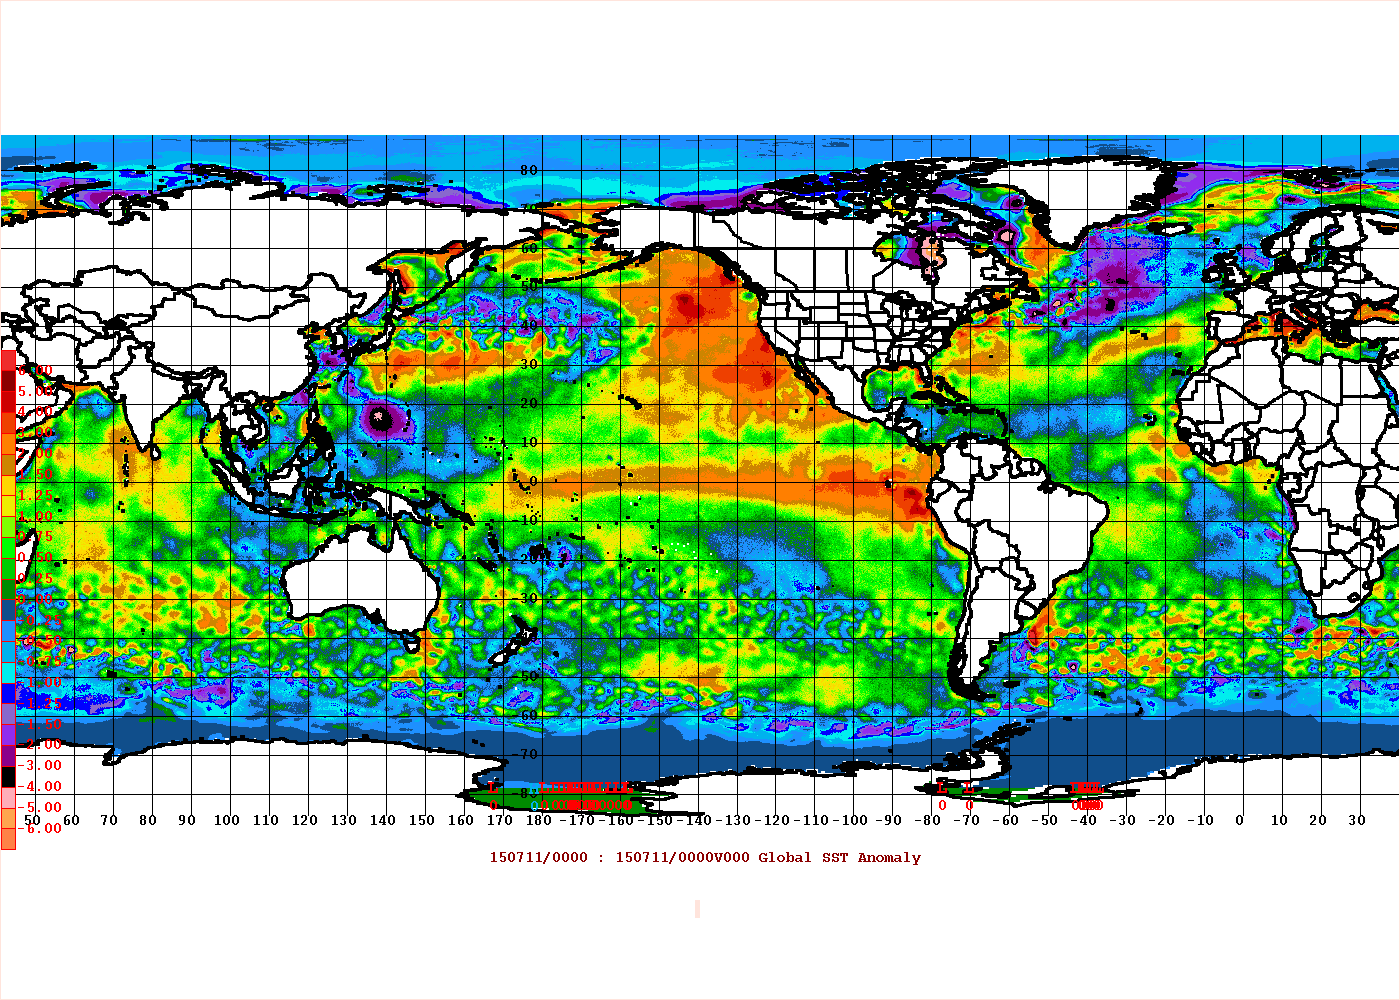
Arctic sea ice extent falls to 2nd lowest on record... The 9/3 figure on JAXA was 4,054,179 square kilometers. That would ranks as the 2nd lowest minimum figure on record. Only 2007 (4,065,739 square kilometers) was lower. The 5-year average decline in sea ice extent from 9/3 would produce a minimum figure of 3,852,090 square kilometers. The minimum decline (2002-15) would result in a figure of 3,950,344 square kilometers. The maximum decline (2002-15) would result in a minimum figure of 3,647,151 square kilometers. A minimum extent under 4,000,000 square kilometers appears very likely (> 90%) and a figure just under 3,900,000 square kilometers appears possible. -
Arctic Sea Ice Extent, Area, and Volume
donsutherland1 replied to ORH_wxman's topic in Climate Change
The 9/2 figure on JAXA was 4,090,129 square kilometers. That would rank as the 3rd lowest minimum figure on record. Only 2012 (3,177,455 square kilometers) and 2007 (4,065,739 square kilometers) were lower. The 5-year average decline in sea ice extent from 9/2 would produce a minimum figure of 3,875,040 square kilometers. The minimum decline (2002-15) would result in a figure of 4,000,554 square kilometers. The maximum decline (2002-15) would result in a minimum figure of 3,610,482 square kilometers. A minimum extent under 4,000,000 square kilometers appears very likely and a figure just under 3,900,000 square kilometers appears possible. -
Arctic Sea Ice Extent, Area, and Volume
donsutherland1 replied to ORH_wxman's topic in Climate Change
The 9/1 figure on JAXA was 4,168,394 square kilometers. That would rank as the 3rd lowest minimum figure on record. Only 2012 (3,177,455 square kilometers) and 2007 (4,065,739 square kilometers) were lower. The 5-year average decline in sea ice extent from 9/1 would produce a minimum figure of 3,931,250 square kilometers. The minimum decline (2002-15) would result in a figure of 4,050,385 square kilometers. The maximum decline (2002-15) would result in a minimum figure of 3,663,584 square kilometers. A minimum extent under 4,000,000 square kilometers appears likely and a figure just under 3,900,000 square kilometers appears possible. -
Arctic Sea Ice Extent, Area, and Volume
donsutherland1 replied to ORH_wxman's topic in Climate Change
The 8/31 figure on JAXA was 4,242,650 square kilometers. That would rank as the 3rd lowest minimum figure on record. Only 2012 (3,177,455 square kilometers) and 2007 (4,065,739 square kilometers) were lower. The 5-year average decline in sea ice extent from 8/31 would produce a minimum figure of 3,979,208 square kilometers. The minimum decline (2002-15) would result in a figure of 4,092,669 square kilometers. The maximum decline (2002-15) would result in a minimum figure of 3,740,828 square kilometers. -
Arctic Sea Ice Extent, Area, and Volume
donsutherland1 replied to ORH_wxman's topic in Climate Change
That's the way it appears. That's why I still think there's a reasonable prospect that the minimum will be under 4 million square kilometers. -
Arctic Sea Ice Extent, Area, and Volume
donsutherland1 replied to ORH_wxman's topic in Climate Change
Now that August is ending, a closer look at the Arctic sea ice extent figure is in order. The 8/30 figure (JAXA) was 4,302,421 square kilometers. If that were the minimum, it would rank as the 5th lowest on record. However, it is all but certainly not the minimum. A number of scenarios for the minimum figure: Smallest decline from 8/30 to the minimum (2002-15): 4,140,726 square kilometers (would rank 3rd lowest) Largest decline from 8/30 to the minimum (2002-15): 3,793,311 square kilometers (would rank 2nd lowest) Average decline from 8/30 to the minimum (2011-15): 4,007,579 square kilometers All said it appears very likely that 2016 will see the 2nd or 3rd lowest Arctic sea ice extent minimum on record. There remains a reasonable possibility of a minimum figure below 4 million square kilometers for only the 2nd time on record (JAXA). 2012 is currently the only such case. -
 The latest CFSv2 ENSO forecast is indicating that the ENSO Region 1+2 anomaly will be at or above +1.00°C throughout meteorological winter (December-February). It is also indicating this region's anomaly should have peaked, will fall, and then again increase. A secondary peak is actually not uncommon during strong or super El Niño events.The 1972-73, 1982-83, and 1997-98 events all had secondary peaks in this region. The 1997-98 event had a tertiary peak. Since 1950, only three meteorological winters saw 2 or more months have Region 1+2 anomalies of +1.00°C or above: 1972-73, 1982-83, and 1997-98. The latter two featured all three months with such anomalies. Given the modeling, it is very likely that August will have a Region 1+2 anomaly of at least +1.00°C. Since 1950, such anomalies have occurred in 1951, 1957, 1965, 1972, 1976, 1982, 1983, 1987, 1997, 1998, 2008, 2009, and 2014. However, only 3 of those 13 cases met the threshold being signaled on the CFSv2. By October, ENSO Region 1+2 anomalies of +1.5°C or above, filtered out almost all of those cases, leaving only 1972, 1982, 1987, and 1997. Hence, by October, we should have a strong signal as to whether this current CFSv2 forecast has a reasonable chance of verifying. In November, using the same anomaly threshold as October, only 1972, 1982, and 1997 remained. Such anomalies during meteorological winter would have implications for North American temperature anomalies and possibly snowfall along the East Coast. Should the strong PDO+ persist, the PNA+ could also predominate (1982-83 and 1997-98) leading to another warmer than normal winter in the Pacific Northwest. All of that is still far out, but the scenario currently shown on the CFSv2 would typically favor warmth across much of North America. In the more immediate future, one has typically seen El Niño events with Region 1+2 anomalies at or above +1.00°C produce cool anomalies in large parts of the East in August. Summer 2009 was an exception. Warmth has sometimes occurred in the Pacific Northwest and western half of the U.S. In the end, it's still too soon to be sure about the upcoming winter. But if the CFSv2 is right, a cool autumn could yield to a warmer to much warmer than normal December across a wide swath of the U.S. Given where things stand, one should be aware of this possible scenario, but not yet lock it in. Much can still change in Region 1+2. FOLLOW THE LATEST...
 -
 If one takes a look at the overnight 1/16 0z and 6z operational GFS runs, one finds both are very cold in the days 7-15 timeframe. Both also feature a strong EPO-. Both also contain a number of analog dates near moderate or larger snowstorms for some parts of the eastern half of North America. But if one looks more closely, there is actually a rather dramatic change between the 0z and 6z runs. The latter shows the development of meaningful Atlantic blocking to coincide with the strong EPO-. Indeed, if one goes to the 11-day objective analogs from each of these runs, one finds the following: 0z Run: Average AO: +0.125 AO > 0: 60% of analogs AO of -1 or below: 30% of analogs AO of +1 or above: 20% of analogs 6z Run: Average AO: -1.128 AO < 0: 80% of analogs AO of -1 or below: 70% of analogs AO of +1 or above 10% of analogs If one checks out the GFS ensemble forecast for the AO, one also finds that the many members are now favoring a negative AO in the extended range: If this forecast verifies and dual Atlantic and Pacific blocking develop, that would increase prospects for a cold February in the eastern third to half of the CONUS, along with southern Ontario and Quebec. The latter cold anomalies would depend on the magnitude of blocking. If the blocking becomes too strong, then the cold anomalies could be driven southward. Such dual blocking would also allow for potentially more opportunities for larger snowfalls. The Great Lakes region, northern Mid-Atlantic (e.g., Philadelphia) and southern New England areas remain on track for above normal seasonal snowfall, as the December outcomes were consistent with such seasons. The pattern ahead looks promising, particularly for the 1/25-2/15 period. If blocking develops, things could also become more favorable further south in the Mid-Atlantic region, including the Baltimore and Washington, DC areas. The takeaway is that the theme of a growing probability of a cold outcome in parts of the eastern CONUS has been sustained in the overnight guidance. In fact, even as it is still outside its skillful range, the CFSv2 has recently shifted from featuring widespread February warmth to an increasingly colder idea for the eastern third to half of North America.
 -
 Long-Lived Winter of 2012-13 Nearing its End... After a record-setting February-March in terms of snowfall in parts of New England, a February KU blizzard, a near KU snowstorm in early March, and a historic Palm Sunday snowstorm across Missouri and parts of Illinois, the winter season is now coming to a close. In large part, the revival of winter and then its long-duration in parts of North America was the result of a blocking regime that has now lasted 52 days. That exceptional blocking regime brought the AO below -5.000 for the first time on record after mid-March. Moreover, through today, the AO has averaged -3.173 for March and a figure below -3.000 is extremely likely when the month ends in two more days. That will surpass the current March record of -2.858 from 1958. Since 1950, there have been only two years during which the March AO averaged -2.500 (1958 and 1962) or lower and only 5 on which it averaged -2.000 or lower (1957, 1958, 1962, 1970, and 1984). The general consensus of the pattern evolution from those years is that April witnessed a break in the cold pattern, with most of those years favoring warmer readings for the second half of the month in large parts where cool anomalies had begun the month. All said, that pattern evolution supports the idea coming out in the teleconnection analogs of a dramatic pattern change that will likely see the second half of April wind up warmer than normal in much of the area currently enjoying generally colder than normal readings. It appears that the second week of April could witness the start of that transition. Before then, winter may launch a last-ditch bid to carve its legacy into the memories of those who experienced some of its highlights. The possibility for at least some accumulation of snow exists in such cities as Chicago, Cleveland, Toronto, Ottawa, Montreal, Worcester, and perhaps even Boston. A small chance exists for at least some snowflakes in parts of Pennsylvania eastward to New York City, though that's not assured. An increasingly rare April freeze is also a possibility in New York City. The last time there was a freeze in April there occurred in 2007. In sum, Spring 2013 appears likely to begin to take hold in the extended range.
 -
 The AO is forecast to drop to between -4 and -3 around the 3/20-24 timeframe, while the PNA is forecast to go weakly negative. The 500 mb anomalies associated with those teleconnections for the second half of March is shown below: In terms of winter weather threats, there were 6 years that saw such an AO-PNA combination since 1950. 50% saw at least some measurable snow in Boston and New York City in the period running from 5 days before to 5 days after that combination; 33% saw some measurable snow in Philadelphia; and, 17% saw some measurable snow in Washington, DC. There was one KU snowstorm during those years (the March 1958 storm). In short, even as climatology becomes increasingly tilted against snow in the Mid-Atlantic and New England areas, the kind of pattern forecast on the ensembles suggests higher than climatological potential for at least some snowfall. Favored regions would be the northern Mid-Atlantic and New England areas. That's not anything close to a certainty, but at least there's some potential on the table. One can't say that for most years and it is a marked contrast from last March when the "summer in March" episode lay just ahead.
 -
 Some thoughts on the possible 3/5-7/2013 storm... 1. The strong blocking that has been in place since the start of the month has strenghtened further overnight. The AO is now -3.470. The current blocking regime has now lasted 27 consecutive days. 2. The computer guidance is in strong agreement that interior portions of the Mid-Atlantic region will likely pick up a significant snowfall. Baltimore and Washington, DC could also pick up 4" or more. Some of the guidance is more aggressive with snowfall amounts for Washington, DC and Baltimore. The heaviest snows, where one-foot or larger amounts could occur will likely cover western/central Virginia and western Maryland. Such cities as Charlottesville, Sterling, and Frederick could be in the area where some of the heaviest snow falls. The NAM brings a foot of snow to Washington, DC (DCA). Since 1840, there have been four storms that brought 10" or more snow to Washington, DC in March: March 16-17, 1843: 12.0" March 27-28, 1891: 12.0" March 7-8, 1941: 10.7" March 29, 1942: 11.5" 3. There is major disagreement on the computer guidance as to whether appreciable or even significant snows could extend from the northern Mid-Atlantic region into New England. The ECMWF has consistently argued against such an outcome. The GFS has argued for such an outcome in its last three runs in a dramatic switch that is almost reminscent of its taking the lead on what turned out to the be the Boxing Day Blizzard of December 2010. The pattern is sufficiently complex and the pieces sufficiently close that either the ECMWF or GFS could score a dramatic coup or a dramatic bust. Climatology would argue for a more northward extent of the precipitation. Not all of the precipitation would fall as snow, along coastal regions. At the same time, historic experience with storms that dumped 4" or more snow in Washington, DC (DCA) in March with an AO-/PNA+ setup would support the ECMWF. Since 1950, there have been 5 such cases: March 5-7, 1962: DCA: 4.0" (much heavier amounts farther west); NYC: 0.2"; BOS: 0.4" March 30-31, 1964: DCA: 5.8"; NYC: None; BOS: None March 3, 1978: DCA: 4.1"; NYC: 5.0"; BOS: 9.2" March 1-2, 1980: DCA: 4.9"; NYC: None; BOS: None March 9, 1999: DCA: 8.4"; NYC: None; BOS: None In terms of the blockbuster Washington, DC storms cited earlier, only the March 1843 and March 1941 storms brought significant snow to New York City and Boston. Hence, at least at this point in time, I lean toward a scenario somewhat closer to the ECMWF when it comes to the northern Mid-Atlantic and New England, but with not quite as sharp a cutoff and 6" or greater snows extending into metro Washington, DC. The possibility of at least some accumulation of snow in the northern Mid-Atlantic and southern New England areas exists. There remains a smaller chance (probably about 1-in-3) that a 6z GFS-type solution works out.
 -
 Pattern Change Now Evolving as Panic of December '12 Rises... The storm that brought record daily snowfall to Minneapolis-St. Paul commenced a sequence of events that is leading to a pattern change. That sequence of events will likely include several systems (one underway and one or two others in coming days) that will be noted more for wet than white in the East. Afterward, the last 10-14 days (14 days for the Plains States and 10 days for the East Coast) could see generally cooler than normal weather. The rising panic that Winter 2012-13 is becoming a repeat of the non-Winter of 2011-12 has resulted for a large gap between the actual pattern change that is now imminent and expectations. The pattern change was likely to be slow with a fairly lengthy transition before sustained colder weather set in. Given the combination of an EPO+, PNA-, and persistent Arctic warmth, severe cold was not very likely for much or all of December. Expectations were for prolonged and deep cold to set in with the potential for excessive snows. That gap was unsustainable, hence the rising panic. If one steps back to take a look at the non-Winter of 2011-12, one finds: 1. A powerful AO+ regime predominated in December. 2. The long-range guidance and analog cases were unrelenting with their warm idea. 3. The subtropical jet was quiet. To date, one finds: 1. A persistent AO- regime. The AO has now been negative for 22 consecutive days. It is likely to remain predominantly negative for the remainder of the month as per the ensemble guidance and also historic cases. Notable long-lived blocks that developed in the 11/20-12/10 timeframe have typically been long-lived. Put another way, the blockiness that was present in mid-Autumn reasserted itself during the winter. Recent examples include the blocking regimes of 2009-10 and 2010-11. The following severe blocking episodes (minimum AO value of -3.000 or below) began in late November/early December (11/20-12/10) following a blocky October (monthly AO of -025 or below): December 7, 1966-January 11, 1967: 36 days December 7, 1981-January 12, 1982: 37 days November 29, 2009-January 15, 2010: 48 days December 3, 2010-January 15, 2011: 44 days All four of those cases saw the January AO average < 0. KU snowstorms occurred during the winter in 1966-67, 2009-10, and 2010-11. A KU snowstorm occurred during the spring in 1981-82, 2. The long-range guidance has been anything like last winter. In fact, the latest CFSv2 guidance has trended toward widespread cold to begin January and a generally cold month across much of North America. With the PNA having been negative for 41 consecutive days, both historic cases and some ensemble members suggest that it could go positive near or during January. Once that happens, the dam that has kept some of the coldest air bottled up in Alaska and westward could break and a genuine prospect of at least an outbreak of severe cold could develop. Below are the latest CFSv2 weekly (weeks 3 and 4) and monthly (January 2013) forecasts: 3. The SOI has recently gone negative. December 10-12 had values below -40. The 30-day moving average has gone negative and the 90-day moving average is near 0. Often such developments suggest a stronger subtropical jet. Hence, there is a possibility that the closing 10 days of December and perhaps the opening 10 days of January could be stormy. In sum, the gradual pattern change is unfolding. At first, the cold will be a little more impressive than seasonal cold. Storminess could increase as well. The possibility of an outbreak of severe cold could increase after the start of January, as the PNA heads to more neutral values,and especially if it goes positive. All said, even as the first two weeks of December have been sufficiently warm to rekindle nightmares of the non-Winter of 2011-12, there are big differences that argue against a repeat.
 -
 Arctic Oscillation Now Diving... This morning, the Arctic Oscillation (AO) stood at -1.956. Strong to possibly severe blocking that had persistently been modeled appears now to be developing. If some of the ensemble members are right, the AO will likely fall below -3.000 during this blocking episode. Some ensemble members take the AO below -4.000. Severe blocks that commence in late November/early December can be long-lived. Notable long-lived blocks have developed in that timeframe following a blocky October. In other words, the blockiness that was present in mid-Autumn reasserted itself during the winter. Recent examples include the blocking regimes of 2009-10 and 2010-11. The following severe blocking episodes (minimum AO value of -3.000 or below) began in late November/early December (11/20-12/10) following a blocky October (monthly AO of -025 or below): December 7, 1966-January 11, 1967: 36 days December 7, 1981-January 12, 1982: 37 days November 29, 2009-January 15, 2010: 48 days December 3, 2010-January 15, 2011: 44 days In contrast, the severe blocks that developed during the same timeframe, but did not follow a blocky autumn (neutral or positive AO) were often shorter-lived. In cases, they were more an anomaly in a longer-term pattern that featured less blocking. However, some of those patterns eventually became blocky. Winters 1977-78 and 1995-96 were examples. Those blocks were: December 4, 1958-December 27, 1958: 24 days December 6, 1961-December 13, 1961: 8 days December 2, 1977-December 11, 1977: 11 days December 3, 1989-December 21, 1989: 19 days December 5, 1995-January 8, 1996: 35 days December 6, 1996-January 12, 1997: 38 days November 27, 2001-January 1, 2002: 36 days Using all 11 cases, one finds: Mean duration: 30.5 days (standard deviation: 13.1 days) Median duration: 36.0 days Less than 7 days: 0/11 (0%) cases Less than 14 days: 2/11 (18%) cases 20 days or longer: 8/11 (73%) cases 30 days or longer: 7/11 (64%) cases 40 days or longer: 2/11 (18%) cases Given the development of what might be long-lived blocking, the evolution of a colder regime across the eastern third or even eastern half of the U.S., as well as southern Ontario and southern Quebec appears likely down the road. The transition could occur during the second week of December. In its most recent weekly data, the CFSv2 is now showing this transition: In the meantime, beginning Wednesday, a 5-7-day siege of precipitation is poised to inundate the Pacific Northwest. With the extreme precipitation figures modeled and the long-duration involved, this event is likely to be one of the highlight events of late fall 2012-winter 2013.
 -
For June-August 2012: EWR: 25 NYC: 19
-
An amazing record. March 2012's mean temperature of 56.8° demolished the old record of 55.5° set in 1921 and tied in 1945. It was also almost 3.9 standard deviations above the 1981-2010 mean temperature for March. 3.9 standard deviation events have a statistical probability of occurring once every nearly 850 years (for any month).
-
Very well said. I don't believe there is empirical evidence that one approach is qualitatively better than another. There is evidence that GISS's extrapolations produce a reasonable outcome (remarkably small error) when it comes to estimating Arctic temperatures.
-
All estimates have uncertainty/error. I could not find any peer-reviewed papers indicating that UAH is qualitatively superior to GISS when it comes to estimating Arctic temperatures. Also, GISS's extrapolations are reviewed against satellite, infrared, and other data. The extrapolations are very good--perhaps as good as science can get at this time (0.05°C error at a 95% confidence level). The bottom line is that GISS provides a reasonable idea of Arctic temperatures.
-
Perhaps in the future. However, issues also exist with satellite measurements e.g., lower troposphere figures have been documented to be partially tainted by stratospheric readings in the past leading to cooler figures relative to the instrument record than might otherwise have been the case. http://www.ncdc.noaa.gov/oa/climate/research/2005/nature02524-UW-MSU.pdf