

donsutherland1
-
Posts
24,112 -
Joined
Content Type
Profiles
Blogs
Forums
American Weather
Media Demo
Store
Gallery
Everything posted by donsutherland1
-
40.0" snow, including 9.7" in December. February 11-12, 2006 saw 26.9" snow fall at Central Park, which was the Park's biggest snowfall on record until 27.5" fell on January 22-24, 2016. https://www.weather.gov/media/okx/Climate/CentralPark/BiggestSnowstorms.pdf
-
The latest date for the first reading in the 40s is October 20, which was set in 2005.
-
To date, New York City (Central Park) has had no minimum temperatures below 50°. Since 1869, only nine previous years saw the first sub-50° reading after October 10. A number of those winters saw average to above average snowfall. The relevant nine winters are below: 1898-99: 55.9” snowfall 1909-10: 27.2” snowfall 1910-11: 25.2” snowfall 1955-56: 33.5” snowfall 1969-70: 25.6” snowfall 1995-96: 75.6” snowfall 2002-03: 49.3” snowfall 2005-06: 40.0” snowfall 2007-08: 11.9” snowfall At this time, it is premature to reach firm conclusions about the upcoming winter.
-
Arctic Sea Ice Extent, Area, and Volume
donsutherland1 replied to ORH_wxman's topic in Climate Change
It appears that the September 9 figure of 4,472,225 square kilometers (JAXA) could be this year's minimum sea ice extent. That would be the highest figure since 2014 when the minimum extent was 4,884,120 square kilometers. -
Arctic Sea Ice Extent, Area, and Volume
donsutherland1 replied to ORH_wxman's topic in Climate Change
Arctic sea ice extent is mirroring the evolution of the summer 2014 decline very closely. That would imply a minimum figure of between 4.4 million and 4.5 million square kilometers. https://s26.postimg.org/64xg85hrt/Arctic08292017.jpg -
Arctic Sea Ice Extent, Area, and Volume
donsutherland1 replied to ORH_wxman's topic in Climate Change
In March, Arctic sea ice extent averaged 13,679,429 square kilometers. That broke the March record low average of 13,729,002 square kilometers, which had been set in 2015. For the January 1-March 31 period, Arctic sea ice extent averaged 13,294,815 square kilometers in March. That set a new record low average for the first three months of the year. The previous record was 13,430,714 square kilometers, which was set last year. -
Arctic Sea Ice Extent, Area, and Volume
donsutherland1 replied to ORH_wxman's topic in Climate Change
During February, Arctic sea ice extent averaged 13,566,787 square kilometers. That set a new record low average for February. The previous record was 13,595,448 square kilometers, which was set in 2016. These figures all use a 2/1-28 timeline. -
Arctic Sea Ice Extent, Area, and Volume
donsutherland1 replied to ORH_wxman's topic in Climate Change
Lowest January Arctic Sea Ice Extent Averages: 1. 12,664,550 km2, 2017 2. 12,859,672 km2, 2016 3. 12,895,995 km2, 2011 -
Arctic Sea Ice Extent, Area, and Volume
donsutherland1 replied to ORH_wxman's topic in Climate Change
On JAXA, the latest figure was almost 500,000 sq. km. below the previous daily record low extent. -
Arctic Sea Ice Extent, Area, and Volume
donsutherland1 replied to ORH_wxman's topic in Climate Change
Some temporary declines in January have occurred in the past. Statistically, it is almost improbable that we have already reached the peak Arctic sea ice extent figure (>4.5 sigma event). During the 2003-16 period, the earliest peak was February 15 (2015). The latest was March 31 (2003 and 2010). The mean and median dates were March 10. -
Arctic Sea Ice Extent, Area, and Volume
donsutherland1 replied to ORH_wxman's topic in Climate Change
2016 was a remarkable year as far as Arctic sea ice extent was concerned. A summary of data is below: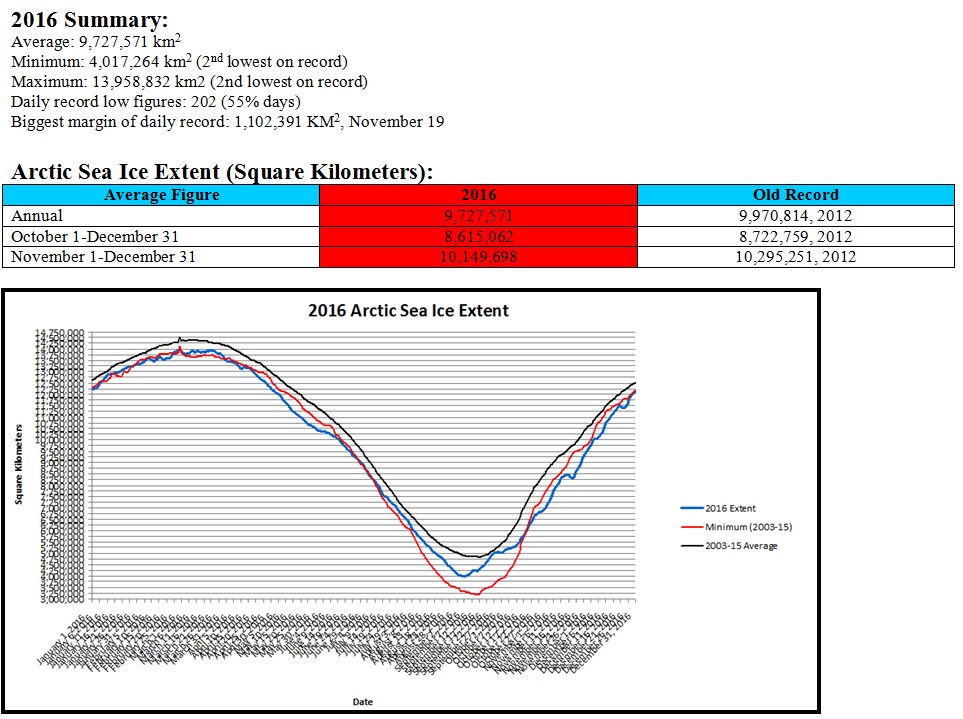
-
Arctic Sea Ice Extent, Area, and Volume
donsutherland1 replied to ORH_wxman's topic in Climate Change
And this is the second such case since November. -
Arctic Sea Ice Extent, Area, and Volume
donsutherland1 replied to ORH_wxman's topic in Climate Change
That's extraordinary warmth. -
Arctic Sea Ice Extent, Area, and Volume
donsutherland1 replied to ORH_wxman's topic in Climate Change
What has been going on in the Arctic is nothing short of historic, at least as far as sea ice extent record keeping is concerned. The October 1-December 9 mean figure for sea ice extent is 7,483,994 square kilometers. The previous record from 2012 was 7,760,443 square kilometers. Moreover, if one took the daily record low minimum figures for the same period of time prior to 2016, the mean figure would be 7,665,564 square kilometers. So far, 2016 has seen daily record low figures established on 180 days. It is now all but certain that 2016 will have established record low figures on at least half the days. -
Arctic Sea Ice Extent, Area, and Volume
donsutherland1 replied to ORH_wxman's topic in Climate Change
Barring a dramatic and significant increase, 2016 is moving closer to having seen daily record minimum extent figures on one out of every two days. -
Arctic Sea Ice Extent, Area, and Volume
donsutherland1 replied to ORH_wxman's topic in Climate Change
The issue is that in the absence of concrete data, it's difficult to draw firm conclusions with any degree of confidence. -
Arctic Sea Ice Extent, Area, and Volume
donsutherland1 replied to ORH_wxman's topic in Climate Change
Thanks. That's what I've read. So, as you noted, there doesn't appear to be anything unusual going on right now. -
Arctic Sea Ice Extent, Area, and Volume
donsutherland1 replied to ORH_wxman's topic in Climate Change
Do you have a source of data that indicates the current coronal holes are largely unprecedented? -
Arctic Sea Ice Extent, Area, and Volume
donsutherland1 replied to ORH_wxman's topic in Climate Change
Coronal holes have been observed since the 1950s (https://www.cfa.harvard.edu/~scranmer/Preprints/eaaa_holes.pdf). If coronal holes were largely responsible for the current low ice conditions in the Arctic and Antarctic regions, one should have seen similar issues across time. That there is a linear decline in Arctic sea ice underway suggests that something other than coronal holes is responsible, given that they've been occurring regularly. -
Arctic Sea Ice Extent, Area, and Volume
donsutherland1 replied to ORH_wxman's topic in Climate Change
Ice extent data from 2003-16 (except for Fall 2016 and Annual 2016): -
Arctic Sea Ice Extent, Area, and Volume
donsutherland1 replied to ORH_wxman's topic in Climate Change
Fantastic comparative information. -
Arctic Sea Ice Extent, Area, and Volume
donsutherland1 replied to ORH_wxman's topic in Climate Change
Arctic sea ice extent fell 18,045 square kilometers on November 19. That brings the 3-day decline to 162,147 square kilometers. The daily figure of 8,302,669 square kilometers is 1,102,391 square kilometers below the previous daily record low figure of 9,405,060 square kilometers, which was set in 2012. -
Arctic Sea Ice Extent, Area, and Volume
donsutherland1 replied to ORH_wxman's topic in Climate Change
There has been amazing warmth in the Arctic region this fall. -
Arctic Sea Ice Extent, Area, and Volume
donsutherland1 replied to ORH_wxman's topic in Climate Change
FWIW, the November 18 Arctic sea ice extent figure would be equivalent to a November 18 high temperature of about 87° in NYC on a standardized basis. The existing record for the date is 73°, which was set in 1921 and tied in 1928. -
Arctic Sea Ice Extent, Area, and Volume
donsutherland1 replied to ORH_wxman's topic in Climate Change
Yes. It was a huge loss.
