
Stormchaserchuck1
-
Posts
5,352 -
Joined
-
Last visited
Content Type
Profiles
Blogs
Forums
American Weather
Media Demo
Store
Gallery
Everything posted by Stormchaserchuck1
-
August historically has a pretty good correlation with ENSO's peak later in the year. It's expected to become the strongest on record by Dec and here's the preceding Augusts: There is some -NAO in the mix but right now it's looking like this usually highly correlated month will not be anything special below-average-wise. PNA has been negative 6 straight months including July, and that is the source of the problem.
-
CPC says above average comes back
-
Something to look out for is how cool October usually is in El Nino PDO has opposite correlation though, and it's strongest month of the year is October so we'll see how the battle of -PDO vs Super Nino goes, going forward.
-
We are mostly getting this cool down because of -NAO, and less to do with the Pacific (El Nino's greatest effect). There is a trough in the GOA for a little while, but it's still not canonical El Nino in the Pacific.
-

2026-2027 Super El Nino
Stormchaserchuck1 replied to Stormchaserchuck1's topic in Weather Forecasting and Discussion
I'm just saying... in the last 3 Winter's it's come within +0.25 of actual DJFM NAO each time. That can range from +2 to -2 so that's pretty good. It's hard to tell exact number this year because what I based it on, NCAR, has been discontinued, but based on TT dailies, it is negative right now. -
2026-2027 Super El Nino
Stormchaserchuck1 replied to Stormchaserchuck1's topic in Weather Forecasting and Discussion
Actually the cold blob AGW based is just south of Greenland, which is a +NAO tendency. I'm pointing out a cold pool south of New Foundland. Here is the correlation composite Here is the trend in global temperature. The cold blob does not overloap my -NAO favored area (above map is default positive so it's opposite for -NAO predictor). If anything the Atlantic cold blob is a Winter +NAO favored tendency, by a lot actually. Furthermore, my May-Sept N. Atlantic SSTA index has not had a net -NAO prediction in a long time. I discovered the method in 2005, and have been practicing it every year since then. It is 15-5 at getting the Winter sign correctly, and within my estimated 0.54SD, it has performed 11-9. So it's not some random thing that I am assume - I have been testing it and it has been working. -
2026-2027 Super El Nino
Stormchaserchuck1 replied to Stormchaserchuck1's topic in Weather Forecasting and Discussion
Oh I thought it was rhetorical lol -
2026-2027 Super El Nino
Stormchaserchuck1 replied to Stormchaserchuck1's topic in Weather Forecasting and Discussion
I wouldn't call it big +NAO. It looks pretty neutral as a Winter average January the coldest month of the year was -NAO 97-98 had potential to be a good Winter imo. The N. pacific trough extending north into +EPO, further north than mean of other El Nino's, tipped that one warm. Remember the EPO is the most sensitive and volatile region for CONUS temps. For north in latitude isn't necessarily as connected to ENSO as Hadley/mid-latitude cell. -
2026-2027 Super El Nino
Stormchaserchuck1 replied to Stormchaserchuck1's topic in Weather Forecasting and Discussion
That's really been a story for a long time now. Since 2012, Summer Arctic Summer SLP anomaly (60-90) has reversed for the following Winter almost every time! Gawx showing cold records consistently happening there this warm season is a strong signal for Winter -AO I believe. -
2026-2027 Super El Nino
Stormchaserchuck1 replied to Stormchaserchuck1's topic in Weather Forecasting and Discussion
Decadal trend lines of NAO are pretty linear with what's happening. We've had pretty much 14 straight +NAO Winter's, at the height of this decadal +NAO phase. Some think it's associated with lagged +AMO. Over the next several decades the "long term cold blob" will likely be somewhere else or reverse. -
2026-2027 Super El Nino
Stormchaserchuck1 replied to Stormchaserchuck1's topic in Weather Forecasting and Discussion
+2.03c on this date is greater than +1.7c in 1997 and 2015 at this time for highest since 1950 (+16%!) -
2026-2027 Super El Nino
Stormchaserchuck1 replied to Stormchaserchuck1's topic in Weather Forecasting and Discussion
2 good signs for the Winter: 1) SSTA south of New Foundland is cold. This is up to 65% correlated to DJFM -NAO 2)-PDO is cooling off a bit -
2026-2027 Super El Nino
Stormchaserchuck1 replied to Stormchaserchuck1's topic in Weather Forecasting and Discussion
IRI model consensus of +3.05c would make it the Strongest El Nino on record since 1950 by +0.25c (NDJ 15-16, +2.8c) [ONI]. Number 2 is +2.4c (ONDJ 97-98), which it would beat by more than 20%! Since 1950, there has never been a La Nina <-2.0c. -
2026-2027 Super El Nino
Stormchaserchuck1 replied to Stormchaserchuck1's topic in Weather Forecasting and Discussion
That's a good point. This is 2 years after a Solar Max: We know that +AO/NAO is favored +1-5 years after Solar Max. Also, 4/5 Super east-based Nino's have happened during +NAO decadal phase (82-83, 97-98, 15-16, 23-24 -vs- 72,73). This year will make 5/6 Super Nino's happening in +NAO decadal unless we see a 09-10 type -NAO season. Check it out.. 13 February's in a row have had +NAO, and most are >+1.00 NAO! 2014 1.34 2015 1.32 2016 1.58 2017 1.00 2018 1.58 2019 0.29 2020 1.26 2021 0.14 2022 1.68 2023 0.92 2024 1.09 2025 1.60 2026 0.68 -
2026-2027 Super El Nino
Stormchaserchuck1 replied to Stormchaserchuck1's topic in Weather Forecasting and Discussion
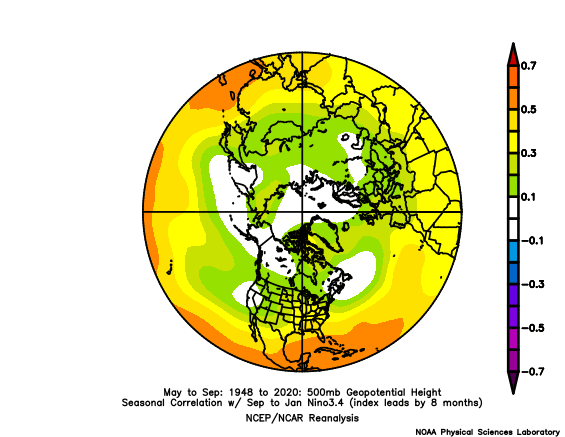
I am so curious to see what pattern we have over the Arctic next Summer after this Super, perhaps record breaking El Nino. The correlation with Nino 1+2 +time is fairly weak Nino 3.4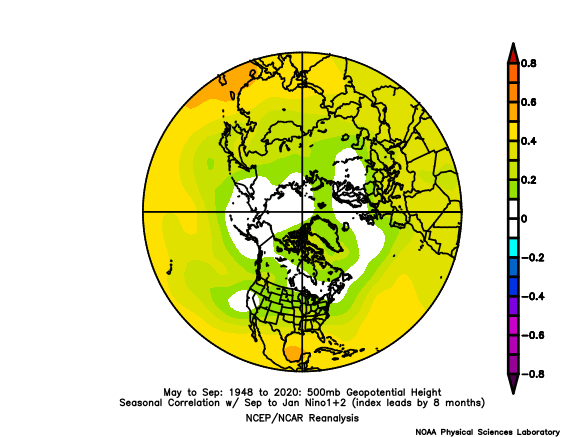
-
2026-2027 Super El Nino
Stormchaserchuck1 replied to Stormchaserchuck1's topic in Weather Forecasting and Discussion
What's the deal man? The stuff that we have access to is pretty basic and it discontinues lol. I actually miss the zoomed in CONUS radar they used to have available, a combination of all the radar sites. Now I can just look at the SPC overview threats radar. -
2026-2027 Super El Nino
Stormchaserchuck1 replied to Stormchaserchuck1's topic in Weather Forecasting and Discussion
Probably >95% chance it's +QBO for the Winter. 15-16 was also a rare 2nd year Nino that went Super so maybe that could possibly have something to do with it? Closest multi-year Nino analog is 86-88 and that QBO was very uniform. -
2026-2027 Super El Nino
Stormchaserchuck1 replied to Stormchaserchuck1's topic in Weather Forecasting and Discussion
This is a great site to monitor the QBO. The Quasi-biennial Oscillation (QBO) El Nino's effects do propagate to the Stratosphere and the Strat winds are opposite +QBO vs El Nino so it is possible there is some correlation No other year on record was nearly as wacky as 15-17 QBO-wise. 48-53 maybe couldn't get out of -QBO and that had a string of La Nina's. -
2026-2027 Super El Nino
Stormchaserchuck1 replied to Stormchaserchuck1's topic in Weather Forecasting and Discussion
Yeah, especially after Winter 15-16 2015 -26.70 -28.62 -28.15 -24.38 -12.34 2.18 7.45 10.96 12.07 13.38 12.79 11.39 2016 9.34 6.77 3.16 0.64 2.37 3.86 6.25 10.07 10.48 12.83 14.16 15.09 2017 14.92 14.78 14.35 13.88 8.01 -
Mark McGuire, Sammy Sosa, and Barry Bonds were crushing homeruns when the league average was .270
-
2026-2027 Super El Nino
Stormchaserchuck1 replied to Stormchaserchuck1's topic in Weather Forecasting and Discussion
2.0 ONI in mid-July is pretty impressive. JJA ONI has never been higher than +1.6c [1997, 2015] since 1950. -
Why did the baseball league batting average drop from .270, 20-30 years ago, to about .245 now?
-
2026-2027 Super El Nino
Stormchaserchuck1 replied to Stormchaserchuck1's topic in Weather Forecasting and Discussion
I think they are re-adjusting some of the daily SOI's. I remember it being higher in recent days. This is quite a streak: 19 Jul 2026 1013.04 1016.50 -27.15 -27.71 -19.78 18 Jul 2026 1013.56 1016.50 -23.95 -27.02 -19.48 17 Jul 2026 1013.50 1016.95 -27.09 -26.34 -19.15 16 Jul 2026 1013.27 1018.25 -36.50 -25.58 -18.73 15 Jul 2026 1012.10 1017.65 -40.01 -24.45 -18.16 14 Jul 2026 1011.36 1016.35 -36.56 -23.53 -17.62 13 Jul 2026 1010.44 1015.10 -34.53 -23.20 -17.20 12 Jul 2026 1009.89 1015.20 -38.53 -23.21 -16.92 11 Jul 2026 1011.77 1015.80 -30.66 -23.06 -16.66 10 Jul 2026 1013.16 1015.45 -19.94 -22.84 -16.52 9 Jul 2026 1011.59 1014.45 -23.45 -22.68 -16.60 8 Jul 2026 1008.90 1015.20 -44.63 -22.32 -16.71 7 Jul 2026 1009.02 1015.35 -44.81 -21.68 -16.58 6 Jul 2026 1011.31 1015.45 -31.33 -21.34 -16.28 5 Jul 2026 1010.44 1015.25 -35.46 -21.21 -16.03 4 Jul 2026 1010.84 1015.20 -32.69 -21.02 -15.72 90-day SOI hasn't been -20 since 1998.. first biggest El Nino event of the 2000s. -
2026-2027 Super El Nino
Stormchaserchuck1 replied to Stormchaserchuck1's topic in Weather Forecasting and Discussion
+2 for Nino 3.4? -
2026-2027 Super El Nino
Stormchaserchuck1 replied to Stormchaserchuck1's topic in Weather Forecasting and Discussion
I think they are arguing for +EPO correlation, scarred from recent Nino's I think. The map above has a negative 500mb right in the NPH region.. that's El Nino! I don't think the EPO is always positive in El Nino, it's further north so more variance. The 1895-1950 anti-La Nina is very -EPO in El Nino. -PDO does favor +epo/+wpo