

TheClimateChanger
-
Posts
4,426 -
Joined
-
Last visited
Content Type
Profiles
Blogs
Forums
American Weather
Media Demo
Store
Gallery
Everything posted by TheClimateChanger
-
Pittsburgh/Western PA Winter 2024-2025 Thread
TheClimateChanger replied to Rd9108's topic in Upstate New York/Pennsylvania
At this point, I'm rooting for futility. If we get 6 inches of snow or less the rest of December, it will be the least snowy 2-year period on record. The 28.2" from 1880 is only for 1 year, as snowfall records did not exist prior to 1880.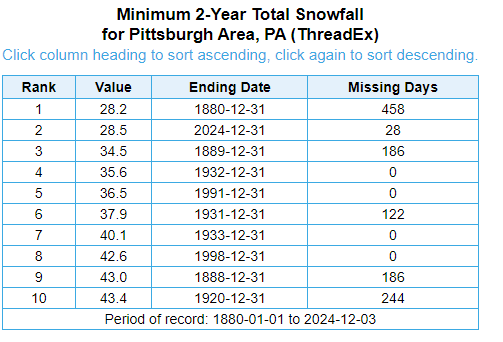
-
November 2024 General Discussion
TheClimateChanger replied to SchaumburgStormer's topic in Lakes/Ohio Valley
They fixed it now. It was a dynamic link, just in case anyone is wondering. -
Looks like a decent snowfall out there in eastern Tennessee this morning. Was just viewing the Ober Gatlinburg webcam. Definitely blowing the snow out, but also plenty of natural flakes flying in the air.
-
So far, so good from Lake Erie. I wonder how this event compares to significant lake effect snows in November 1996 & December 2017.
-
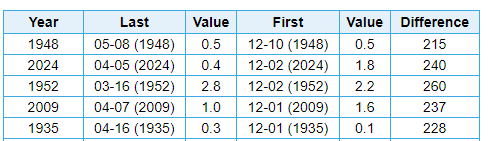
Scattered lake effect snow showers and flurries continue downwind of the Great Lakes. Rochester had its latest first trace of snowfall (December 1) and matched its second latest first accumulating snowfall on record (December 2) on record at that location. The record for latest accumulating snowfall is December 10, 1948. Also, the streak of 240 days without measurable snowfall is the third longest stretch on record behind 1952 (260) and 1931 (254). 1st November of record without at least a trace of snowfall Latest 1st accumulating snowfalls on record
-
Lake Effect snow showers and flurries remain ongoing around the Great Lakes. Yesterday’s snowfall of 1.8” at Rochester matched the second latest first measurable snowfall on record at that location.
-
November 2024 General Discussion
TheClimateChanger replied to SchaumburgStormer's topic in Lakes/Ohio Valley
Something looks off with those Kalamazoo numbers. -
Pittsburgh/Western PA Winter 2024-2025 Thread
TheClimateChanger replied to Rd9108's topic in Upstate New York/Pennsylvania
I was hoping for a little snow on Saturday as well. Recent model runs had the system well north of us though. -
Pittsburgh/Western PA Winter 2024-2025 Thread
TheClimateChanger replied to Rd9108's topic in Upstate New York/Pennsylvania
Looks very likely that 2024 will go into the books as the warmest year on record. December would have to average somewhere in the range of 24-24.5F, or more than 9F below normal, for that not to be the case. The only real question is the margin of victory. A cold December isn’t enough to prevent a record. It would need to be among the coldest of record to not break the record - which would be a massive change from the blowtorch of the first 11 months. -
Central PA Autumn 2024
TheClimateChanger replied to Itstrainingtime's topic in Upstate New York/Pennsylvania
-
Pittsburgh, PA Fall 2024 Thread
TheClimateChanger replied to TheClimateChanger's topic in Upstate New York/Pennsylvania
-
2024-2025 La Nina
TheClimateChanger replied to George001's topic in Weather Forecasting and Discussion
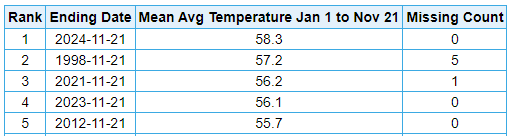
No problem, Don. Also, of note, the 22.6" officially recorded at ERI yesterday was just 2.2" shy of the entire seasonal total from last winter... which, incidentally, was the 4th lowest of record. The graphic below shows it as 6th; however, there is missing data for the winters of 1942-43 & 1943-44. If you cross-check the missing days from the climate reports using NCEI IPS, you'll see the seasonal total was over 48 inches in 1943-1944 and over 40 inches the preceding winter. The missing count for 1918-1919 & 1897-1898 appears just to correspond to months where no snow fell. No snowfall data was reported, which was interpreted as "missing" by the algorithm. And, of course, this ignores changes in snowfall measurement procedure which likely make the earlier data lower than it would otherwise be if the procedures were the same as today.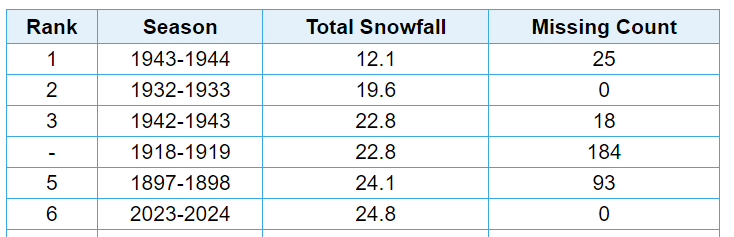
-
Nobody uses BlueSky. Garbage X knockoff app.
-
2024-2025 La Nina
TheClimateChanger replied to George001's topic in Weather Forecasting and Discussion
Highest amount [as of 7 pm yesterday] was 32.1" 2 miles ESE of North East, Pennsylvania, with another report of 30.2" from Girard, Pennsylvania shortly after 6 pm. No doubt well over three feet totals since that time.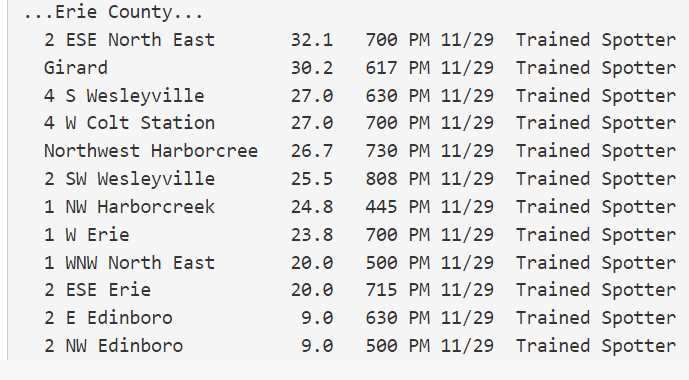
-
November 2024 General Discussion
TheClimateChanger replied to SchaumburgStormer's topic in Lakes/Ohio Valley
22.6" officially yesterday, nearly matching the total snowfall of 24.8" from last winter. In fact, with the snowfall this morning, it's probably already gone over last winter's total. Unofficially, up to 30 inches in some places in northwest Pennsylvania yesterday. -
Central PA Autumn 2024
TheClimateChanger replied to Itstrainingtime's topic in Upstate New York/Pennsylvania
Have you guys encountered this new scam in Pennsylvania? I've seen a lot of discussion on Reddit about it. I know Columbia Gas has been doing it for some time, as has Philadelphia Gas Company. Now People's Gas is doing the same. It's called "weather normalization adjustment" and they tack it onto your gas bill. In theory, it's supposed to provide more standard billing and it's marketed as "revenue neutral." But I went back and looked at my bills back to 2002, and it looks like it's always additive - sometimes quite large. Even in December 2022, when there was a huge cold snap at Christmas, they still tacked on an extra charge. It doesn't even make sense. Supposedly, it'll charge you when less gas is being used due to warm weather. But I went back and compared and some months they said were warmer and I should have used less gas, I used the same or more gas. How am I being assessed a charge because their formula says I used less gas when I actually didn't use less gas? Doesn't make sense. Normally distributed data should have an equal amount above and below. Whatever they are claiming is normal weather is clearly bogus. Looks like a cash grab for the utilities. I see PGW used this scam in May 2022, yes, in May, to charge people huge sums for a month when nobody uses gas anyways. They ended up refunding it that time. Unreal. -
True, although, in this case, with a random public report from the monument, I suspect it was measured the “old-fashioned” way by just sticking a yard stick in the snow after it stopped.
-
Modern snowfall records from the public need an asterisk since they are compared to historic records taken at fixed climate sites, but now can come from literally anywhere - in this case, the highest spot in the state. How much snow fell at 1800’ in the 1938 storm, if 17.5” was observed in a city at 558’ elevation?
-
Pittsburgh, PA Fall 2024 Thread
TheClimateChanger replied to TheClimateChanger's topic in Upstate New York/Pennsylvania
-
Pittsburgh, PA Fall 2024 Thread
TheClimateChanger replied to TheClimateChanger's topic in Upstate New York/Pennsylvania
-
Winter 2024-25 Medium/Long Range Discussion
TheClimateChanger replied to michsnowfreak's topic in Lakes/Ohio Valley
You don't need to tell me math is not your forte. Actually, you were 1055.6% of normal that year. 9.5/0.9 = 10.556. And 1055.6% of your normal of 45 inches is 475 inches, not 53,460 inches. You're only off by a couple of orders of magnitude. That would be 1188 times your normal snowfall or 118,800% of normal. -
Winter 2024-25 Medium/Long Range Discussion
TheClimateChanger replied to michsnowfreak's topic in Lakes/Ohio Valley
"Cold" patterns. Detroit is currently 7.2F above normal for the month. Seasonal snowfall stands at 11 percent of normal, while Flint and Saginaw are at 0 percent of normal. For the year today, it has been the hottest year on record in Detroit history, nearly a half degree warmer than 2012. And, god forbid, if City Airport was still the official observation site, wow!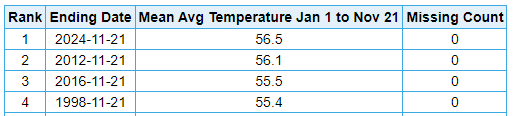
-
Occasional Thoughts on Climate Change
TheClimateChanger replied to donsutherland1's topic in Climate Change
Wow, quite fascinating. A new oscillation being driven by sea ice loss. Do they have any idea what impacts this new oscillation will have on regional and/or global climate? -
Pittsburgh, PA Fall 2024 Thread
TheClimateChanger replied to TheClimateChanger's topic in Upstate New York/Pennsylvania
Possibly two tornados with radar confirmation (CC) on ground. -
Pittsburgh, PA Fall 2024 Thread
TheClimateChanger replied to TheClimateChanger's topic in Upstate New York/Pennsylvania


