

Cobalt
-
Posts
5,216 -
Joined
-
Last visited
Content Type
Profiles
Blogs
Forums
American Weather
Media Demo
Store
Gallery
Everything posted by Cobalt
-

2026-2027 Super El Nino
Cobalt replied to Stormchaserchuck1's topic in Weather Forecasting and Discussion
An incredibly bold prediction to make in this day and age. A warm climate lends itself to warmer than normal temperatures? Tell us more. -
2026-2027 Super El Nino
Cobalt replied to Stormchaserchuck1's topic in Weather Forecasting and Discussion
You’re really bold predicting that a Super El Niño in 2026 will be warmer than normal. I’m almost in shock, it takes a lot of guts to forecast something like that. -
super el nino banter thread
Cobalt replied to forkyfork's topic in Weather Forecasting and Discussion
I think it would be best to just have links to there limited in some form. Sometimes they can provide value within other context on this board. Other times I think I'm just on Paul Roundy or Ben Noll's twitter pages on here lol -
super el nino banter thread
Cobalt replied to forkyfork's topic in Weather Forecasting and Discussion
amwx has a strict limit of 5 twitter links per person per day, obviously -
super el nino banter thread
Cobalt replied to forkyfork's topic in Weather Forecasting and Discussion
note the gaps in date
-
super el nino banter thread
Cobalt replied to forkyfork's topic in Weather Forecasting and Discussion
Note the date
-
super el nino banter thread
Cobalt replied to forkyfork's topic in Weather Forecasting and Discussion
pepperidge farm remembers -
2026-2027 Super El Nino
Cobalt replied to Stormchaserchuck1's topic in Weather Forecasting and Discussion

-
2026-2027 Super El Nino
Cobalt replied to Stormchaserchuck1's topic in Weather Forecasting and Discussion
it's okay, we're all wrong sometimes -
Chester County PA - Analytical Battle of Actual vs. Altered Climate Data
Cobalt replied to ChescoWx's topic in Climate Change
Do we have equal right to open up a thread for each of the other 3142 counties in the US? -
This is simply not true. ChatGPT is a far worse science communicator than many out there. Its writing habits are also quite predictable, to a point where a still-substantial portion of the general public can sense that the vibes are “off” and stop interfacing with the posts entirely. My suggestion would be to narrow the scope of your content and try writing headlines more gripping and information-rich than what ChatGPT can do. It is very much possible, and the reward is that, with enough effort, your unique posts have potential to reach further than 4x the amount of derivative AI posts would be capable of. I guarantee it.
-
You are very committed to discussing all facets of climate change, and I admire your effort. However, would you possibly be up for moving away from AI usage in your posts? I can't help but see all the hallmarks of it throughout your Twitter page. A lot of it undermines your overall message, and I'm not talking from the energy consumption standpoint, but instead just the overall strength of the rhetoric you and consequently ChatGPT use.
-
but it is the only 46 years of data we have for this beautiful region of The Great Lakes....so we analyze!!!
-
It doesn't matter if it's 134 years of climate data from Gibson County, Indiana. It is just one of the 3143 counties in the United States that you are trying to use as the lens from which to view global climate change from. You don't get the right to say that I'm cherrypicking when that is the flimsy pedestal you're standing on.
-
Do you really want to talk about small sample sizes? Your entire existence on this global climate change board is substantiated by a thread where you talk solely about your county’s climate data. Like, are we being for real?
-
lol okay so a 12 month sample makes you question "why such a small sample size?" But a 52 day sample size is clearly good enough for you to post Explain this to me. Why is a 52 day data set better than a 12 month one?
-
lol your talking points ran in a circle and immediately go back to my entire point of that whole post.
-
Lol remember this. I wonder what's happened with the national temperatures since this poi- Oh, the warmest such 12 months on record for the CONUS. So the 58th coldest Jan-Feb on record (what Chesco so happily posted last year with his above chart) got pretty gleeful coverage from him, but the warmest 12 month stretch for the US gets nothing. I wonder why?
.thumb.png.11c9baad0b28815e93fa34627ab2e4c9.png)
-
Lol the tried and tested method of taking non-scientist rhetoric and making it seem like the consensus. Oh well, that line of thinking will die out with your generation. For now, we live in a world where that kind of distortion doesn't change reality.
.thumb.png.0fc4c2f1bbfbaf387c9db10cd074fd00.png)
-
2026-2027 Super El Nino
Cobalt replied to Stormchaserchuck1's topic in Weather Forecasting and Discussion
Not the chart (which you already reposted with a Tweet 2 posts before this one btw), but the entire content of the tweet leading up to it Every line containing the hallmarks of AI, completely synthetic fluff packaged into a tweet format. I sincerely hope you don't follow this guy and just found them by searching up keywords like "Super El Nino", but I also wouldn't put it past you.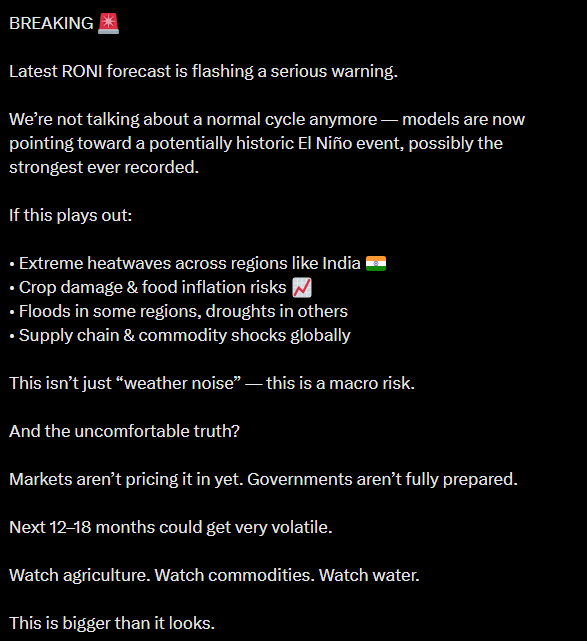
-
2026-2027 Super El Nino
Cobalt replied to Stormchaserchuck1's topic in Weather Forecasting and Discussion
That second post is entirely generated by AI. Cool to know that you’re fine with posting slop so long as it hits all of the Paul Roundy super El Niño talking points. -
Chester County PA - Analytical Battle of Actual vs. Altered Climate Data
Cobalt replied to ChescoWx's topic in Climate Change
You have to be playing a persona, right? Because you can't just go on to say this and then go on to IMMEDIATELY post this it is beyond parody. -
Chester County PA - Analytical Battle of Actual vs. Altered Climate Data
Cobalt replied to ChescoWx's topic in Climate Change
Unironically posting a graph like that should get you banned from any scientific community ever. The absolute failure of even Stats 101-level thinking is abhorrent to a degree where it feels like Chesco is playing a persona. -
Must’ve been 1992, the year after Pinatubo? My Oceanography professor recalled frost on his car in Harrisonburg in June of that year.
-
There's a whole laundry list of "winter's over" posts from December-January by all of the usual suspects. We know they'll make similar calls this next winter or the next and will be spot on, but it's not exactly bold to be in the warm & snowless camp when that feels like an increasing majority of our winters. It's like going all in on bonds and saying I told you so when they return 4% after a year lol


.png.593f9b0c6b9d598ccc5fb00843b9dd92.png)
.png.29cd8718a41de268b6cbe6113dbe5738.png)