Cobalt
-
Posts
5,216 -
Joined
-
Last visited
Content Type
Profiles
Blogs
Forums
American Weather
Media Demo
Store
Gallery
Everything posted by Cobalt
-
Definitely feel like we're in the same camp out here, too warm for the initial batch of precip and too far West for the lp jump off the coast. It's okay, we'll cash in with a March 2013 redux in a few short weeks.
-
 Damn so in following that logic, it's okay to drive while drunk because my blood is only composed of 0.09% alcohol?
 -
Gigantic + anomalies over Western North America/Greenland all for a paltry cool anomaly the size of Texas right over us. Woof.
-
what an odd thing to say.
-
Snowman weenied this message and hates the idea of this event so much that he had to also click into the thread itself to send a weenie there. You know, to show how much he hates that thread and how he wants nothing to do with it.
-
This figure is obviously going to moderate quite a bit during the next week, but up to this point DCA has seen its coldest winter since 1996, and BWI its coldest since 1984.
-
That's the $150,000 question.
-
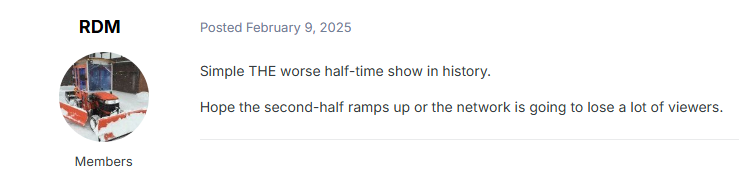
So kind of them to play a football game at the Bad Bunny concert
-
Even worse than last year's? lmao get a grip
-
Lets be honest with each other- its probably right. The details might not be right- but we need to remember our climo as a snow town. The Mid Atlantic in winter is like watching a magnificent fish glide through water. Heck we even managed a snow and sleet storm at 16 degrees when the northern and southern streams phased over Kansas. I-95 is the opposite of cooked. Mountains have even more of a chance. I know you might weenie and tell me to go go to the Snow Bros Anonymous meeting. But am I wrong? Don't say I didn't warn you. This is the benefit of being in the MA, when its super cold it's congrats Bob Chill. When its marginal, it's congrats Georgetown. Any other circumstance and I've just got to take my 151k Denny's salary and rent a cabin out in West Virginia.
-
Canadian is remarkably similar to its 12z run.
-
Crazy what a week of prolonged cold can do to some averages. Through yesterday, DCA sits at 35.3F for the winter, good enough for 13th coldest first 2/3rds of winter since 1970 and 2.7F below the 1981-2010 average, the coldest such period since 2010-2011 (34.1F)
-
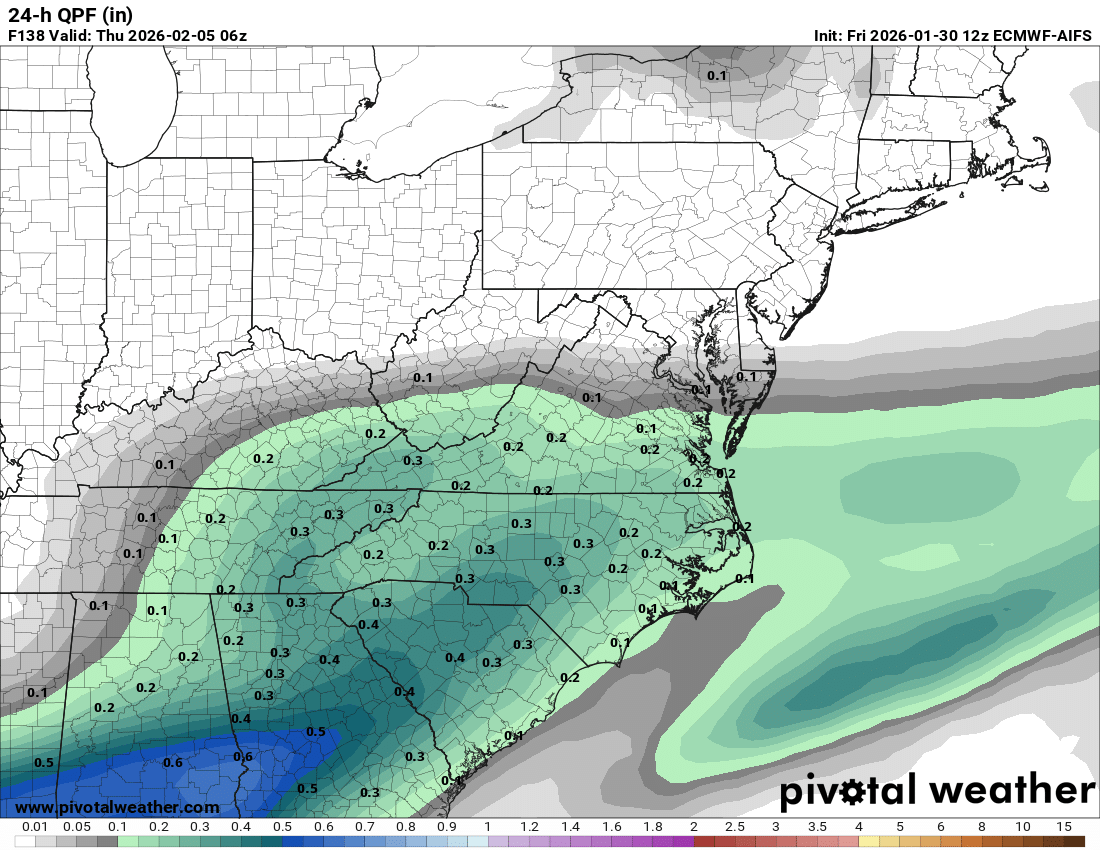
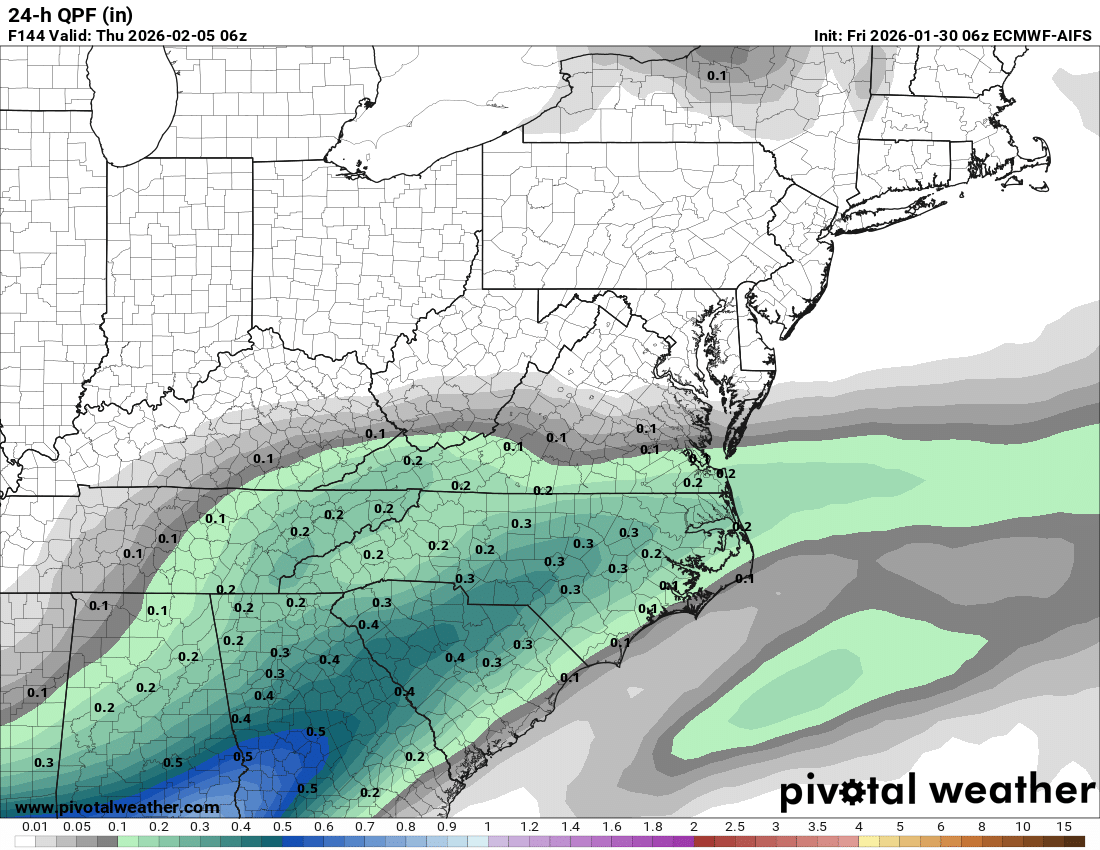
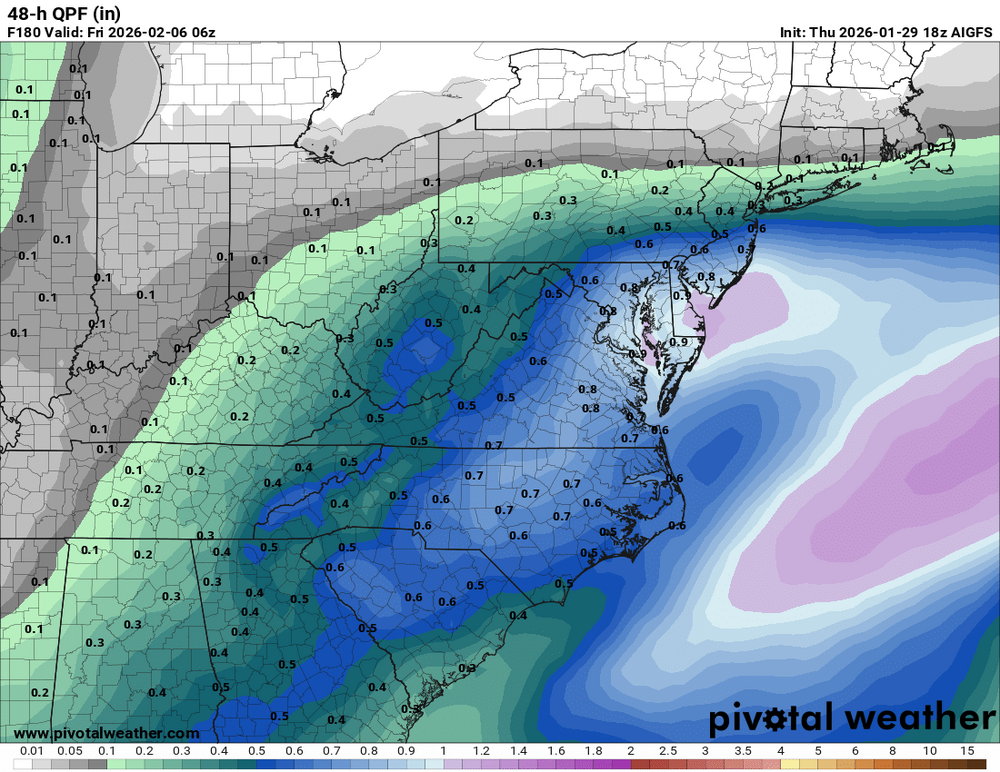
AI Euro looks better than 18z
-
We forget how difficult it is to get large snowfalls in the metros during La Ninas. Another 5"+ snowfall at DCA would make this winter join 2024-25 as the only Ninas to feature two such snowfalls since 1995-96. The airport has had only 7 snowfalls exceed that mark in 21st century La Ninas, and the largest was 9.3", a mark we've exceeded 5 times in El Ninos during that span!
-
To date, DCA's winter has been colder (35.9F) and snowier (8.5") than last winter, as well as the winters of 2013-14, 2014-15, and the analog of 2005-06. Missing to the South is a gut punch, but it's sort of surprising we haven't had more misses like that so far. The winters of 2017-18 and 2021-22 were loaded with such storms, as well as atrocious short range model implosions. If you want true misery, 2000-01 and 2008-09 were both colder to this point and had a combined snow total of 6.3 inches to show for it.
-
a bit IMBY-centric but it did juice up compared to 6z. 50 miles North or so? vs 6z Doesn't end up meaning much for DC-North but it did go further South which at least opens up future possibilities. Very early in the game.

-
Looks better than 6z at least?
-
Modest lp close by with temps in the 20s. If only this could be locked in
-
The Jan 31 Potential: Stormtracker Failure or 'Tracker Trouncing
Cobalt replied to stormtracker's topic in Mid Atlantic
Before Euro shatters our dreams.. DT 1st call map. Was made before 0z suite (which makes me assume he wasn't weighing the GFS then because it had its worst run at 18z)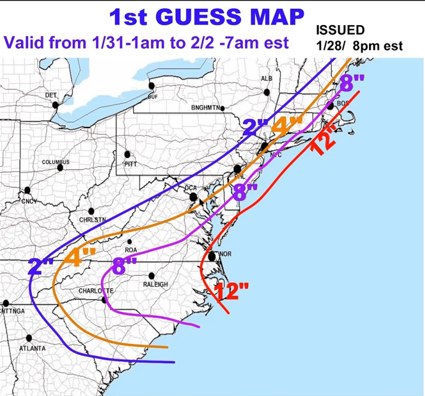
-
The Jan 31 Potential: Stormtracker Failure or 'Tracker Trouncing
Cobalt replied to stormtracker's topic in Mid Atlantic
The goblin freak show (GFS) is running -
The Jan 31 Potential: Stormtracker Failure or 'Tracker Trouncing
Cobalt replied to stormtracker's topic in Mid Atlantic
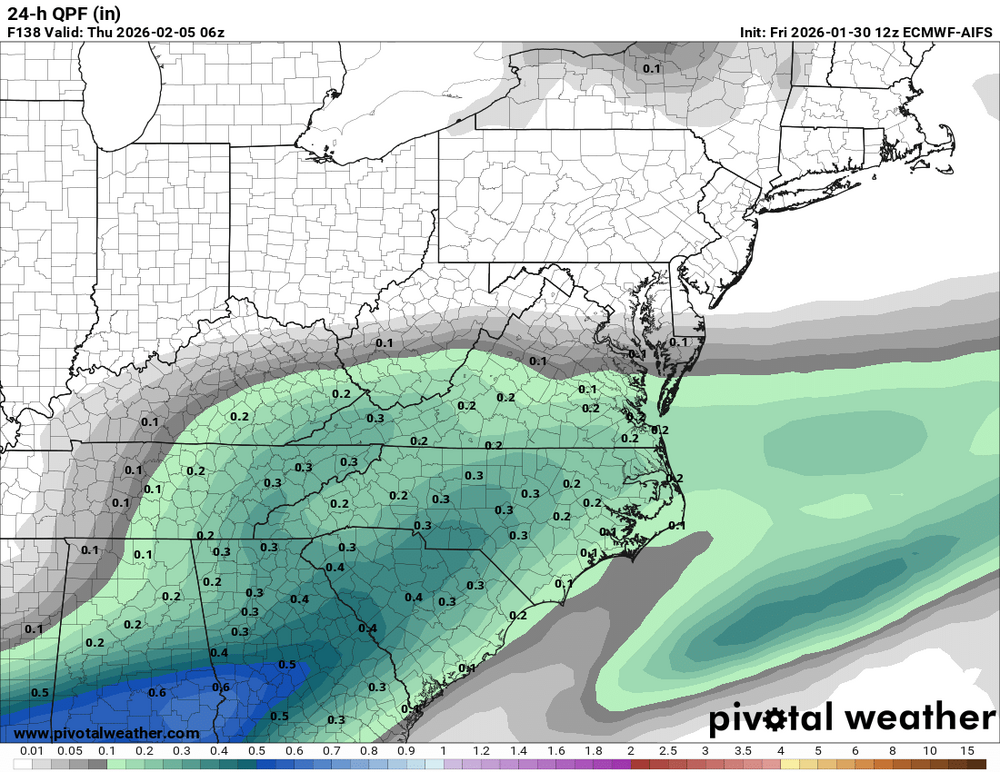
The cold push on the Euro is quite incredible, -17F in central PA while precip is developing in North Carolina. -
The Jan 31 Potential: Stormtracker Failure or 'Tracker Trouncing
Cobalt replied to stormtracker's topic in Mid Atlantic
Putting the Next in WeatherNext -
The Jan 31 Potential: Stormtracker Failure or 'Tracker Trouncing
Cobalt replied to stormtracker's topic in Mid Atlantic
Clearly our misfortune since 0z is due to the promised posting of the WeatherNext never coming to fruition. Thank you, this will reverse the course. -
The Jan 31 Potential: Stormtracker Failure or 'Tracker Trouncing
Cobalt replied to stormtracker's topic in Mid Atlantic
AI GFS looks a tick Northwest? At least at h500 and with that initial slug of precip. -
The Jan 31 Potential: Stormtracker Failure or 'Tracker Trouncing
Cobalt replied to stormtracker's topic in Mid Atlantic
Better trough orientation than 12z but considering that 12z was uber OTS that ain't gonna cut it