Chinook
-
Posts
10,933 -
Joined
-
Last visited
Content Type
Profiles
Blogs
Forums
American Weather
Media Demo
Store
Gallery
Everything posted by Chinook
-
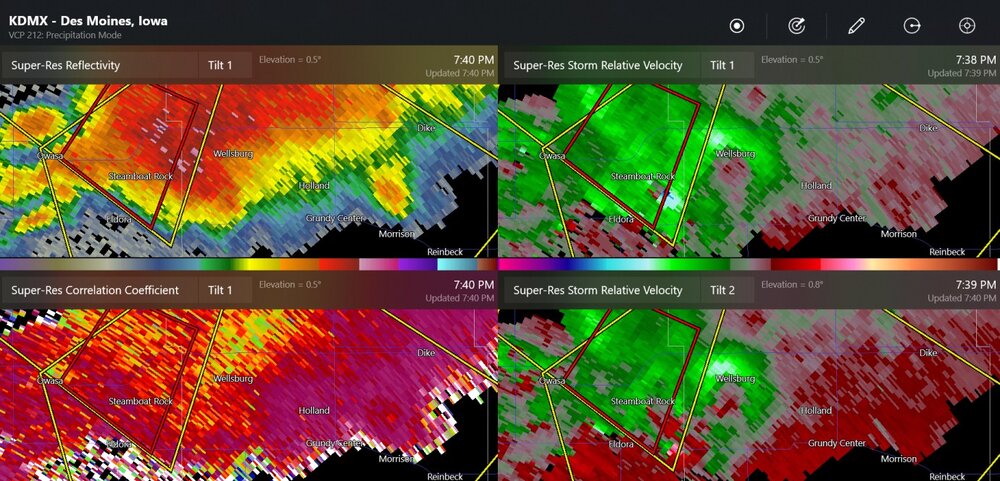
93mph at Marshalltown
-
How many rotations are tucked into this thing anyway? Near Iowa Falls
-
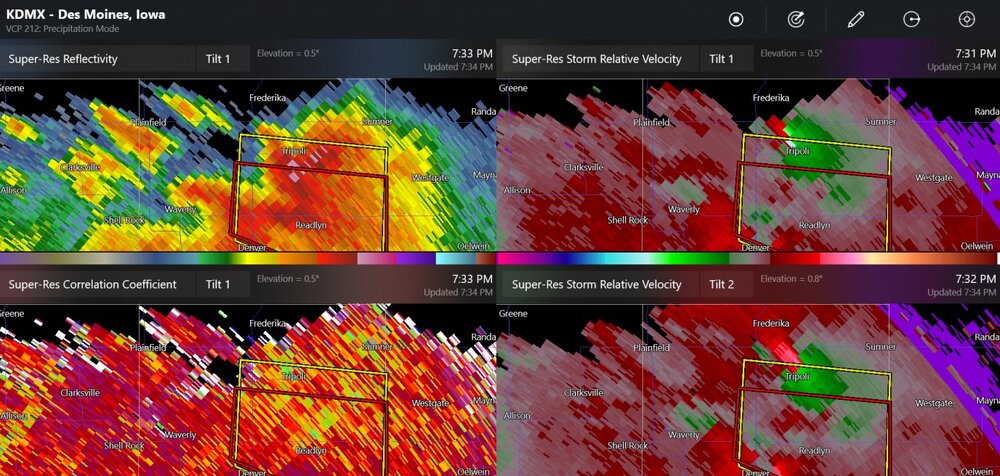
possible tornado north of the tornado warning
-
I spotted a storm

-
-
2023 Short/Medium Range Severe Weather Discussion
Chinook replied to Chicago Storm's topic in Lakes/Ohio Valley
for those who like insane CAPE.gif.771f6bf674127f85ae7d6bf1eb9f91cb.gif)
-
2023 Short/Medium Range Severe Weather Discussion
Chinook replied to Chicago Storm's topic in Lakes/Ohio Valley
I keep forgetting the 00z GFS just doesn't exist at 10:30PM eastern daylight. Oh well, the 3km NAM and HRRR have quite a bit of development in Wisconsin tomorrow. -
2023 Short/Medium Range Severe Weather Discussion
Chinook replied to Chicago Storm's topic in Lakes/Ohio Valley
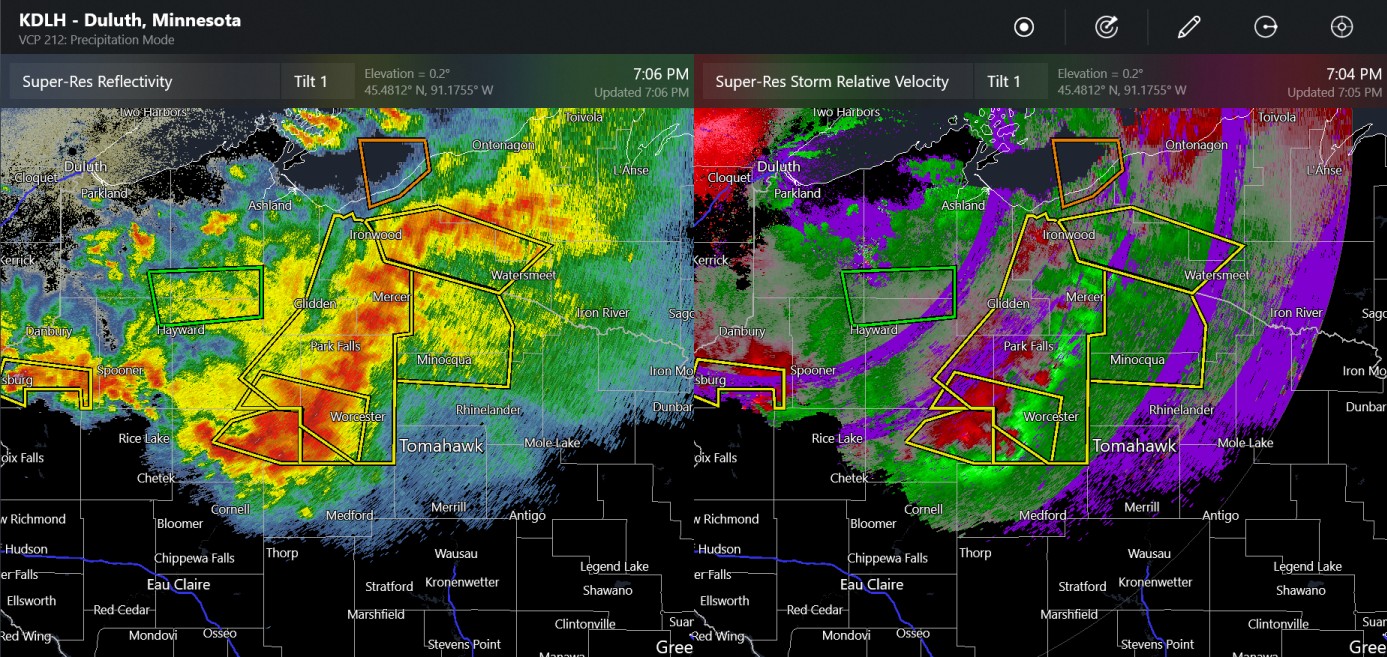
heavy squall line in Wisconsin, a few brief tornado warnings in the middle of the squall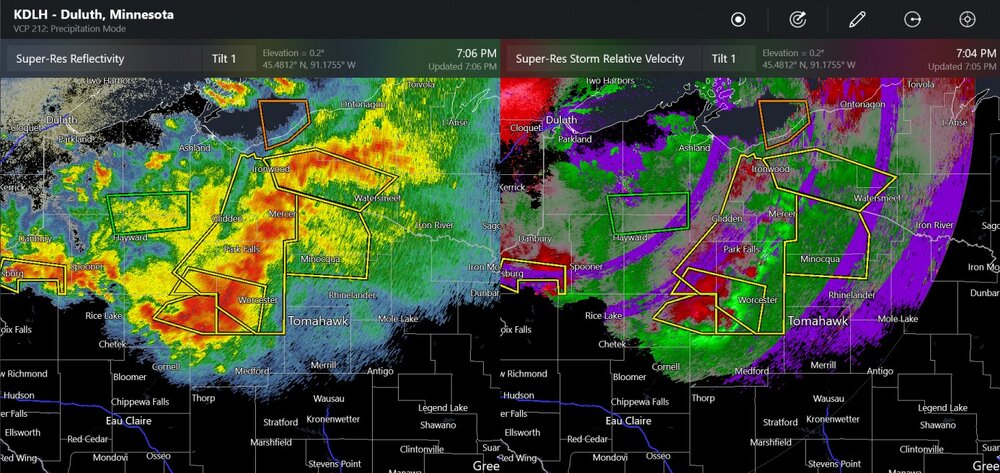
-
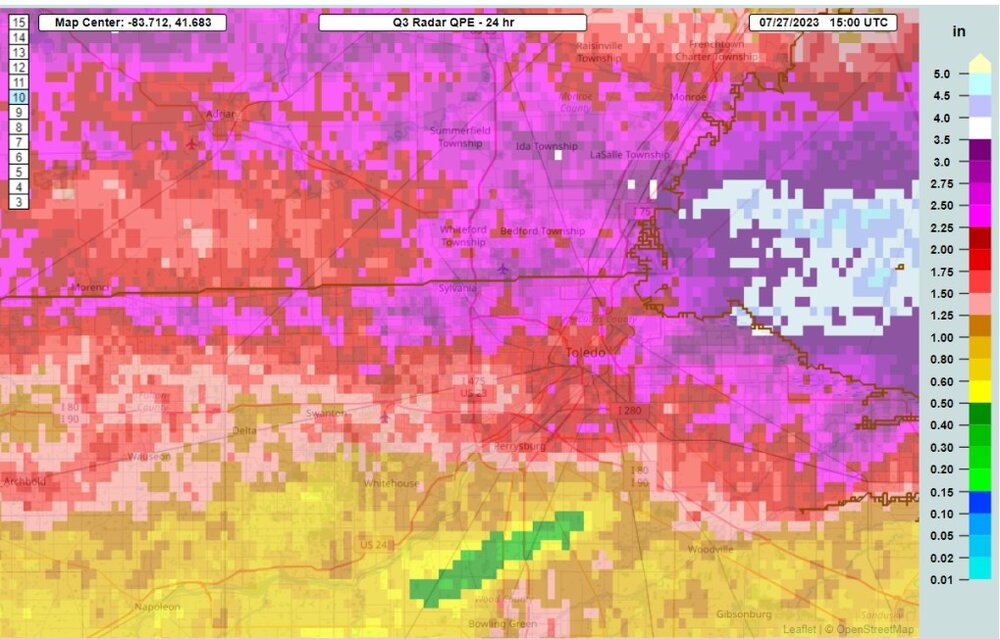
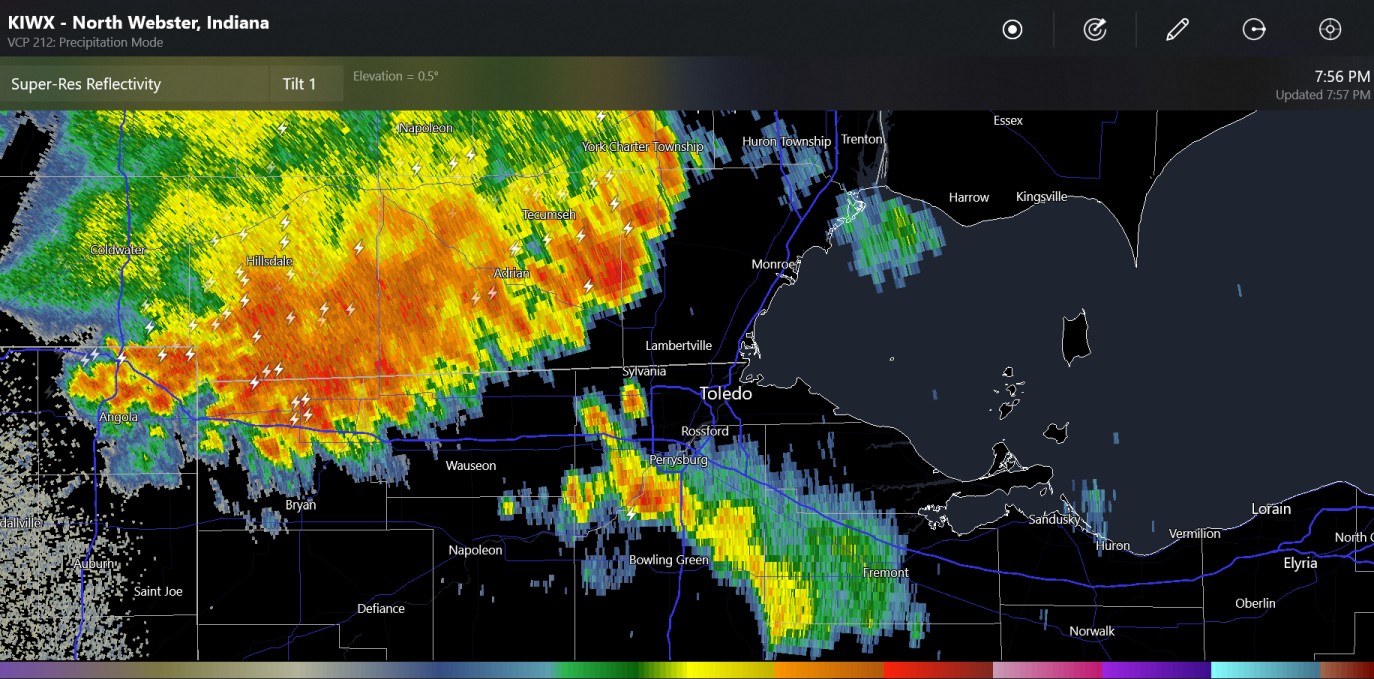
Toledo area had 0.5 to 3.58", definitely some trees down with perhaps multiple rounds of storms, and there was briefly a flash flood warning. Toledo city got out of the drought by getting enough rain for June and July this month
-
The thunder and rain keep going here. It's so much what I was thinking would happen in June. It's going to be well over 1" by the time it ends in the morning hours.
-
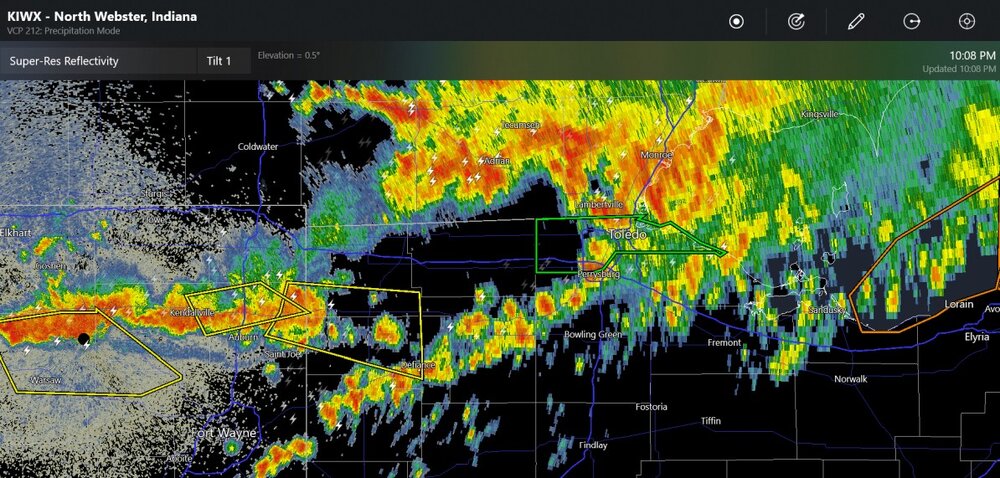
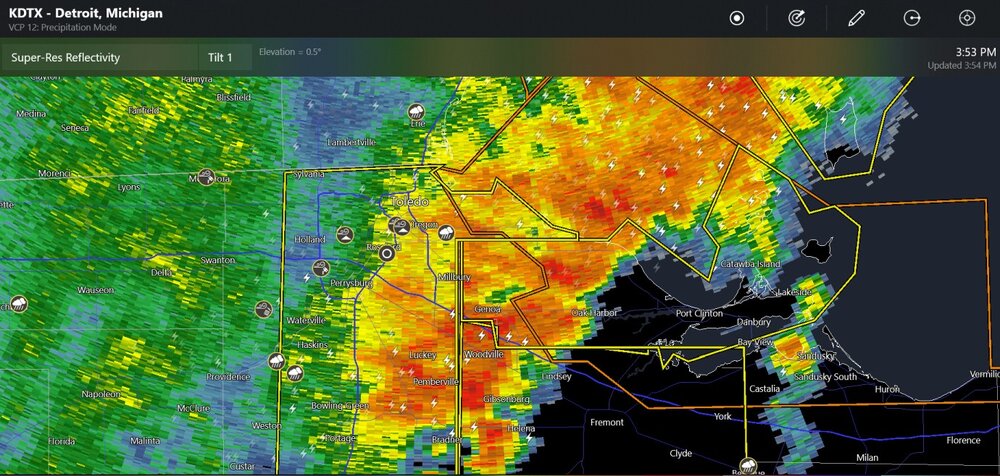
some radar grabs

-
ooh, that might track over to me for some nighttime lightning BTW, HRRR sounding has up to 7400 J/kg of CAPE in Nebraska right now
-
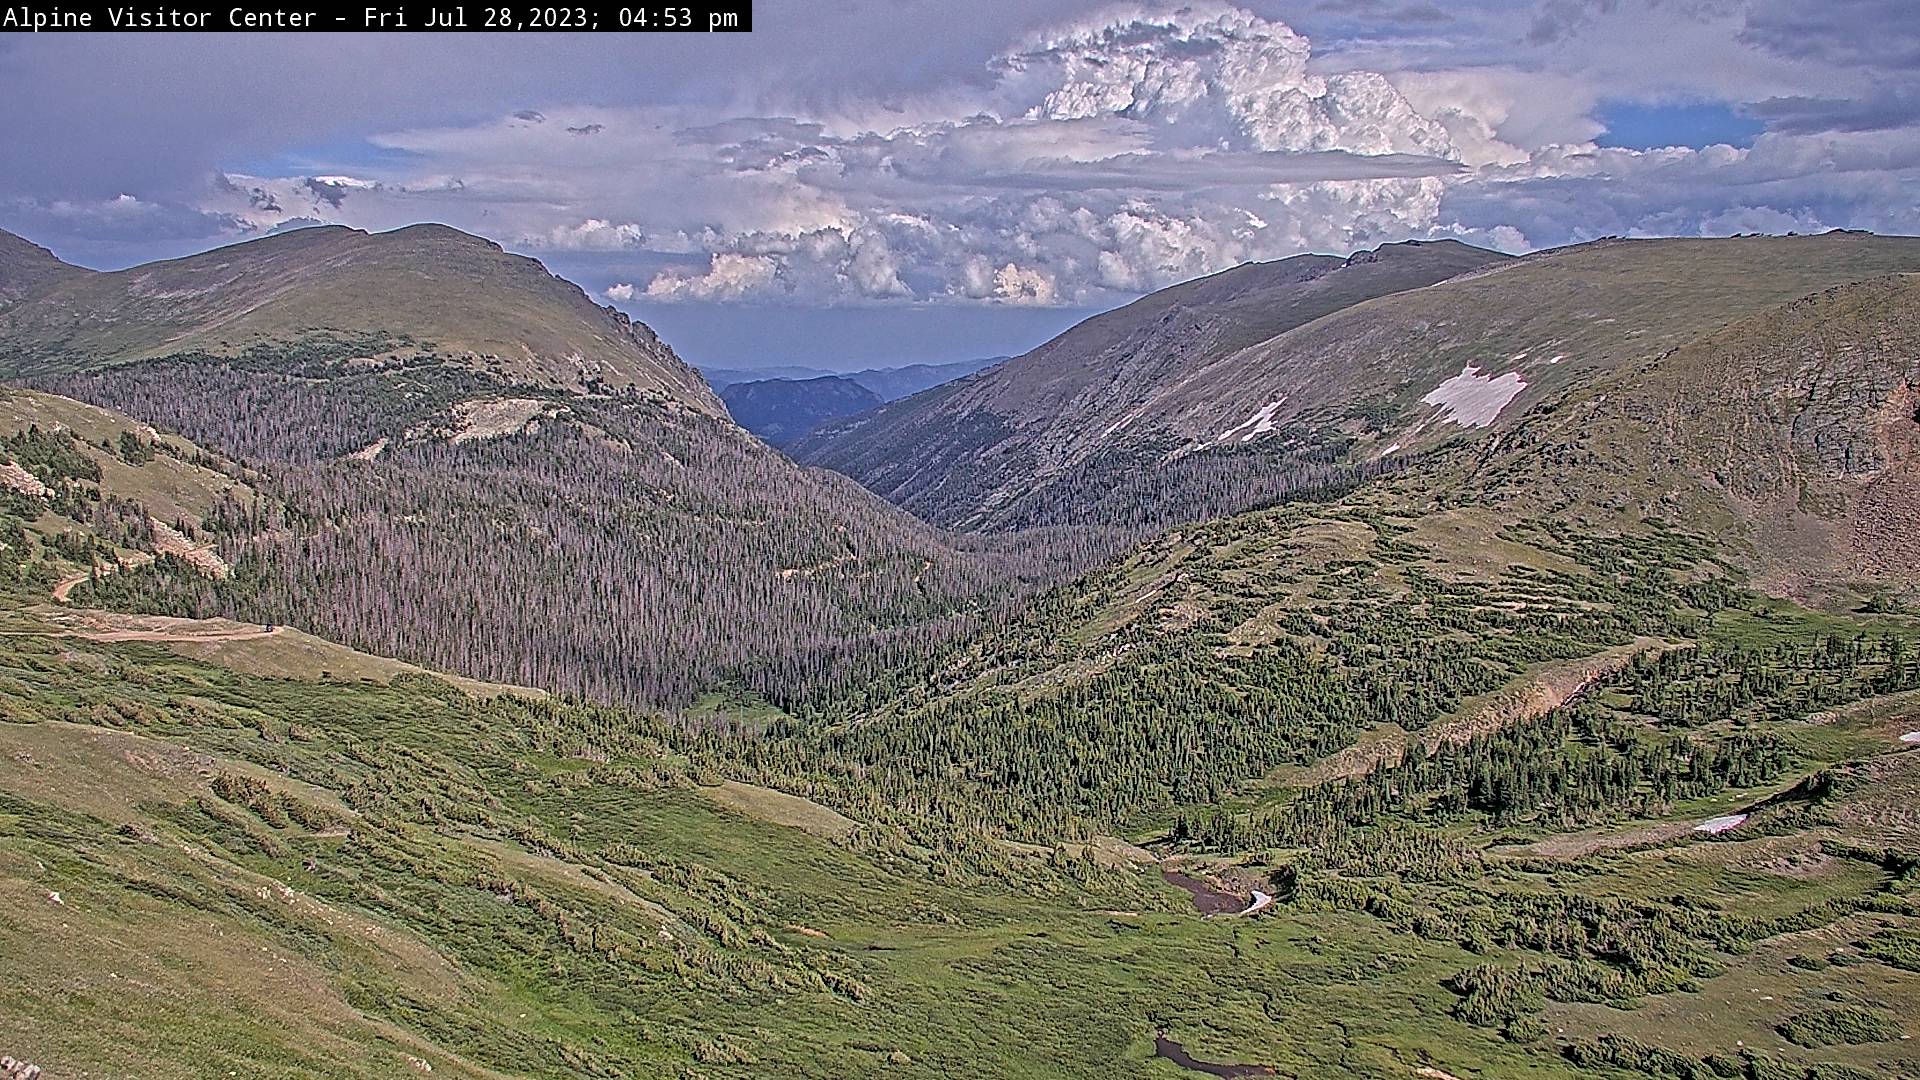
I saw a red sun tonight due to the forest fire smoke. There were just a few clouds in the way, about 20-30 min before sunset. A few clouds that looked pretty nice and pink. First quarter moon. Pretty hot for nighttime, but I guess it could be worse.
-
by the way, temp: 108 dew point: 60 with some wind at Manhattan Kansas right now
-
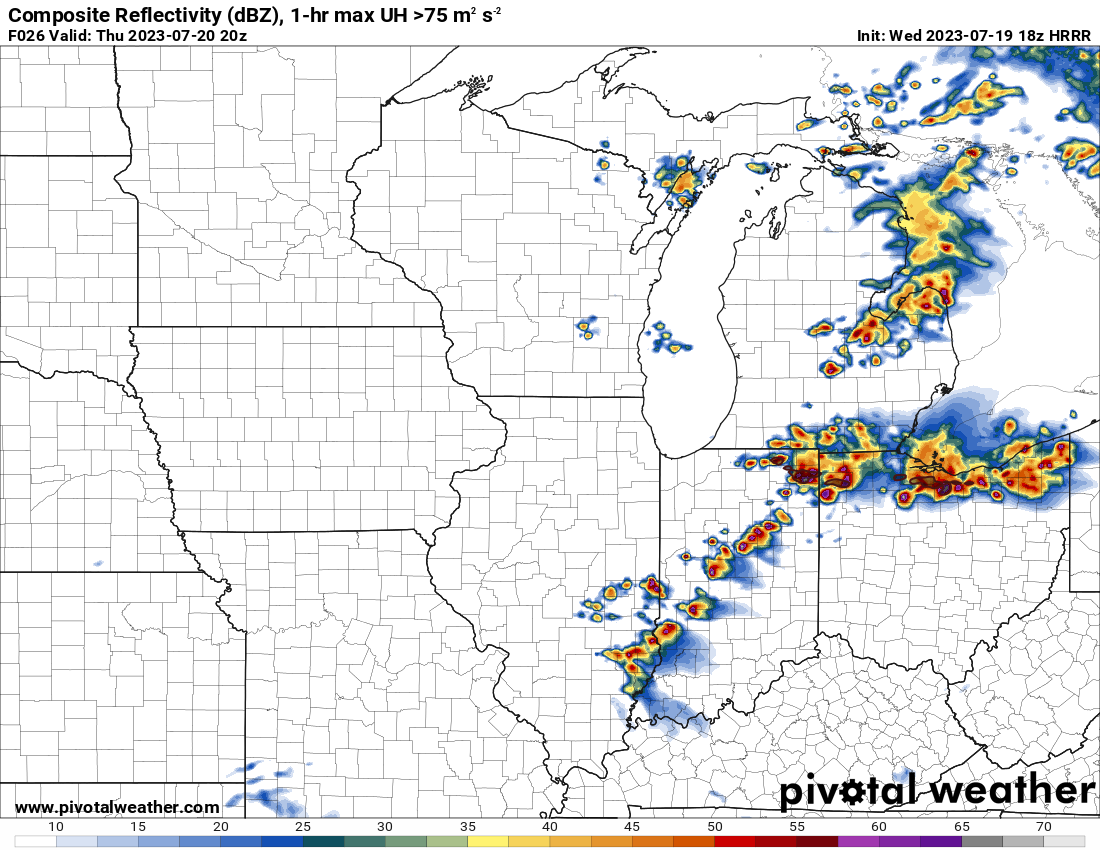
The 18z HRRR shows the overnight MCS system in Wisconsin that quickly advances to being a bow echo in mid-Michigan. Basically it says the rain misses OH/IN. It says the big stuff goes from the west side of Saginaw County to about the east side of Tuscola County in just 1 hour.
-
The AQI is now 100-150 and also the 150-200 in Mich/Indiana/Chicago
-
I think there's kind of a consensus that looks like the last severe squall line on 7/20, such that several storms develop in Michigan and then go east into Ontario, and more south from there. The WRF-NSSL has a lot more development, breaking the cap, I suppose, into Ohio and Indiana. That's the thing. The 12km NAM predicts a capping inversion of 1 degree C in Indiana, which could be a reason that not a lot gets going. But that's the reason that SPC highlights a blob-shaped area every single day. Because convective development is not that easy to figure out.
-
Hi-res reflectivity from 2004? crazy. The enhanced outlook was a little bit of a surprise for me, but I did see the higher winds at 850-500mb in yesterdays models. and now, the convection-allowing models show much more on the thunderstorm coverage. I suppose you could say the NADOcast is just taking into account the higher low level 850mb winds and wind shear values, which is something that increases tornado potential.
-
2023 Short/Medium Range Severe Weather Discussion
Chinook replied to Chicago Storm's topic in Lakes/Ohio Valley
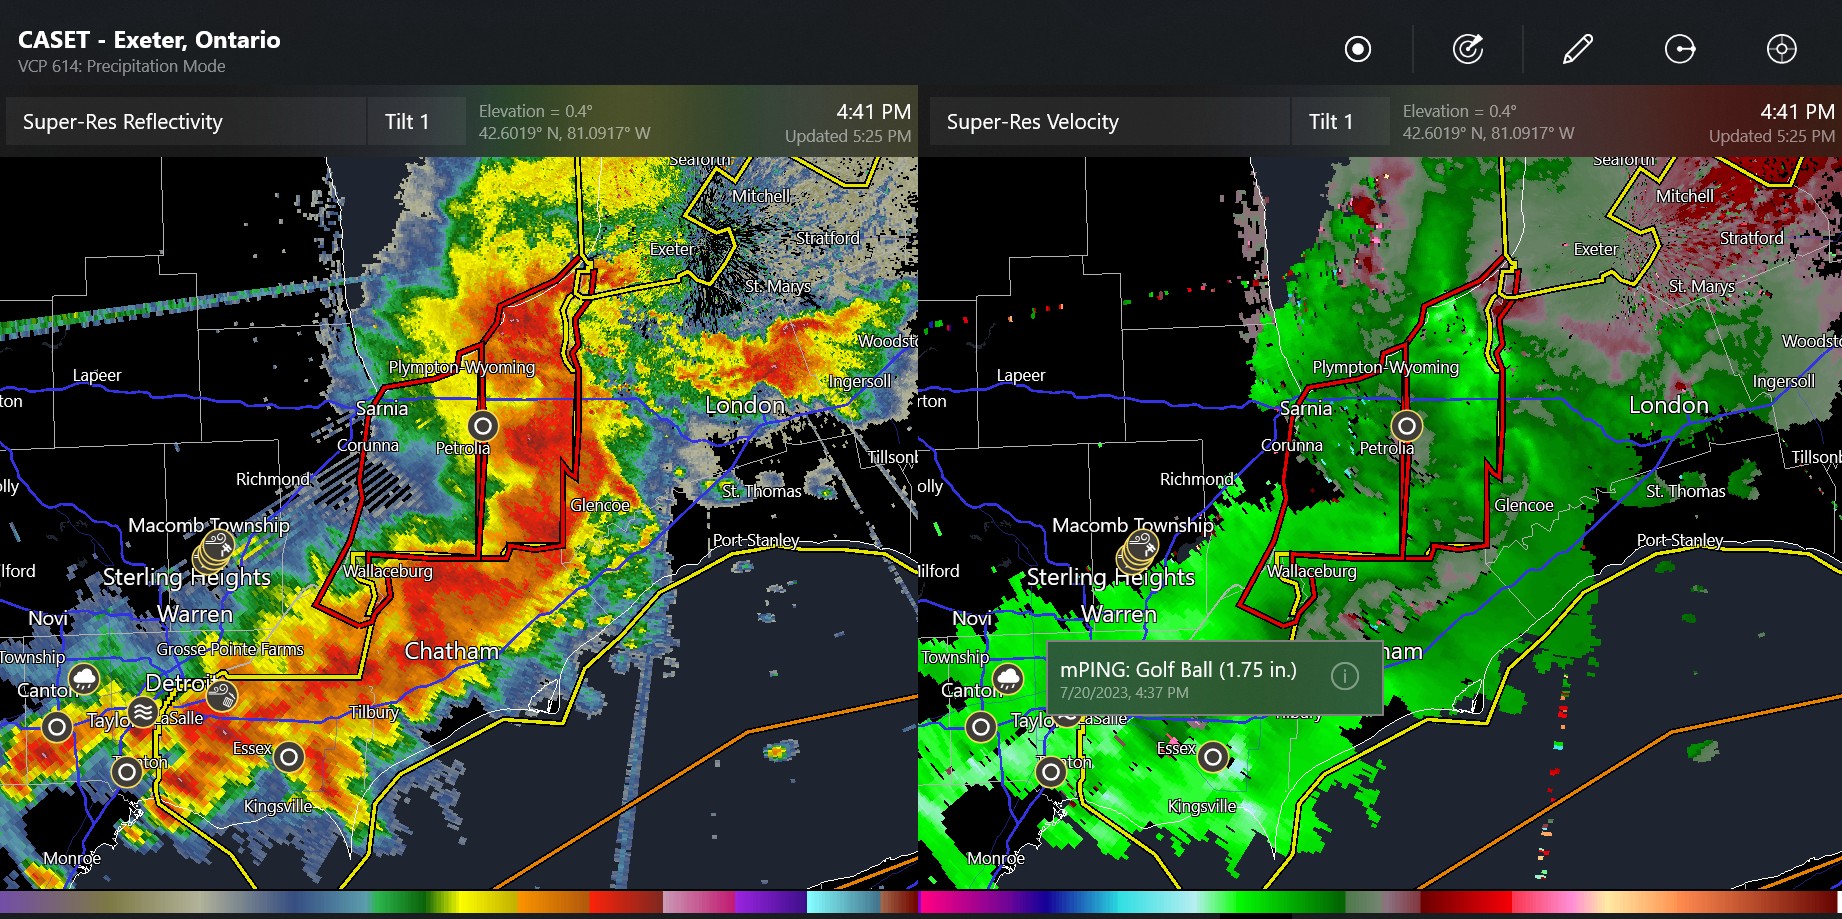
hey, large 1.75" hail in Canada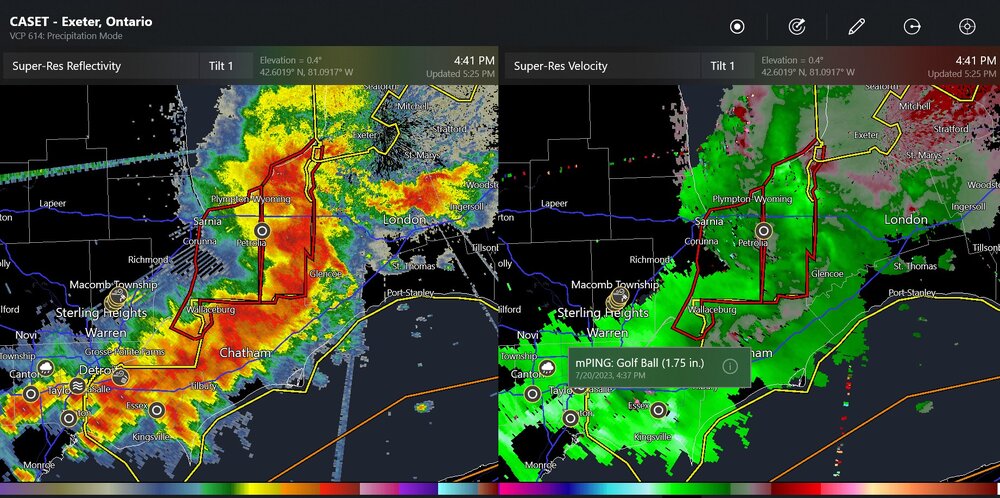
-
ConvectiveChronicles did a 17min video on the surprise NC tornado
-
2023 Short/Medium Range Severe Weather Discussion
Chinook replied to Chicago Storm's topic in Lakes/Ohio Valley
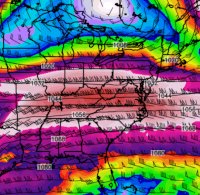
Things could get stormy tomorrow. Today's 12km NAM had 3900 J/kg of CAPE in NW Ohio. The models seem to vary on the 0-6km shear of 30kt up to 45 kt (the 18z NAM), which is quite good for summer, but storm relative helicity should not be remarkable. 12km NAM has up to 73 dew points in Indiana..thumb.png.df63eb7c209fa9492405088894db7a9b.png)

-
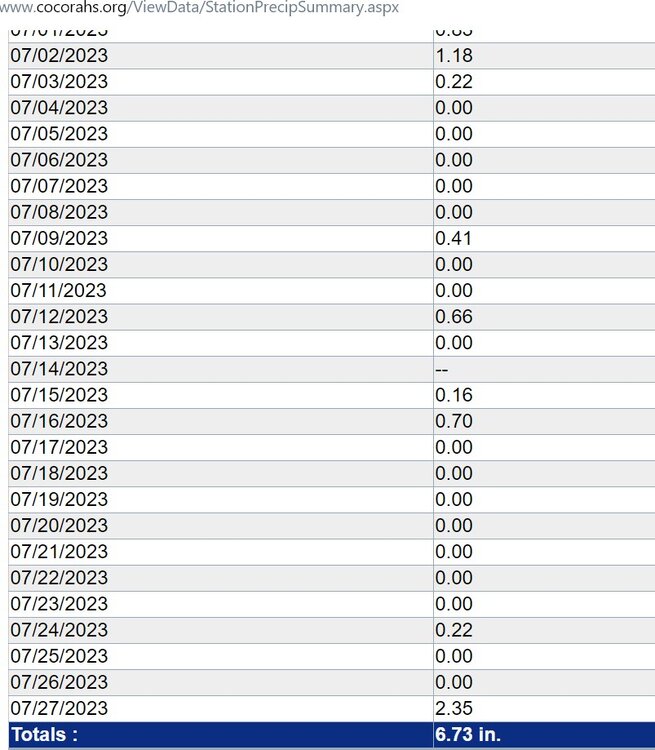
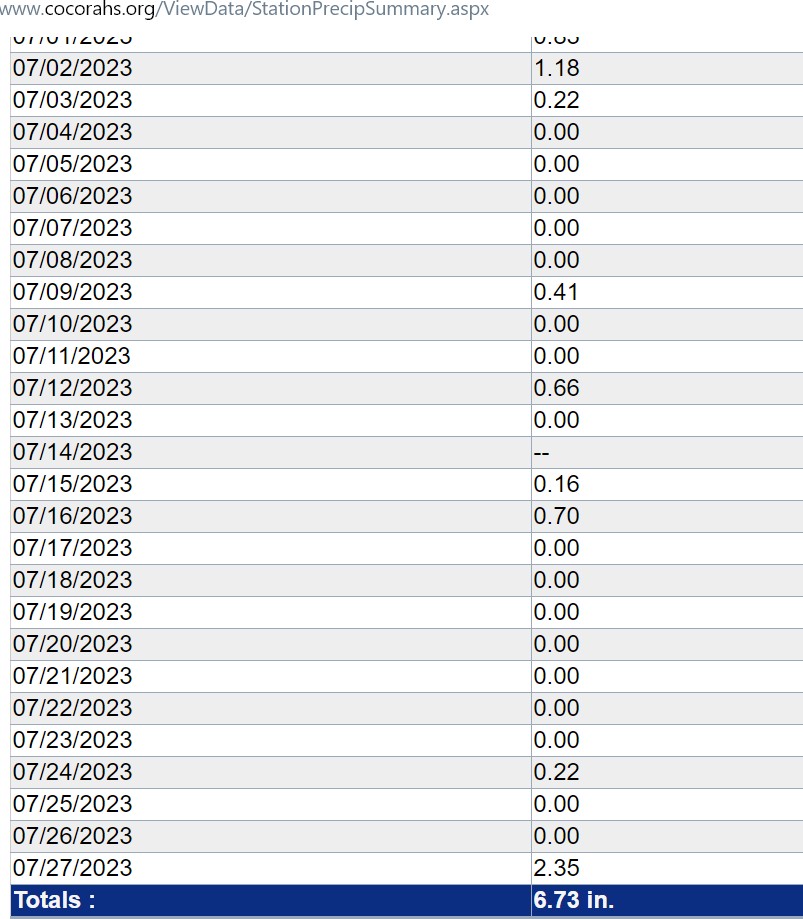
The CoCoRAHS station nearest me had 5.16" from June 20-July 19. It had 1.34" from May 21-June 20.
-
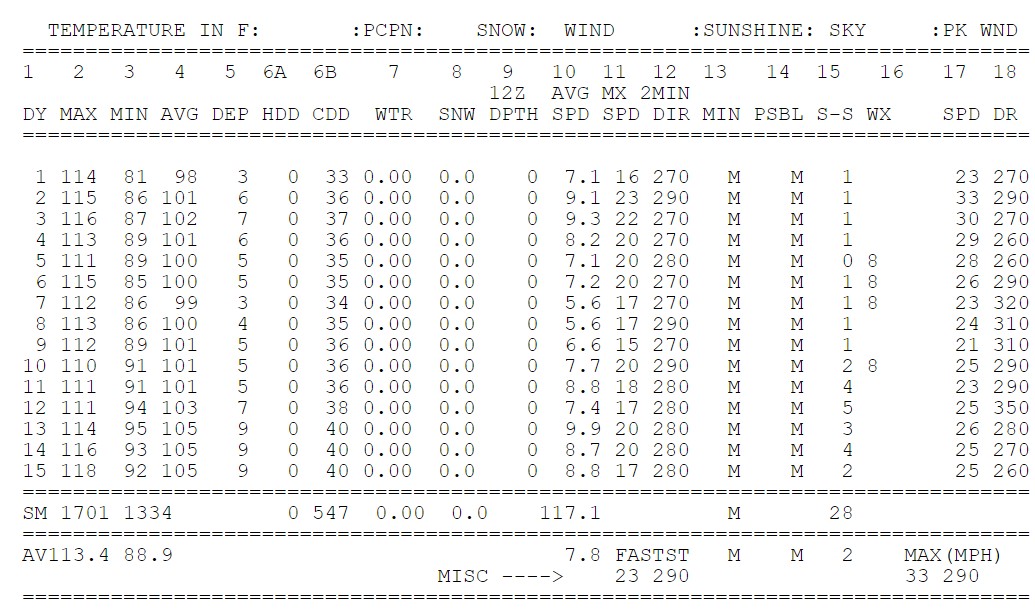
Now it was 128 at Death Valley CA climate station on the 16th. That's just some incredible heat. I wonder how many people drive there and realize their air conditioning can't keep up and have it 85-90 in the car.
-
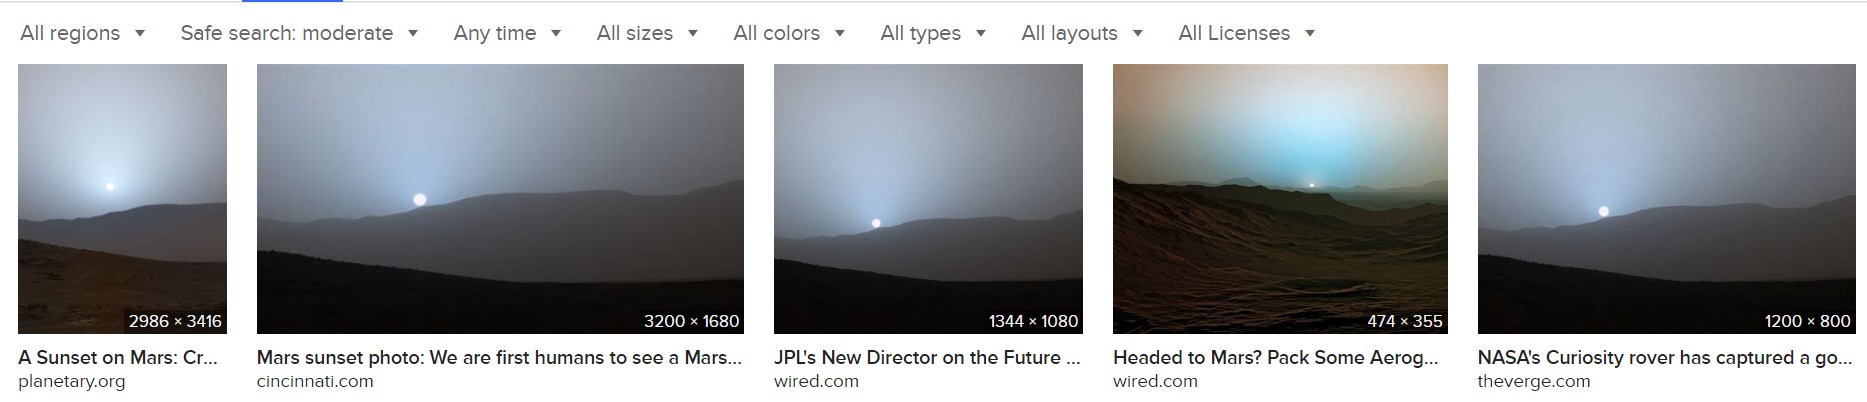
compare to mars

-
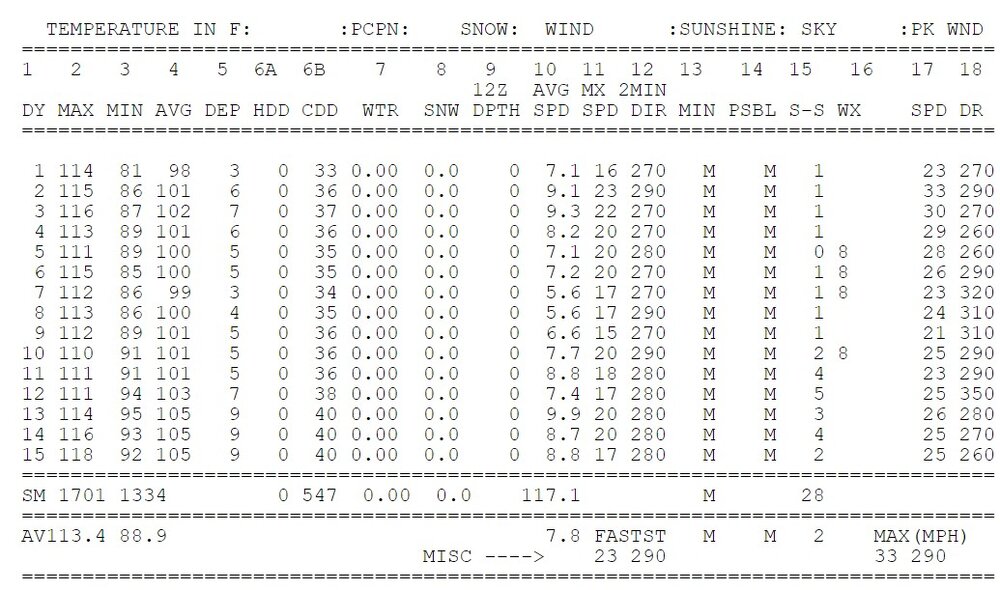
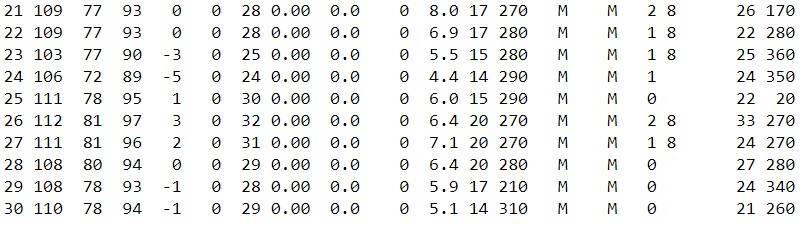
This is a stretch of 110's that I seriously would not want to happen to me. Do you want to know something else that's crazy? If this month's Phoenix temperature of 101.2 was compared to Phoenix 1951-1980 data, it would be 8.9 degrees F above normal. Phoenix (Sky Harbor) Late June Phoenix (Sky Harbor) July


.png.5eb3e539d50b9e233eacccf1a697b9d0.png)