Chinook
-
Posts
10,933 -
Joined
-
Last visited
Content Type
Profiles
Blogs
Forums
American Weather
Media Demo
Store
Gallery
Everything posted by Chinook
-
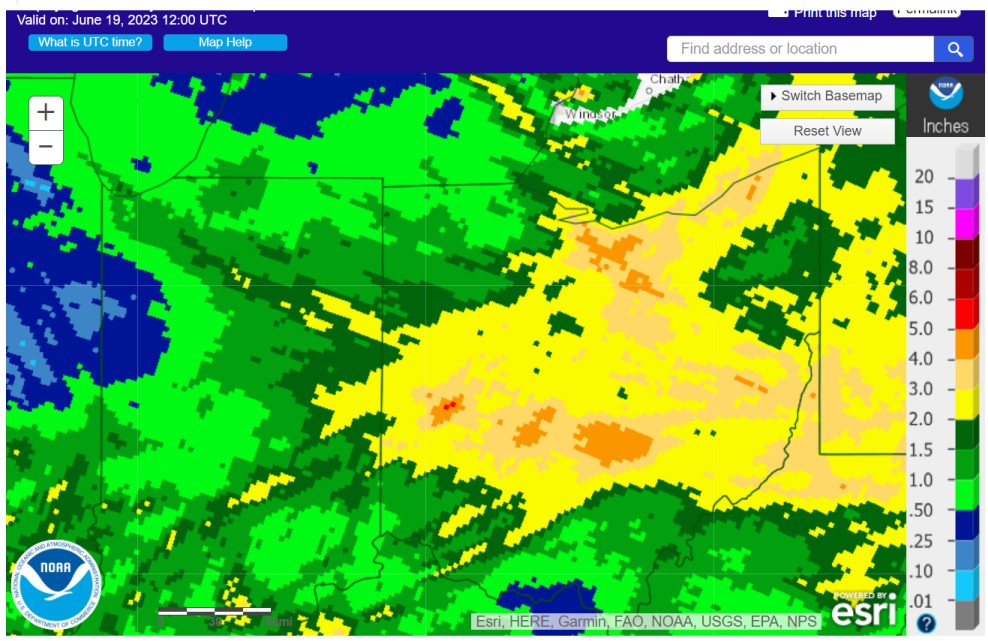
Once again, I must say that this just nuts. For the entire time I've been watching weather since 2002, drought flops back and forth between the Southeast and the western half of the country. This year, there seems to be undeniable tendency for the atmosphere to stop the rain over central Midwest over to NW Ohio and Michigan. Today was kind of rainy...
.thumb.png.6f485d1143619dc24a88fbfe8132d5b7.png)
-
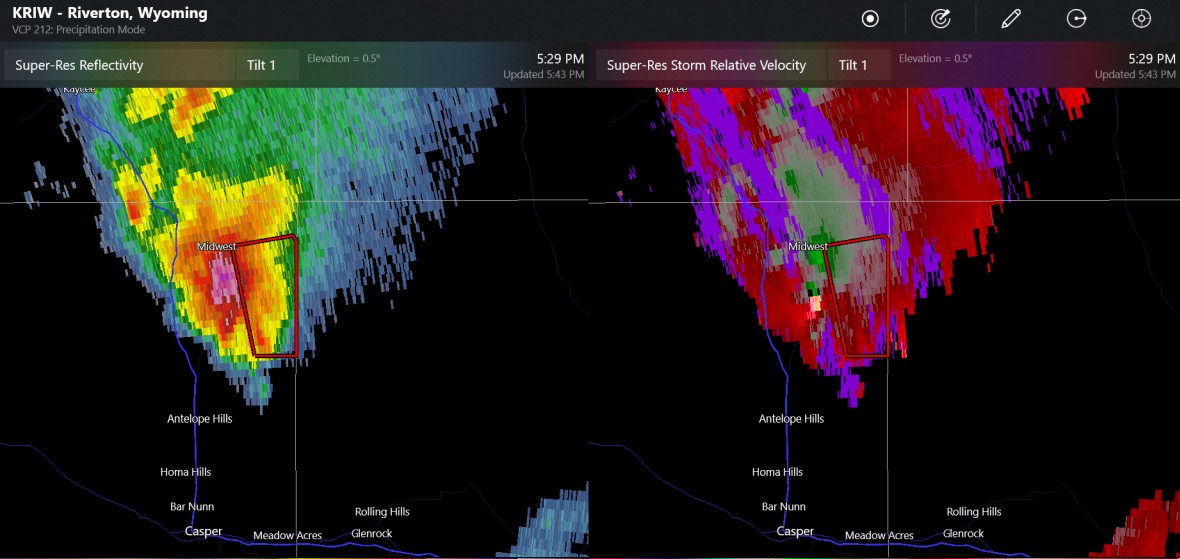
this tornado was teported north of Casper at 5:30 eastern (as seen above) - a long way from the Riverton radar but still the radar picks up a lot of detail. The rotation went over I-25 south of Midwest

-
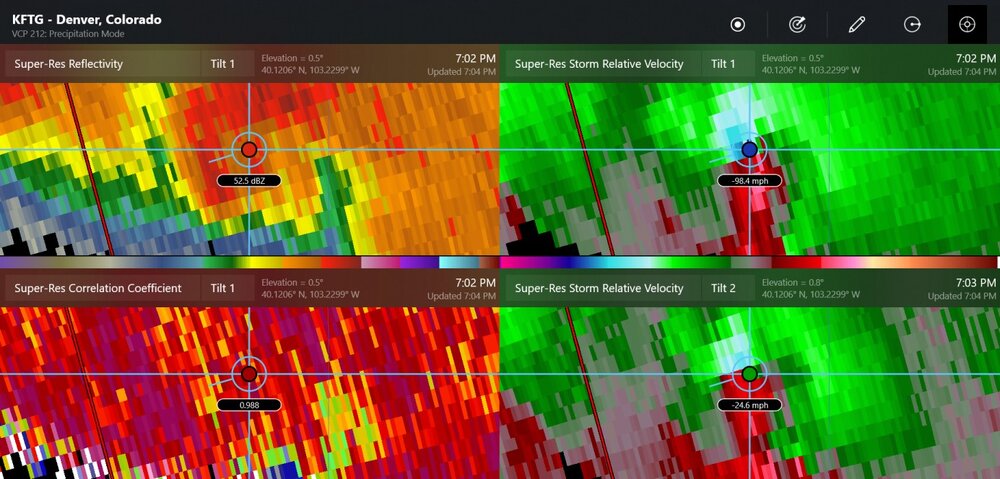
that's a lot. New severe warning for Denver, hail is likely to be in downtown pretty soon
-
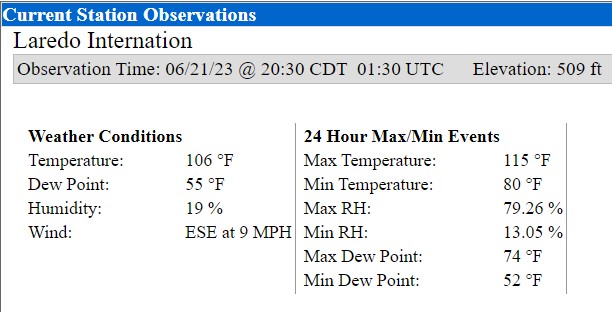
Texas/Oklahoma 2023 Obs and Discussion
Chinook replied to Ed, snow and hurricane fan's topic in Central/Western States
Maximum temperatures of 105 to 115 the Rio Grande will make this a memorable and dangerously hot day. (but I'm not sure if it is within a couple degrees of all time records)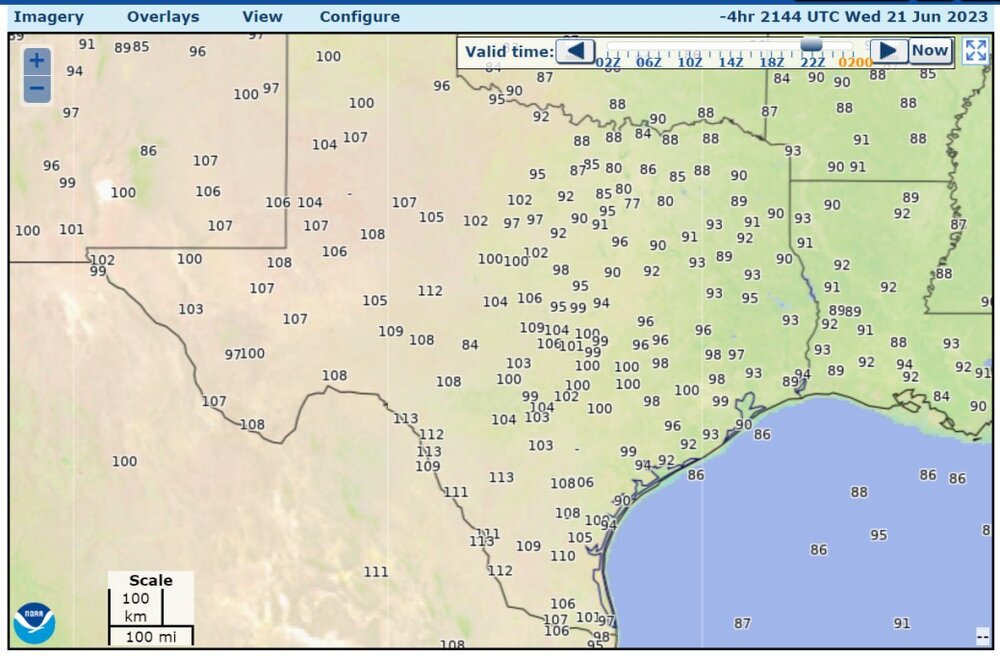
-
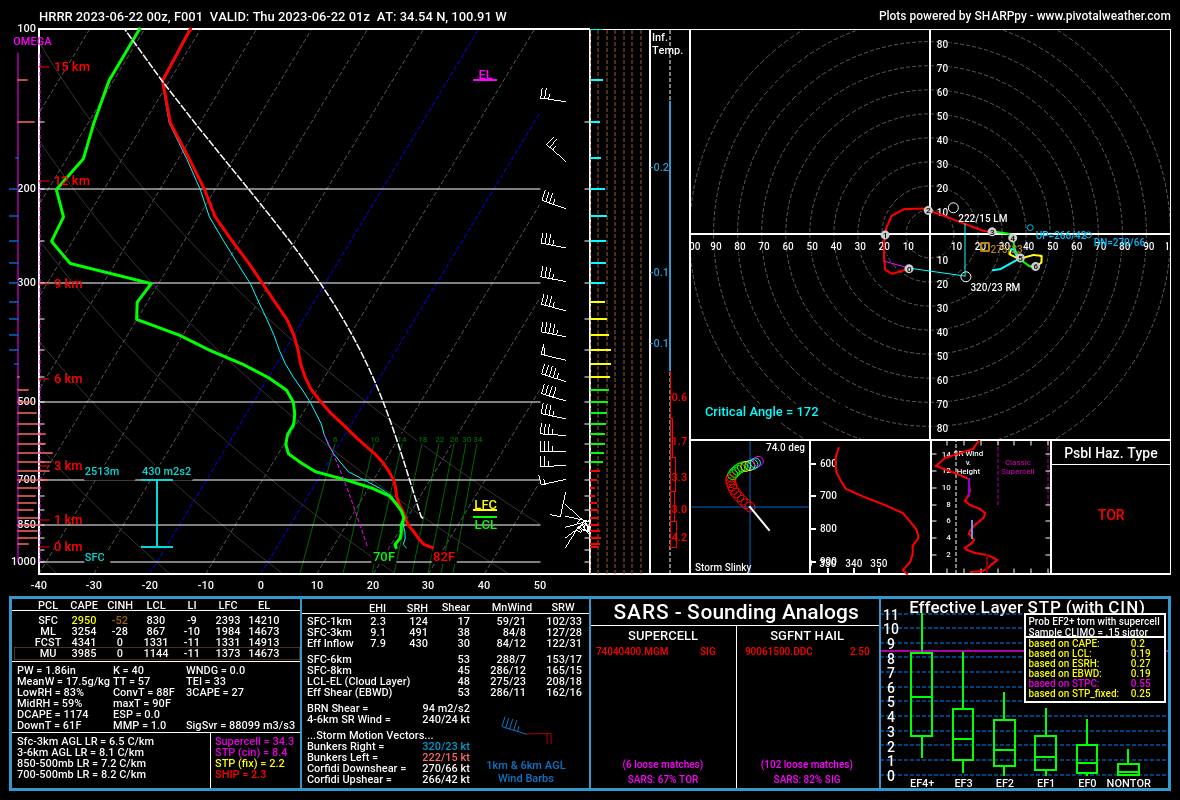
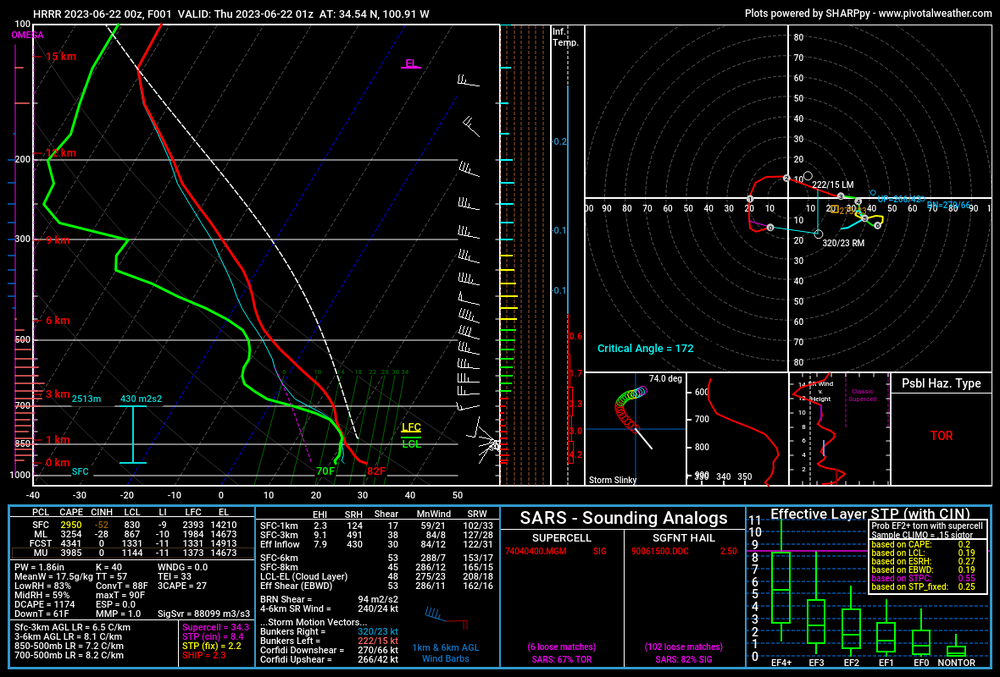
HRRR proximity sounding near the cell near Lubbock shows incredibly large SCP, STP, precipitable water
-
Hail in northeast Denver, also Coal Creek in the mountains
-
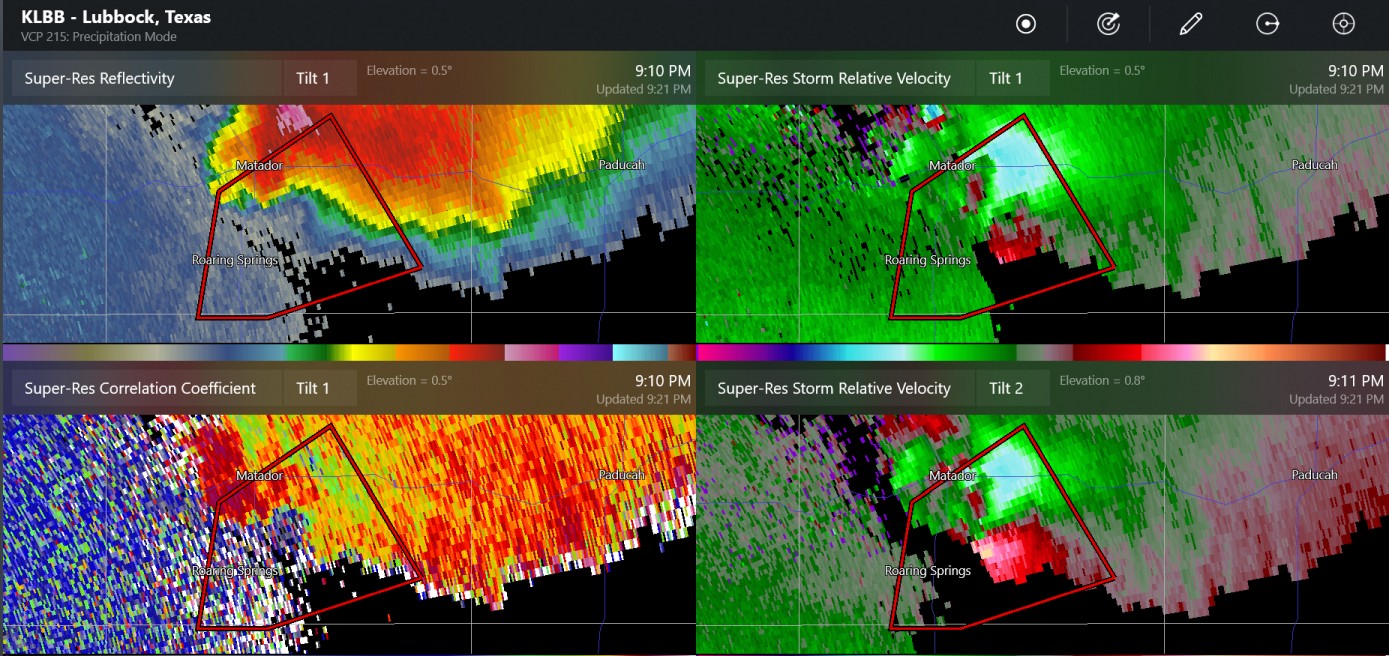
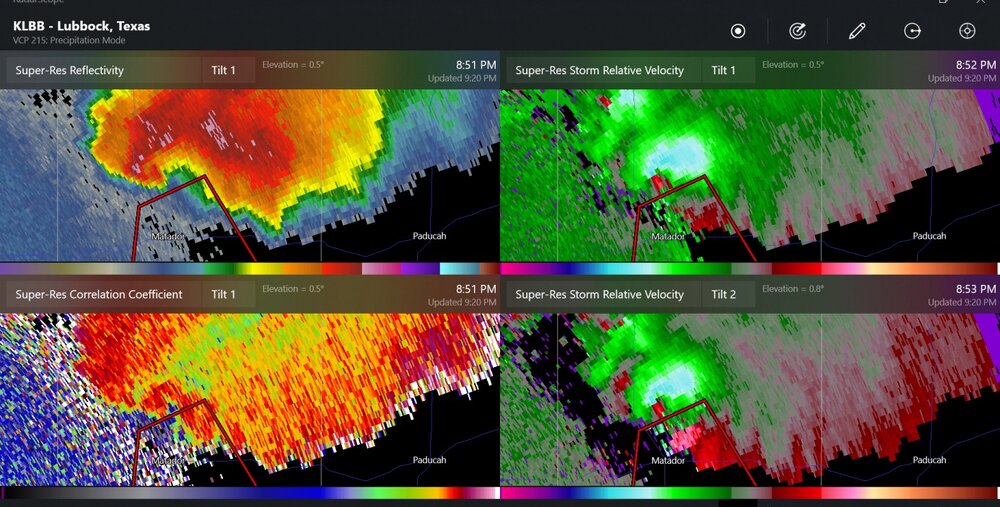
Near Lubbock, confirmed tornado

-
I made one post about that in Mountain West. Either that or it was a double tornado that I did not see on radar!
-
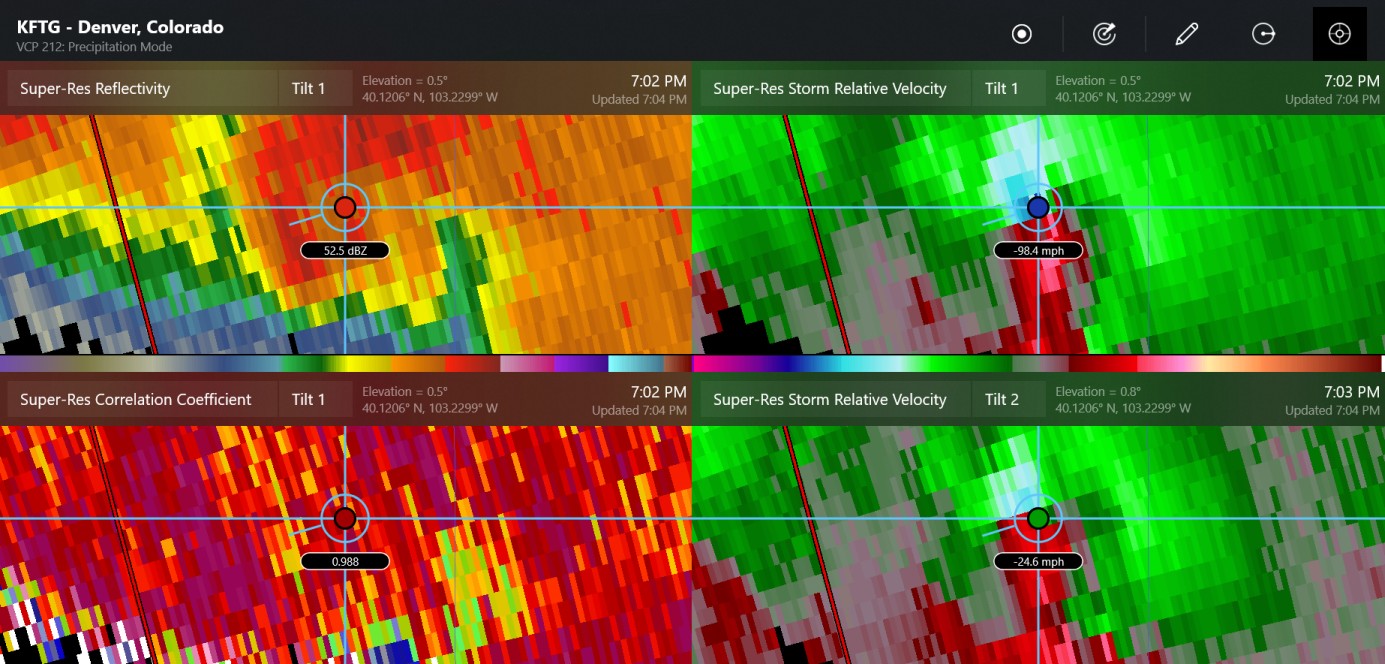
possible large tornado with maybe 98mph winds detected above ground (5800 ft above radar level)
-
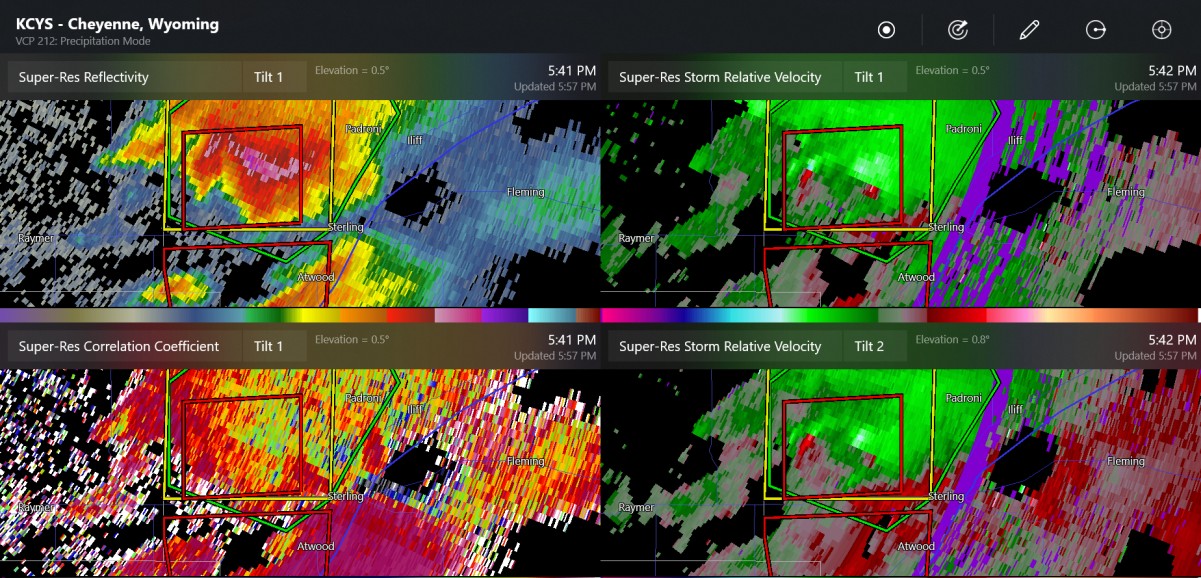
There have been 2-4 confirmed tornadoes near Padroni/Atwood?Merino in Northeast Colorado. It's possible that this radar image shows a double tornado situation, but the CC image does not really show the debris. SPC mesoanalysis shows an almost-impossible 5000 J/kg

-
I vote this as best mothership of all time
-
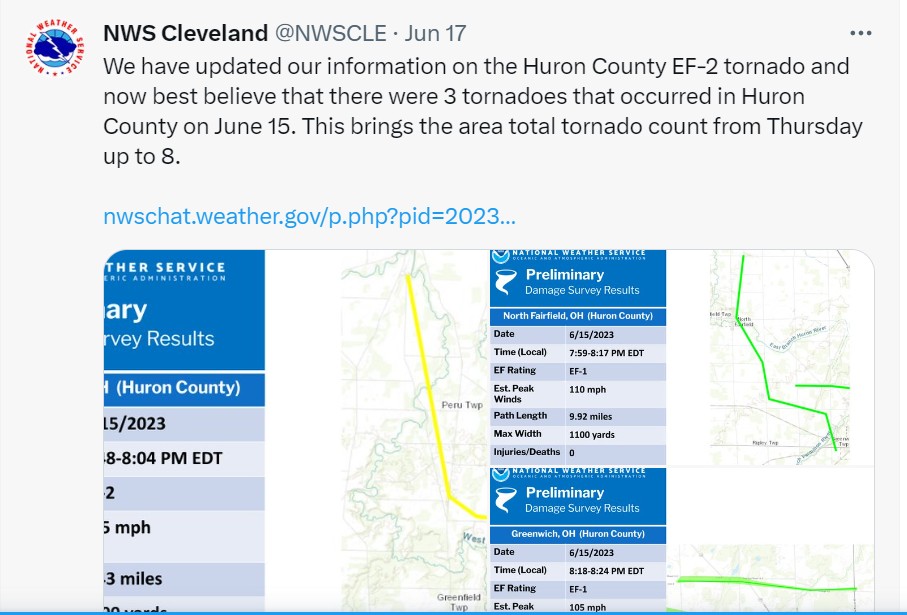
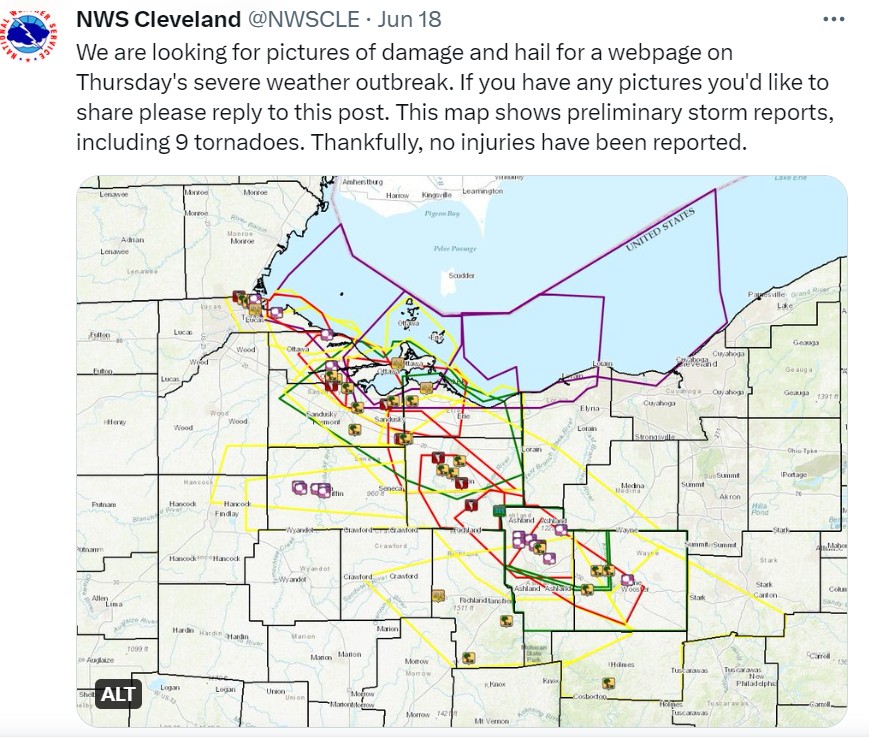
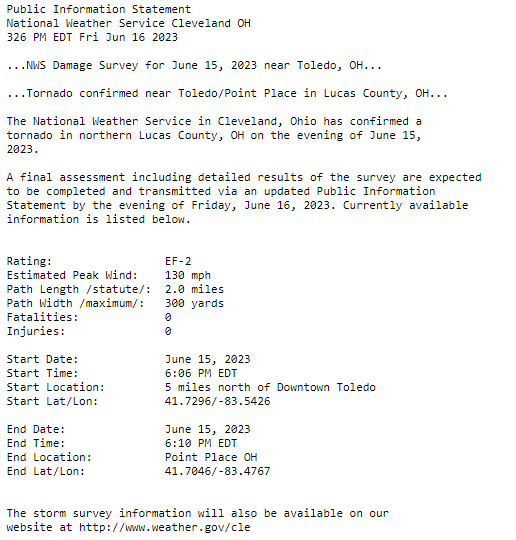
Here are two new relevant tweets by NWS Cleveland
-
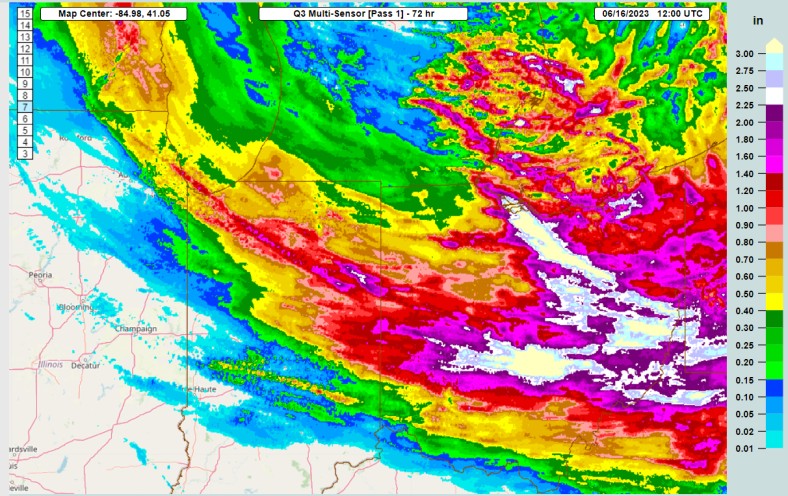
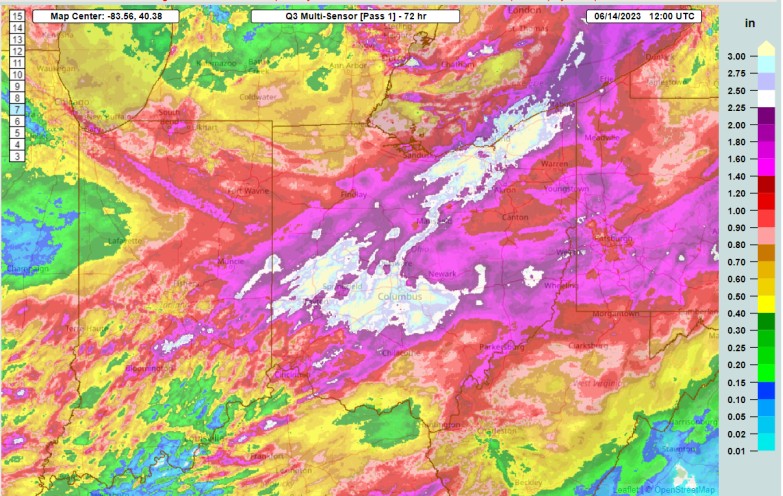
golf ball hail has some serious downward speed yeah, least thundery spring probably in history here June 11-14 and then, overlapping by 1 day, June 13-16, precip by MRMS/multisensor. Some of Ohio and Indiana had some nice drought-busting rains of over 2"-3". My place had light rain during last week, but some relief. At least the rain could soak in with temps of 50-70 for quite a number of hours last week. June 5-19 (14 day) precip
-
2023 Atlantic Hurricane season
Chinook replied to Stormchaserchuck1's topic in Tropical Headquarters
Bringing this back to seasonal-level discussion. The recent (June 6) CSU forecast has 15 Named Storms, 7 Hurricanes, 2 Major Hurricanes. The asterisk here is that it includes the unnamed storm that already happened 6 months ago in January . So including these specific numbers, it's really normal, also the ACE is really normal. So I guess the negative features of El Nino will be maybe fighting against some positive features, like the stronger African monsoon. For all you New England persons out there, Phil Klotzbach used to have a team picture of the 2004 Red Sox in his office when he was at CSU's campus. -
I guess the 2 ft of snow in your yard melted Summer isn't here, as per the Astronomers. That is, unless, you wanted to define astronomical summer as the 91 days when the sun is highest. If so, then it arrived 45-ish days before June 21st-- that's May 7th!

-
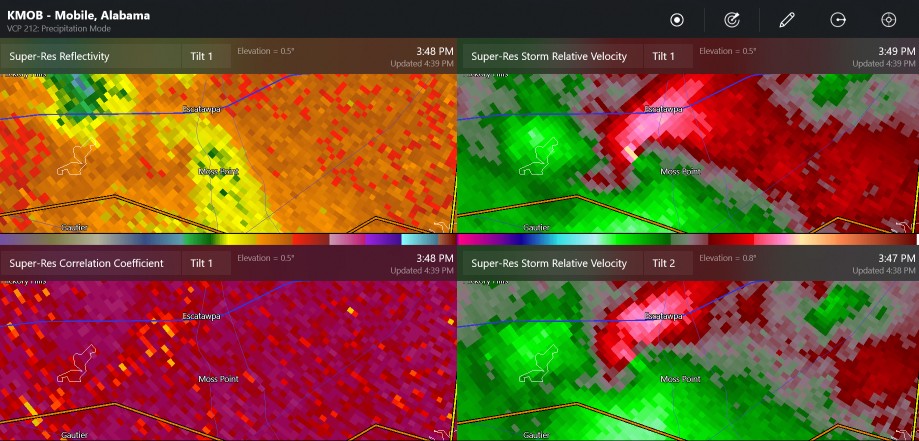
This tornado was a few miles from Pascagoula MS. It was a supercell tornado. This area typically has non-supercell tornadoes at this time of year with the sea breeze convergence
-
The HRRR says Tyler Texas has temp of 89, dew point of 82, sfc/MUCAPE of 8051 J/kg
-
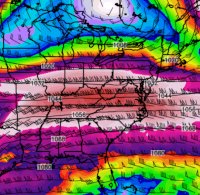
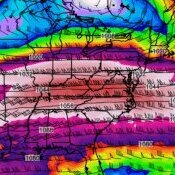
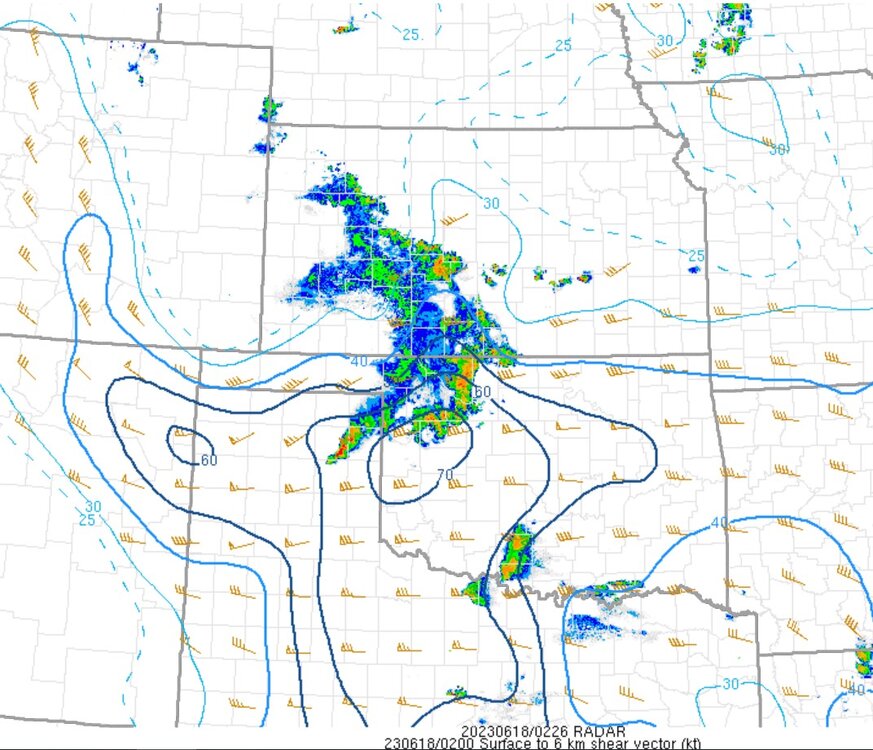
Here is some high 0-6km shear in mid-June again. It's absurd. It's hard to get the 60 kt shear values for a lot of the year, and harder in the summer months. The storms in north Oklahoma have transitioned to producing an impressive squall/bow echo.
-
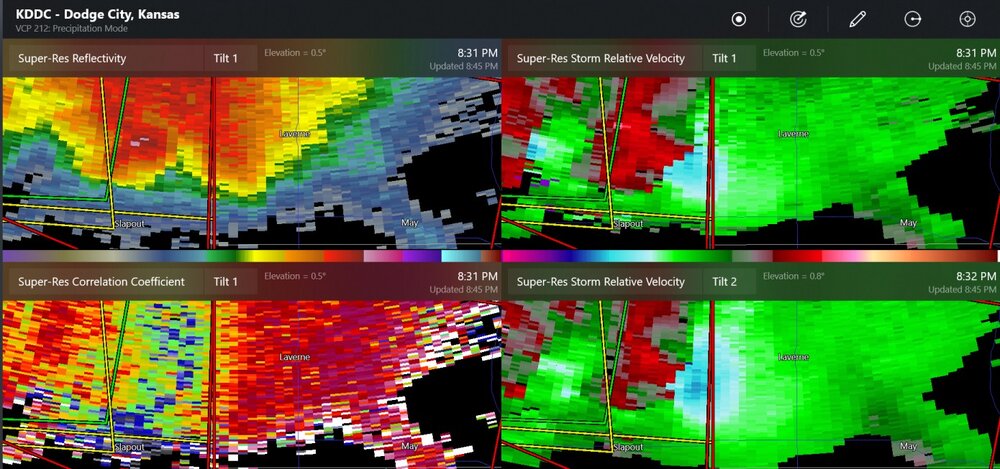
confirmed tornado west of Laverne , OK
-
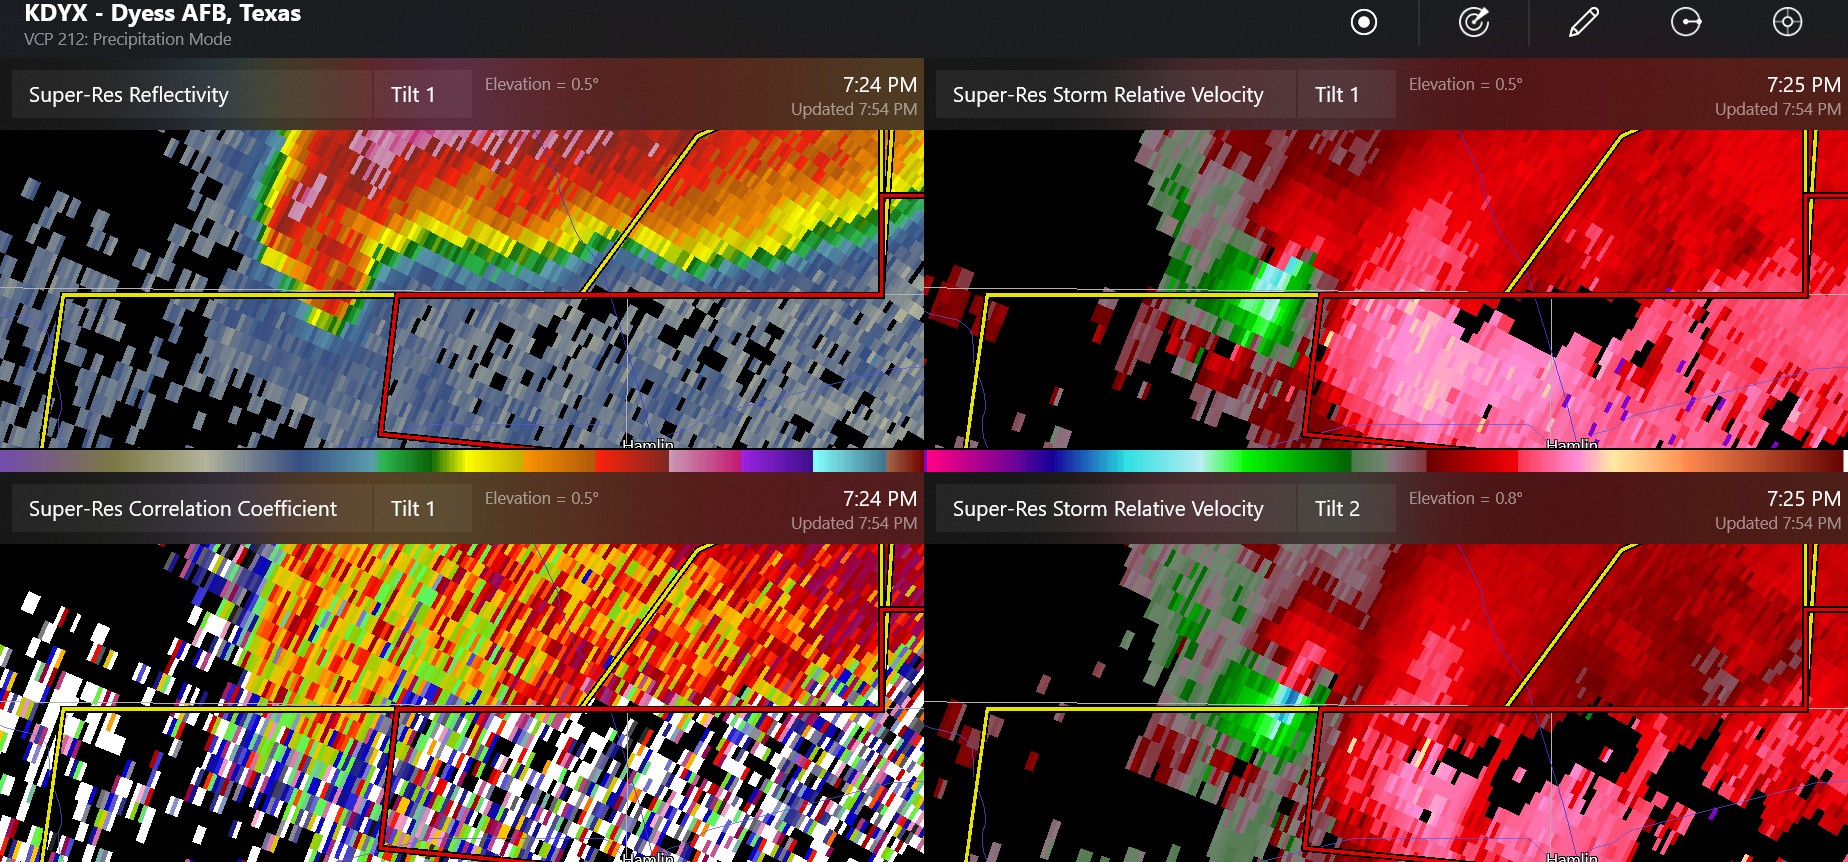
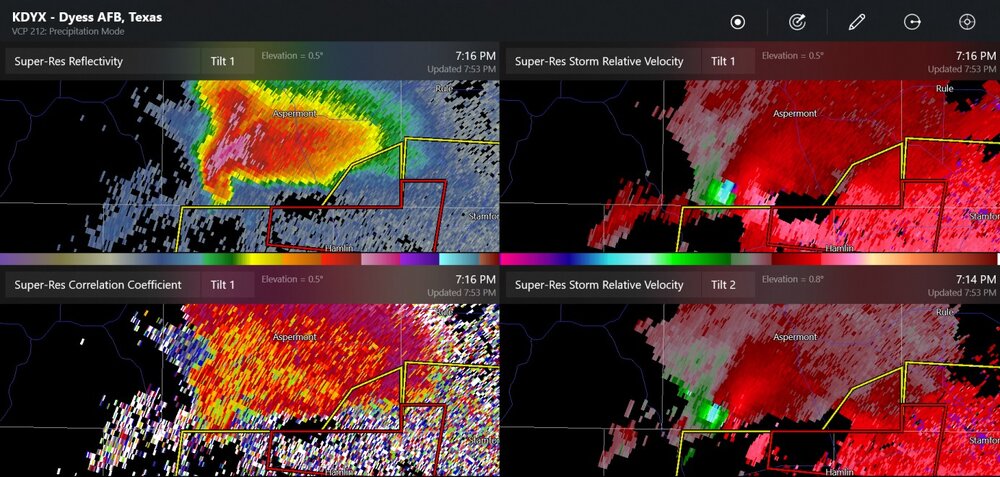
Aspermont TX area

-
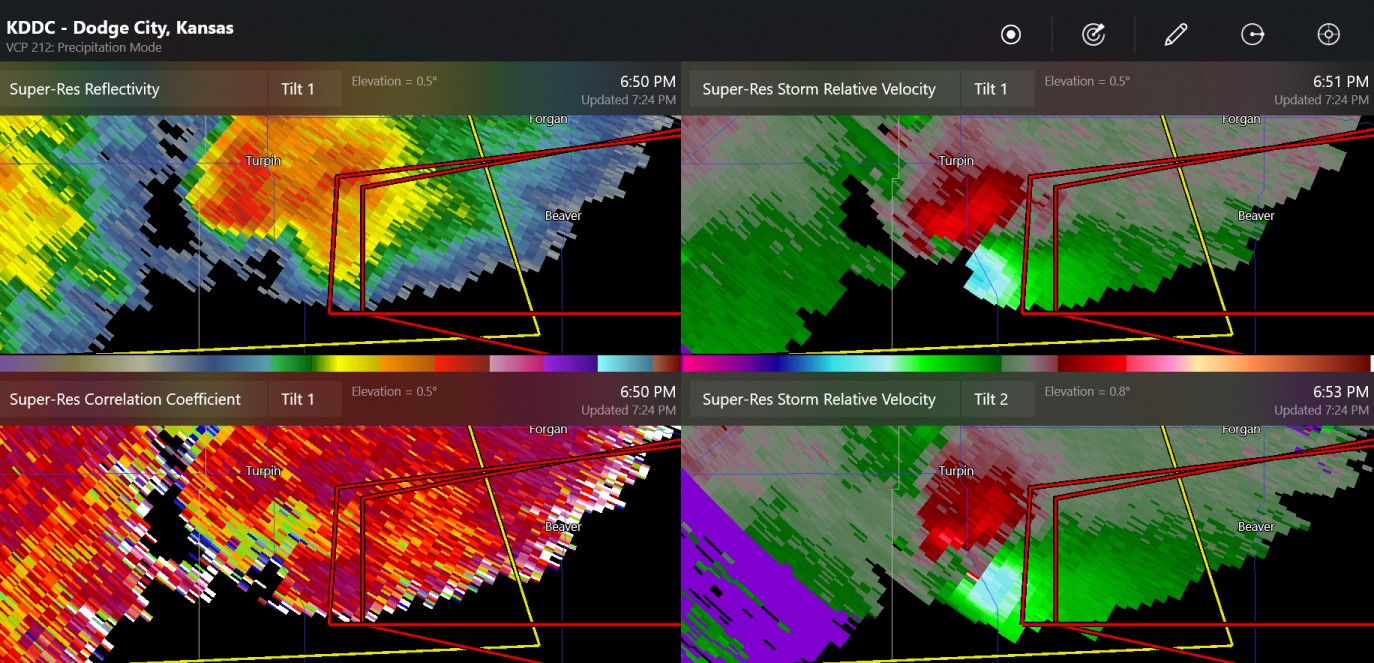
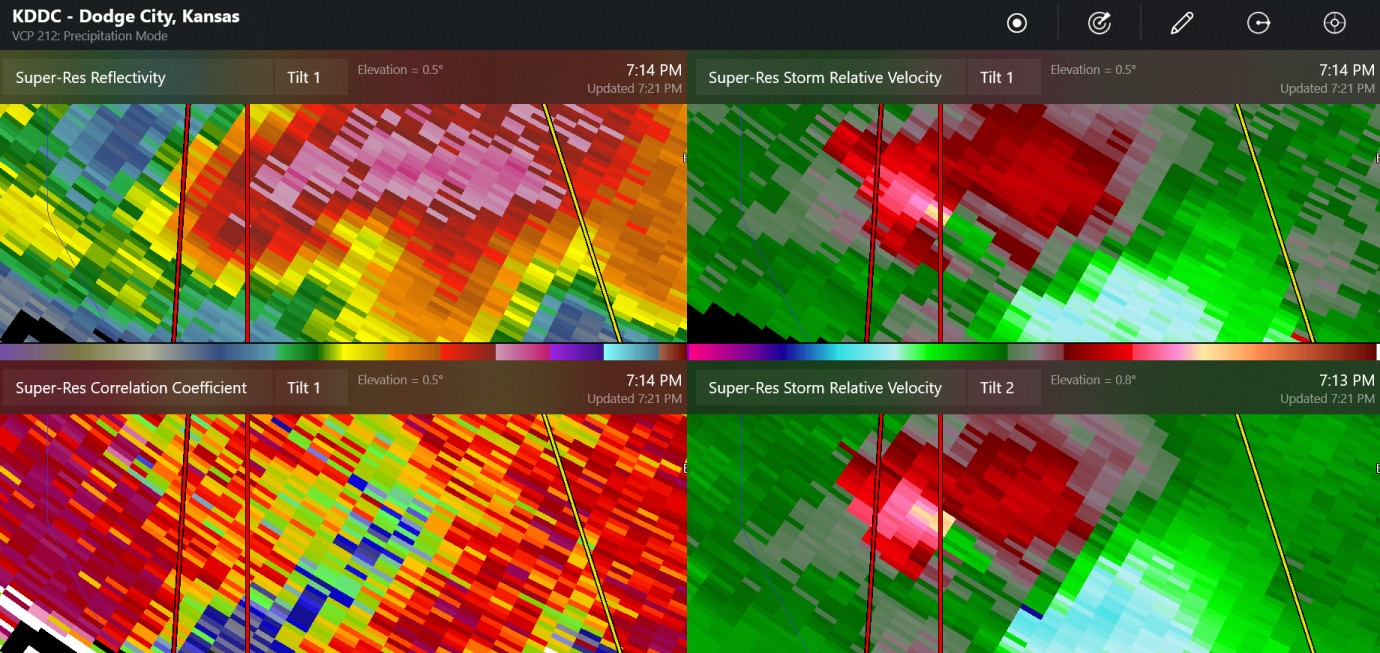
tornado at Turpin Oklahoma, 652eastern, 552 central, confirmed tornado warning is still in effect


.gif.6e8f1640ef6be6715fda01c1e25e8c61.gif)
-
2023 Mid-Atlantic Severe Wx Thread (General Discussion)
Chinook replied to Kmlwx's topic in Mid Atlantic
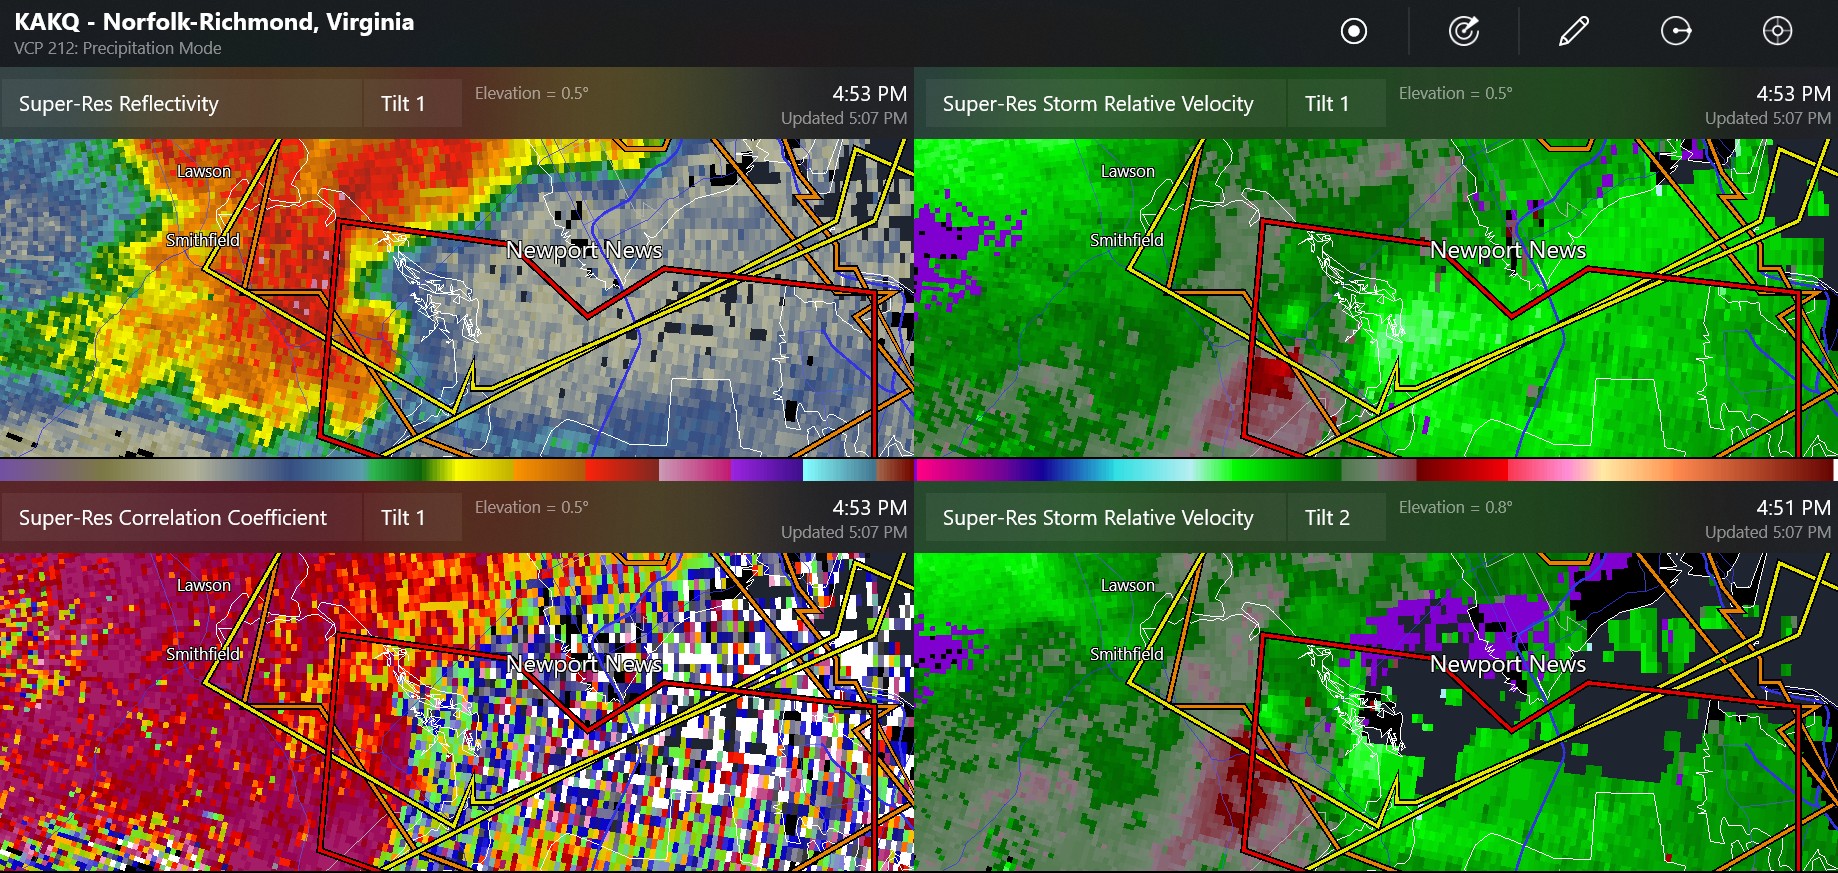
notable storm reports. The tornado report is hiding behind the 80mph wind indicator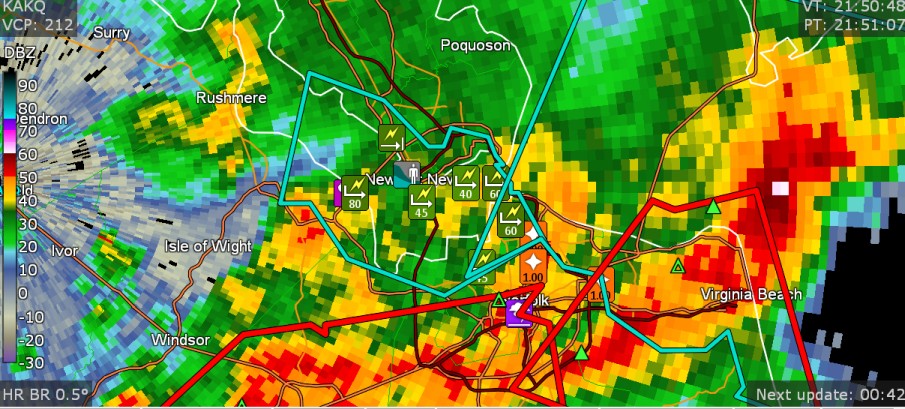
- 2,785 replies
-
- 2
-

-
- severe
- thunderstorms
- (and 3 more)
-
2023 Mid-Atlantic Severe Wx Thread (General Discussion)
Chinook replied to Kmlwx's topic in Mid Atlantic
this was a tornado report at Newport News/Carrollton, west side of the James River at US17
- 2,785 replies
-
- 4
-

-
-
- severe
- thunderstorms
- (and 3 more)
-
NWS survey (from twitter)
-
Looks like WTOL says tornado damage near Oak Harbor and near Fremont, but they don't say much more than that. Otherwise, confirmed tornado video at Point Place (that is in Toledo, by both rivers) My best guess is the video and/or damage picture was taken at Summit St. at 131st St.
.png.8b05896261233deae938e5e29dca045c.png)