Jump to content

Chinook

Meteorologist
  • Posts

    9,458
  • Joined

  • Last visited

Everything posted by Chinook

  1. As for northern Ohio discussion: my call is for a 50% chance for a wind gust over 50 kts (58mph) at KTOL on Christmas Eve- very early Christmas Day.
  2. 5-10 inch rain amounts have affected the Pac NW. This weekend another 1-3" should affect the Pacific coast ranges. Apparently, the Hurricane Ana remnants will affect the Pac NW on Monday. I'm glad to see the Pacific coast get some rain. Not much for California though. Halloween-November 2nd seems to be cool and dry east of the Mississippi. That's over 168 hours though. It really doesn't seem too weird, perhaps just the first temps below 32 degrees for northern areas.
  3. I was at the Ohio Severe Weather Conference a few years back. I saw Harold Brooks talk about climatological CAPE and shear. I believe Brooks said that the fall severe weather season is partly ruined by bad lapse rates from the Mexican Monsoon. Weak lapse rates are typically advected in from Mexico, they are much closer to moist adiabatic than the EML of springtime.
  4. The NAM is advertising some 5-10 EHI values for Iowa, Minnesota, and Missouri tomorrow. That's pretty high for September!
  5. heavy snow for Canadian Prairies shown in 3-5 days on the recent runs of the GFS
  6. -38F and -32F at Fairbanks Ft Wainwright (-38F) PAFB 211855Z 00000KT 6SM BR FEW008 M39/ A3014 RMK PWR PLNT PLUME FEW008 Fairbanks Airport (-32F) PAFA 210753Z 00000KT 7SM CLR M36/ A3031 RMK AO2 SLP287 T1356 PNO
  7. This is kind of old news now. Fairbanks got to 92 degrees, only 4 degrees below its highest June temperature ever (96) on June 25 and 26 2013. The highest all time temp is 99, so that's still several degrees above the 92 of this year. ------------ FairbanksYears: 1904-2013RANK 4 92 6/26/2013, 6/25/2013, 6/22/1987, 6/20/1958, 6/25/1916 ----------- Nome AK tied its highest all time temperature on June 19 2013 ---------- NomeYears: 1906-2013Rank Value Ending Date 1 86 6/19/2013, 7/31/1977, 7/8/1968 ----- McGrath AK, also highest temperature ever ------- Mcgrath Area (ThreadEx Station)ExtremesHighest Daily Maximum Temperature (degrees F)Days: 1/1 - 12/31Length of period: 1 dayYears: 1941-2013Rank Value Ending Date 1 94 6/17/2013 2 91 6/18/2013 3 90 6/16/2013, 6/15/1969
  8. I updated my high CAPE page, based on some of the things you guys posted here http://www.greatlakes.salsite.com/high_CAPE_1.html almost one year ago: 8000 J/kg analyzed by the RAP/SPC http://www.greatlakes.salsite.com/SevereStorms/high_CAPE/2012_06_29_00z_MUCAPE.png
  9. Those ones from the previous post are actually posted on my web site (I should re-write that web page.) Anyway, I have a new nifty sounding for you. Last year, before the Super-derecho of 2012.. Davenport.
  10. Mayo Yukon, -47C CYMA 011900Z 00000KT 20SM VCFG SKC M47/ A2994 RMK VIS W SLP245
  11. Bowling Green Ohio- book by county weather historian. "Back in the extremely cold winter of 1918, a severe blizzard commenced.... snow drifts ten feet high and dropped the temperature to 18 degrees below zero." Bowling green went from +24 to -18 that day. I can't exactly say what the wind chill was at any hour. It might have been 0F with a wind of 30mph, resulting in a wind chill of -25.9F. That's probably conservative.
  12. Part of Siberia and Alaska more than 32 C below normal. That's the turquoise colors. That's 58 F below normal. source for this plot: http://policlimate.com/weather/current/raw_temp_c.html November 1st to January 23rd temperature anomalies on NCEP reanalysis. Wow. cold times in Alaska. Quite the La Nina surprise in western Canada and North Dakota.
  13. I'll be enjoying the 3C above normal range. Alaska can keep the 17C below normals for the next 8 days.
  14. 20-48 degrees F below normal in 7 days! Watch out! 8-day average temperature anomaly in southern Alaska: 5-12 Celsius.
  15. I used to have a web page about this, and I still have the files on the internet. 7150 J/kg or more at GREEN BAY WISCONSIN, July 31, 1999 (actually the evening of July 30 1999) I think the Plymouth sounding system uses a mixed layer, so I think the actual CAPE is over 7200 J/kg http://www.greatlakes.salsite.com/SevereStorms/high_CAPE/july_31_1999_00z_GRB_sounding.gif
  16. I woke up a little early this morning. Supercell composite of 50 and an effective-layer significant tornado parameter of 12. I think the highest I've seen is 44 and 11.
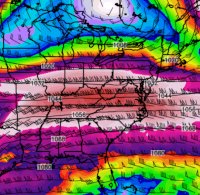
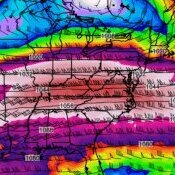
  17. Synoptically it has some similarities. Tomorrow, two low pressures (surface) will exist. In 1974, there was one main low pressure. Check the 500mb chart of the morning and evening of April 3, 1974. There are some similarities to tomorrow's 500mb chart. Nobody can know for certain what type of tornado destruction will happen, but no outbreak brought about more destruction than the Super Outbreak. It's unlikely that April 27, 2011 will go down as the worst of the worst tornado outbreaks.
×
×
  • Create New...