All Activity
- Past hour
-

2026-2027 Super El Nino
snowman19 replied to Stormchaserchuck1's topic in Weather Forecasting and Discussion
+12C subsurface anomalies are coming And the WWBs just keep pushing that 30C isotherm further and further east of the dateline. Great forecast by the EURO months ago showing the record far east warm pool -
 Cheap generic Viagra online [url=http://medmennews.com/#]Med Men News[/url] sildenafil over the counter
 - Today
-
http://medmennews.com/# MedMenNews Viagra without a doctor prescription Canada
-
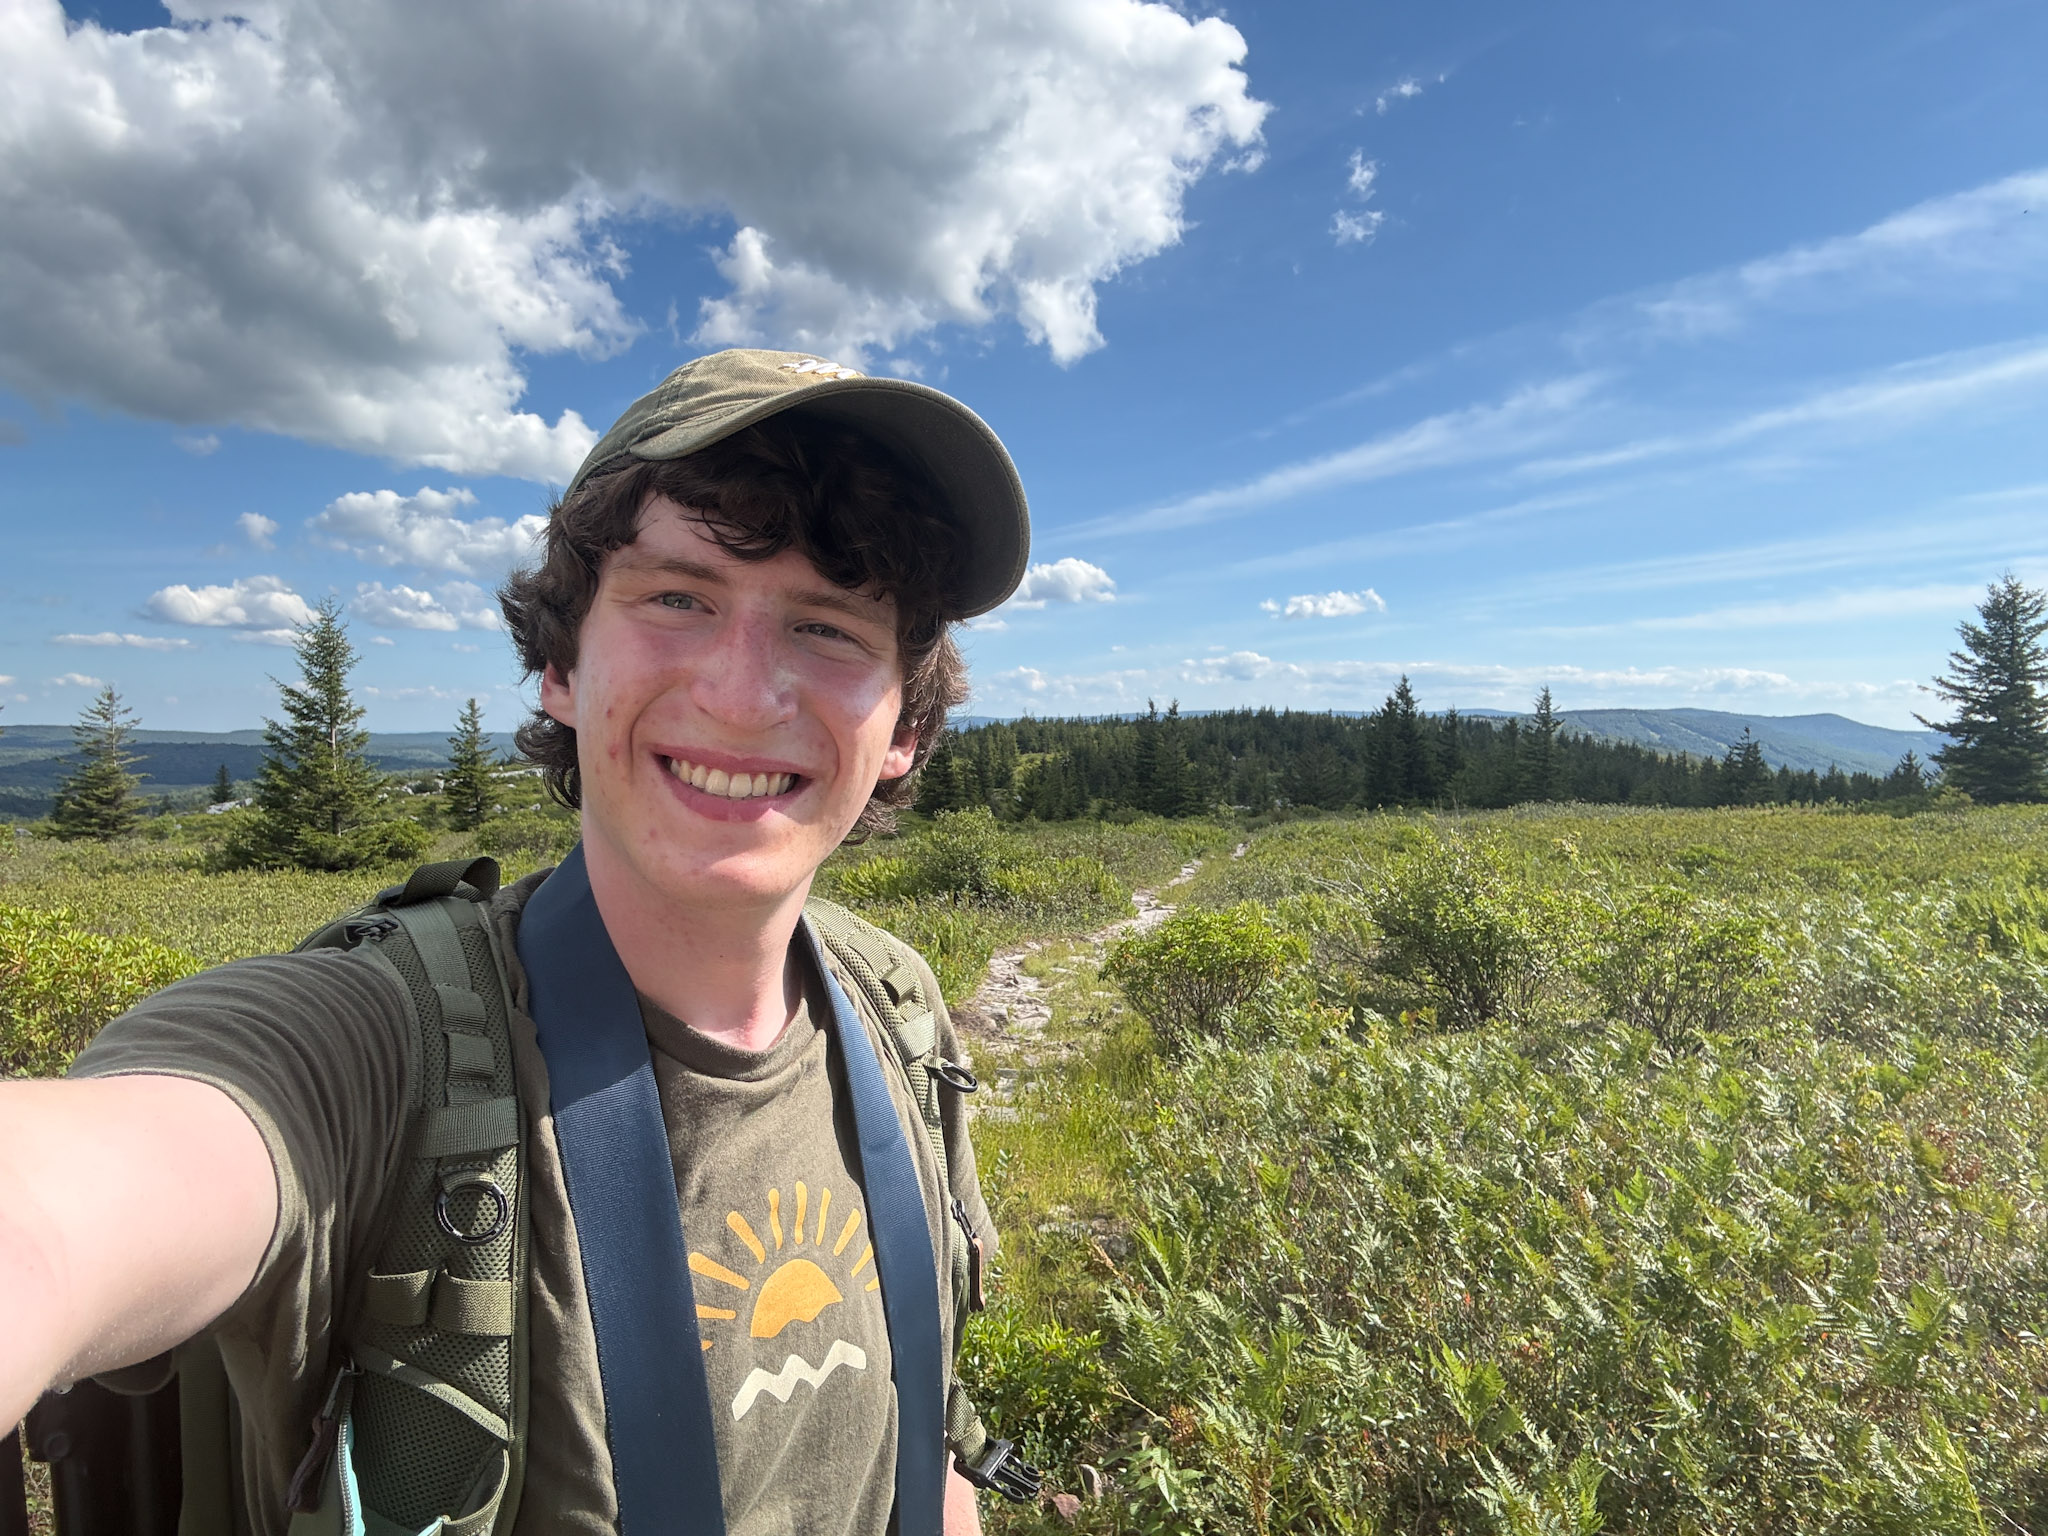
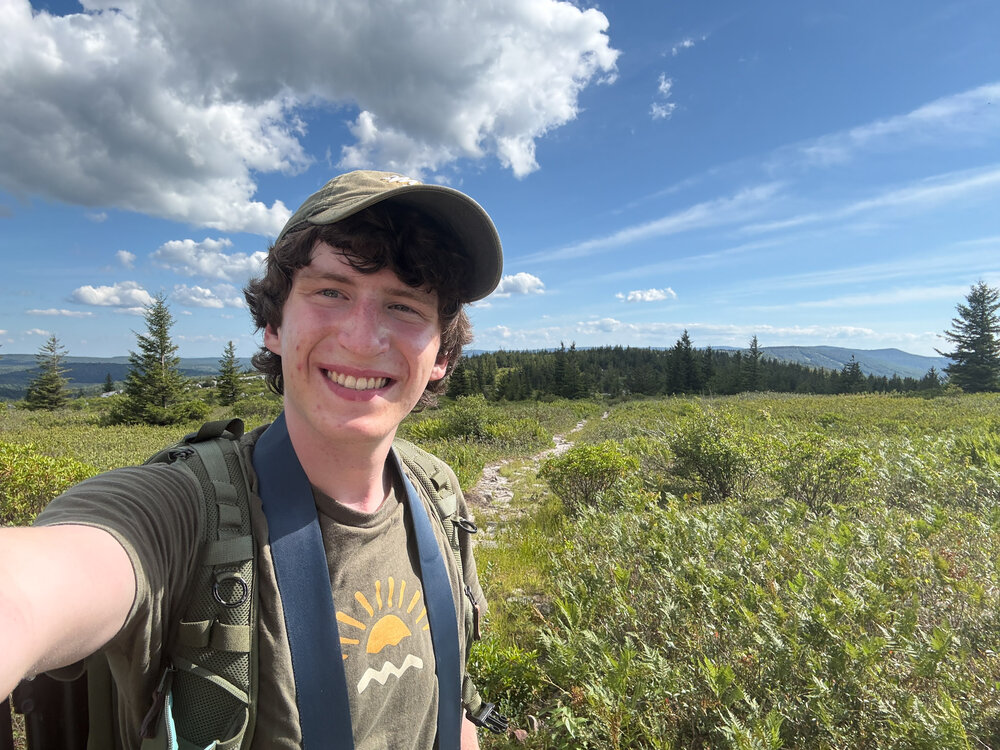
If you need a taste of fall head out to Dolly Sods WV! I went today (I guess yesterday now) and it always amazes me how the Allegheny Front is just a different climate. Drove up from the valley at 82 degrees to the top at 70 degrees. Went on a 12 mile hike and the landscape was beautiful, reminded me of tundra shrubbery I learned about last year in an arctic ecology course. Crossed Red Creek and entered the mud flats for 1 mile which was a bit rough. Otherwise, nearly a perfect day, and would recommend without reservations! (just skip the end of dobbins grade trail and take ravens ridge instead) Driving wasn’t too bad either, 2 hours 35 minutes and the vast majority of it was 4 lane highways (even in WV!). I’ll upload my other pictures later, but here’s one from my phone!
-
buy Viagra online: Med Men News - viagra canada
-
Viagra tablet online: MedMenNews - over the counter sildenafil
-

Occasional Thoughts on Climate Change
LibertyBell replied to donsutherland1's topic in Climate Change
Climate change affects different places differently which is why I like this term better than global warming. For this region the warming is more in the winter. This isn't just about 1936 either or even Central Park bad siting. 1966 still holds the heat records for both LGA and JFK 107 and 104. I'd argue that 107 at LGA from July 1966 is more impressive than the 108 at Newark from July 2011. And big heat domes aren't a new thing, 1980, 1983, 1988, 1991, 1993, 1995, 1999 and 2002 had plenty of them. It's why I consider the 1980s and 1990s to be hotter especially ranked by duration of heat waves and number of 100 degree days. 1993 is still untouched in that regard. We can even go back to 1911 to see a heat dome as bad as 1936. JULY 2-4 that year Mt Pocono hit 98 99 and 103 on consecutive days and since then has never been higher than 95. I thought that might have been some instrument error but Boston recorded their all time high of 104 during that same torrid stretch. -
No it definitely wouldn't be nice. This is only a drought if compared to inflated rainfall averages of the 2000s and 2020s much like a 25 inch snowfall season would be considered a snow drought going by the snowfall averages of that time. Most people dont like rainy summers let alone 10 inches in a month. Summer is tradionally our dry season. This is more normal for Spring or Fall. I dont care about the agricultural cartel either they pump enough toxins into our soil and water and rainfall only makes that worse with toxic runoff. Not to mention the disease carrying bugs that rapidly multiply in wet weather. You can have wet weather in Spring and Fall but summers should be hot and dry which is why our truly hottest summers happened in the 80s and 90s. Thankfully after this el Nino ends so will this wet pattern and we will return to the long term dry pattern that will balance out the inflated rainfall totals of the 2000s and 2010s. And just a reminder water vapor is a much stronger greenhouse gas than carbon dioxide is and traps air pollution and causes breathing problems for many which is why hot and dry weather is so much better for overall health I fully expect next summer to rank with 1966 1983 and 2010 as one of our greatest on record.
-
Enjoy it for the next few months as soon as this demonic el Nino ends so will these excessive and out of season rainfall totals Next summer will be one of our hottest and driest on record I'm going with 1966 1983 and 2010 as my analogs. We are snapping back from the inflated rainfall totals of the past two decades and this is a tiny blip after this year we return to dry.
-
Excessive rainfall is much worse than drought. For multiple reasons. Not only does it increase the populations of disease carrying insects like mosquitoes and ticks it also results in toxic runoff from farms and those pesticides and fertilizer end up in our aquifers. I would never eat anything grown here anyway. Water Vapor is a much more powerful greenhouse gas than carbon dioxide is which is why low humidity dry heat feels so good. The days are hotter but the nights are cooler. Our hottest weather comes from the west not from the south the Bermuda ridge is a humidity pump not a heat pump.
-
The only reason I temporarily returned was to address this. Did you notice the only people who talk about drought are the people who for some reason love rainy summers? Growing up our summers were much hotter and drier than they are now. By the metrics I use our summers have not become significantly hotter since the 1990s. Late 80s through late 90s was peak heat for our region in terms of length of heat waves and number of 100 degree heat. And anyone trying to say heat domes have somehow become stronger or more frequent were not around in 1980, 1983, 1988, 1991, 1993, 1995, 1999, 2002, etc. We dont get heat like that anymore. I'll consider it a hot summer if there are at least two heat waves 7 days or more in length with at least one 100 degree day at a place not called Newark I dont live in Long Island any more I sold that house and moved to the Poconos a few months ago my heating bill was 870 for April and 660 for May. I enjoyed reading that JFK hit 100 three days in a row I wish I was there when it happened it only got to 94 here for 2 days and 90 and 91 on the other days. That was the only time I turned on the air conditioner here. There is no drought of any type I dont care what any color coded map has to say. I have 5 weather stations set up here across 2 acres of land along with stand alone rain gages. There has never been less than 1 inch of rain every week since I moved here. Even if there was who cares summers are supposed to be hot and dry. The rainy weather belongs in spring and fall. PS speaking of heat domes the mother of all heat domes happened in July 2-4 1911 when Mt Oocono hit 98 99 and 103 on consecutive days outside of that they have never been higher than 95. I thought maybe there was an instrument error but I see that Boston had their all time high of 104 during the same heatwave. Mt Pocono is at an elevation of 1915 feet and north of i-80 while I'm at about 1650 feet and south of I-80 so I'm about 1 to 2 degrees warmer than they are so I can't imagine what a 1911 like heatwave would be like here. I think it's interesting that both Mt Pocono and Newark maxed out at 103 during that heatwave though. That was before the concrete jungle existed. Even if we buy the Central Park bad siting excuse the fact remains that neither LGA nor JFK have exceeded the 107 and 104 all time records from 1966. Back to the "drought" issue if we go by what kind of rainfall we are used to there is no drought. We have had inflated rainfall totals since after 2002 so judging rainfall totals based on those inflated totals is like pretending the inflated snowfall averages of the 2000s and 2010s was somehow our new normal. This rainy pattern is a temporary el Nino blip I predicted a regression back to drier summers 2 years ago and I will predict that next summer will be one of our hottest with multiple 100 degree heatwaves right to the coast analogs 1966 1983 2010. If it wasn't for that darned smoke JFK would have had a 4th 100 degree day on July 15. Where's Agent Orange when you need it that would end that smoke problem quickly One other thing it better NOT be cloudy for the Perseid meteor shower it should be the best in years with no light pollution from the moon. I bought a Sigma 16mm f/1.4 lens to photograph it from my bedroom balcony.
-
When you see a ton of blue dots for svr winds reports in an area that first day and no red dots for tors, always go back and check the SPC reports for that day for several days after the event. Sometimes lots of red dots show up from post-storm surveys. In the SEUS for big winter/spring QLCS events w/ many winds reports. I've seen more than a dozen tors show up eventually as post-storm surveys are done.
-

2026-2027 Super El Nino
PhiEaglesfan712 replied to Stormchaserchuck1's topic in Weather Forecasting and Discussion
Interesting to note that each of these events were immediately followed by a strong la nina (1998-2000 and 88-89). -
 DCA _ NYC _ BOS _ ORD _ ATL _ IAH _ DEN _ PHX _ SEA 0.3 0.3 0.8 1.5 2.0 0.5 2.0 2.0 1.6
 -

2026-2027 Super El Nino
so_whats_happening replied to Stormchaserchuck1's topic in Weather Forecasting and Discussion
I would like to add more context I guess, it is nice to see some actual recurves still taking place even in a weakened state of a storm the energy injection is still important. I do wonder though if this means yet again an overall weaker Aleutian low potential for winter, time will tell of course.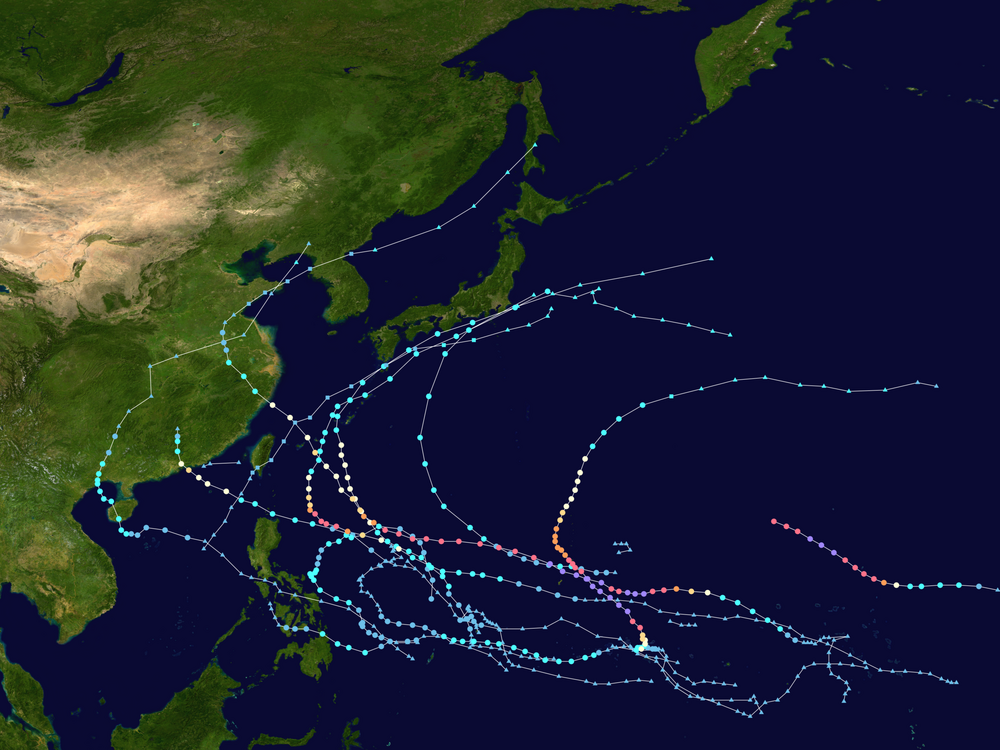
-
2026-2027 Super El Nino
so_whats_happening replied to Stormchaserchuck1's topic in Weather Forecasting and Discussion
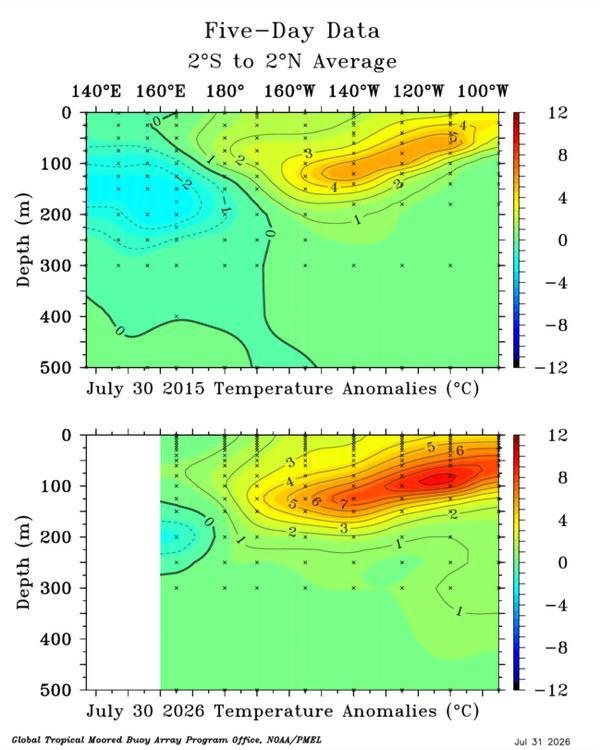
Now it will be interesting to see what happens from here. Looking back at 1997-98 we see there was a double peak for 180-100W OHC. 2015 we also saw this and 2023 again both years did have overall less OHC than 97 and this current year but both had a double peak, 1982 did not just had one continuous upward movement. My own thoughts would suggest maybe a September peak in OHC then a quick decline as we head into winter. The only problem with this is the lack of - anomalies in the WPAC subsurface we have yet to really see develop compared to other years with a similar temp profile. So as 180-100W may die out the overall 130E-80W and even just 160E-80W still stay relatively warm with those stronger negative anomalies not showing up leading to a more basin wide setup as we get to winter. Just thoughts floating around as we typically see the Nino events die west to east from an OHC stand point. https://www.cpc.ncep.noaa.gov/products/analysis_monitoring/ocean/index/heat_content_index.txt YR MON 130E-80W 160E-80W 180W-100W 1997 1 .54 .49 .56 1997 2 .84 .85 1.00 1997 3 1.09 1.26 1.17 1997 4 1.49 1.87 2.17 1997 5 1.38 1.82 2.01 1997 6 1.55 2.01 2.25 1997 7 1.34 1.77 1.83 1997 8 1.07 1.50 1.79 1997 9 1.25 1.85 2.38 1997 10 1.35 2.05 2.56 1997 11 1.19 1.94 2.30 1997 12 .56 1.15 1.02 1998 1 -.24 .16 .00 1998 2 -.66 -.35 -.38 It is like if 1997 and 2015 had a baby. Shame we are not getting the western edge of TAO as those buoys are being worked on.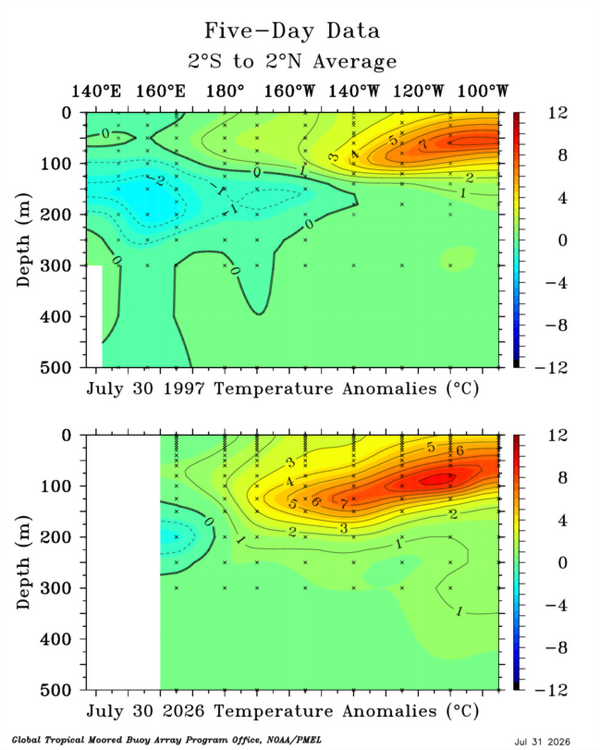
-
97-98 had negative heights in Alaska. CANSIPS has +heights there. ECMWF I think is completely different, showing +EPO for the Winter.
-

2026-2027 Super El Nino
Stormchaserchuck1 replied to Stormchaserchuck1's topic in Weather Forecasting and Discussion
Why does the CANSIPS have the El Nino continue to be centered so far west? That's not the way it's developing or is now. +6c in Nino 3.4 is pretty extreme. Nino 1+2 is currently twice as high as Nino 3.4. -

E PA/NJ/DE Summer 2026 Obs/Discussion
nesussxwx1 replied to PhiEaglesfan712's topic in Philadelphia Region
Looks like a chance of scattered thunderstorms Sunday evening - early Monday. Mesos are picking it up. Another chance at some severe weather. Been an active summer for sure. -
And there ya go...not sure how much that happened in 97-98, but gotta imagine it was a factor?
-
Generic Viagra for sale [url=https://medmennews.com/#]viagra without prescription[/url] over the counter sildenafil
-
@dmillz25 @donsutherland1 @Rjay Just a reminder
-
DCA _ NYC _ BOS _ ORD _ ATL _ IAH _ DEN _ PHX _ SEA +1.2 +1 +.8 +.7 -.3 +.7 +1.6 +1.6 +1.7
-
@Spartmanentetaining read today for sure. After a long stretch of boring weather it’s nice to have an active forecast discussion. Joe Strus wrote the afternoon discussion, he seems to be winter weenie.
-
CANSIPS has the El Nino much further west than it's developing.