All Activity
- Past hour
-

November 2025 general discussions and probable topic derailings ...
WinterWolf replied to Typhoon Tip's topic in New England
Good for those that got some action…just a little light rain here last night, but I’m fine with that…all drying up now, and can keep the truck clean for a while longer. -

Central PA Fall Discussions and Obs
Mount Joy Snowman replied to ChescoWx's topic in Upstate New York/Pennsylvania
Low of 46. Solid days ahead. -
 Yeah no one had or mentioned chances of thunder, hail, win damage or Tors. No one no model
 -
Fox are there as well. Deer have been spotted on the North Shore Tower golf course.
-

Fall/Winter Banter - Football, Basketball, Snowball?
John1122 replied to John1122's topic in Tennessee Valley
Clown map season is beginning. Hopefully all our winter regulars are able to come out again this year. @Holston_River_Rambler @PowellVolz @Stovepipe @Reb @TellicoWx @Silas Lang @tnweathernut @bearman @bearman @BlunderStorm @AMZ8990 @BNAwx @Coach B @fountainguy97 @Greyhound @kvskelton @Knoxtron @Kentucky @Uncle Nasty @Vol Man @Wurbus @Wintersnow888 @8283 El Nino Baby @BuCoVaWx @Chattownsnow @Scottie16 @Shocker0 @McMinnWx @WinterWonderland @Kasper I'm sure I missed some of you, and some not mentioned are around already. -
From 2019 to 2025 with the lack of benchmark storm tracks ISP has only averaged 1.9” more than NYC with record 7 year lows for both sites. Since neither site does well with Great Lakes cutters, I-78 huggers, and suppressed Southern Stream storm tracks. During 2010 to 2019 ISP averaged 8.5” more than NYC since it was closer to all the benchmark storm tracks. It was the only 9 year period that ISP averaged near 50” a season. It was the golden age for benchmark KU storm tracks. From 1994 to 2009 ISP and NYC were also more evenly balanced around 28.0” a year since it was colder and we still had a good amount of benchmark storm tracks in the mix. Monthly Total Snowfall for ISLIP-LI MACARTHUR AP, NY Click column heading to sort ascending, click again to sort descending. Mean T 0.6 2.1 6.0 7.1 1.0 T 16.8 2024-2025 0.0 0.0 2.1 2.7 6.9 0.0 0.0 11.7 2023-2024 0.0 T T 3.1 7.8 0.0 0.0 10.9 2022-2023 0.0 0.0 0.4 T 3.0 1.6 0.0 5.0 2021-2022 0.0 T 0.3 31.8 3.3 1.6 0.0 37.0 2020-2021 T 0.0 7.5 1.1 24.9 T T 33.5 2019-2020 0.0 0.1 4.2 2.5 0.0 T T 6.8 2018-2019 0.0 4.3 T 0.9 3.5 4.1 T 12.8 Monthly Total Snowfall for NY CITY CENTRAL PARK, NY Click column heading to sort ascending, click again to sort descending. Mean 0.0 0.9 2.3 3.7 6.4 1.6 T 14.9 2024-2025 0.0 0.0 2.8 3.0 7.1 0.0 0.0 12.9 2023-2024 0.0 T T 2.3 5.2 T 0.0 7.5 2022-2023 0.0 0.0 T T 2.2 0.1 0.0 2.3 2021-2022 0.0 T 0.2 15.3 2.0 0.4 0.0 17.9 2020-2021 0.0 0.0 10.5 2.1 26.0 T 0.0 38.6 2019-2020 0.0 0.0 2.5 2.3 T T T 4.8 2018-2019 0.0 6.4 T 1.1 2.6 10.4 0.0 20.5 Monthly Total Snowfall for ISLIP-LI MACARTHUR AP, NY Click column heading to sort ascending, click again to sort descending. Mean 0.0 0.5 6.5 18.2 13.9 8.6 0.6 48.3 2017-2018 0.0 T 6.0 22.0 1.4 31.9 4.6 65.9 2016-2017 T T 3.2 14.0 14.7 7.4 T 39.3 2015-2016 0.0 0.0 T 24.8 13.2 3.2 0.2 41.4 2014-2015 0.0 T 0.4 30.2 13.4 19.7 0.0 63.7 2013-2014 0.0 0.3 8.1 25.2 24.5 5.4 0.2 63.7 2012-2013 0.0 4.2 0.6 3.3 31.4 7.4 0.0 46.9 2011-2012 0.3 0.0 T 3.8 0.6 T 0.0 4.7 2010-2011 0.0 T 14.9 34.4 3.9 2.1 T 55.3 2009-2010 0.0 0.0 25.3 6.4 21.7 0.4 0.0 53.8 Monthly Total Snowfall for NY CITY CENTRAL PARK, NY Click column heading to sort ascending, click again to sort descending. Mean 0.3 0.5 5.9 14.2 12.8 5.5 0.6 39.8 2017-2018 0.0 T 7.7 11.2 4.9 11.6 5.5 40.9 2016-2017 0.0 T 3.2 7.9 9.4 9.7 0.0 30.2 2015-2016 0.0 0.0 T 27.9 4.0 0.9 T 32.8 2014-2015 0.0 0.2 1.0 16.9 13.6 18.6 0.0 50.3 2013-2014 0.0 T 8.6 19.7 29.0 0.1 T 57.4 2012-2013 0.0 4.7 0.4 1.5 12.2 7.3 0.0 26.1 2011-2012 2.9 0.0 0.0 4.3 0.2 0.0 0.0 7.4 2010-2011 0.0 T 20.1 36.0 4.8 1.0 T 61.9 2009-2010 0.0 0.0 12.4 2.1 36.9 T 0.0 51.4 Monthly Total Snowfall for ISLIP-LI MACARTHUR AP, NY Click column heading to sort ascending, click again to sort descending. Mean T 0.3 5.8 7.1 8.7 5.3 1.0 28.3 2008-2009 0.0 T 10.4 8.9 3.3 13.6 T 36.2 2007-2008 0.0 0.0 2.6 0.8 7.3 T 0.0 10.7 2006-2007 0.0 T 0.0 1.0 4.2 3.8 T 9.0 2005-2006 0.0 0.5 7.6 4.7 19.9 3.2 0.1 36.0 2004-2005 0.0 T 7.0 21.5 17.0 13.3 0.0 58.8 2003-2004 0.0 0.0 15.5 19.1 1.1 5.7 0.0 41.4 2002-2003 0.0 1.0 16.0 2.6 26.3 3.7 5.0 54.6 2001-2002 0.0 0.0 0.0 3.7 T T 0.0 3.7 2000-2001 T 0.0 10.8 9.2 8.6 10.3 T 38.9 1999-2000 0.0 T 0.4 5.8 2.6 0.2 T 9.0 1998-1999 0.0 0.0 3.0 4.5 2.8 9.1 T 19.4 1997-1998 0.0 T 1.0 T T 1.6 T 2.6 1996-1997 0.0 T 1.2 3.3 2.2 3.7 2.0 12.4 1995-1996 0.0 3.0 13.3 20.2 19.0 12.0 9.6 77.1 1994-1995 0.0 T T T 5.1 T 0.0 5.1 1993-1994 0.0 T 3.3 8.8 20.0 5.0 0.0 37.1 Monthly Total Snowfall for NY CITY CENTRAL PARK, NY Click column heading to sort ascending, click again to sort descending. Mean T 0.2 5.4 7.5 10.4 4.2 0.4 28.0 2008-2009 0.0 T 6.0 9.0 4.3 8.3 T 27.6 2007-2008 0.0 T 2.9 T 9.0 T 0.0 11.9 2006-2007 0.0 0.0 0.0 2.6 3.8 6.0 T 12.4 2005-2006 0.0 T 9.7 2.0 26.9 1.3 0.1 40.0 2004-2005 0.0 T 3.0 15.3 15.8 6.9 0.0 41.0 2003-2004 0.0 0.0 19.8 17.3 0.7 4.8 0.0 42.6 2002-2003 T T 11.0 4.7 26.1 3.5 4.0 49.3 2001-2002 0.0 0.0 T 3.5 T T T 3.5 2000-2001 T 0.0 13.4 8.3 9.5 3.8 0.0 35.0 1999-2000 0.0 0.0 T 9.5 5.2 0.4 1.2 16.3 1998-1999 0.0 0.0 2.0 4.5 1.7 4.5 0.0 12.7 1997-1998 0.0 T T 0.5 0.0 5.0 0.0 5.5 1996-1997 0.0 0.1 T 4.4 3.8 1.7 T 10.0 1995-1996 0.0 2.9 11.5 26.1 21.2 13.2 0.7 75.6 1994-1995 0.0 T T 0.2 11.6 T T 11.8 1993-1994 0.0 T 6.9 12.0 26.4 8.1 0.0 53.4
-
 Had some rumbles last night.
 -
I also saw a fox in eastern Queens several months ago. It ran right in front of my car.
-
 I love those little surprise events that catch most off guard.
 -

November 2025 general discussions and probable topic derailings ...
kdxken replied to Typhoon Tip's topic in New England
-

November 2025 general discussions and probable topic derailings ...
ineedsnow replied to Typhoon Tip's topic in New England
When I was checking the radar last night it looked like a bit of rotation near Spencer also.. But I thought there's no way.. that was before the line really maxed out though -

Central PA Fall Discussions and Obs
mahantango#1 replied to ChescoWx's topic in Upstate New York/Pennsylvania
-
Central PA Fall Discussions and Obs
mahantango#1 replied to ChescoWx's topic in Upstate New York/Pennsylvania
Since it looks like theres not to much to get excited about put your mind at ease and take one of these - Today
-

November 2025 general discussions and probable topic derailings ...
CoastalWx replied to Typhoon Tip's topic in New England
Wow decent damage on south coast where line maxed out. -
November 2025 general discussions and probable topic derailings ...
CoastalWx replied to Typhoon Tip's topic in New England
Looks like there may have been at least one unwarned tornado near Somerset MA. Possible one near Rehoboth. -
Let’s get 65-75 mph . Needed
-
All the local channels and a few retired weather guts on Twitter youtube but they can't even predict what's going to happen two days from now you know so it's a toss up
-
November 2025 general discussions and probable topic derailings ...
CoastalWx replied to Typhoon Tip's topic in New England
Had some hail and thunder to my south last evening along with some strong winds at fropa. Looks like gusts near 50 today. Still looks like we could have a heck of a 1-3hr period after midnight tomorrow night. Strong LLJ pivots through with rapid pressure rises. Highest potential eastern areas. -
November 2025 general discussions and probable topic derailings ...
kdxken replied to Typhoon Tip's topic in New England
Hold on to your hat. Both Worcester and Boston gusting over 30. Hartford close. -
Oh Canada!
-
Coyotes are in Queens, Nassau and Suffolk. They are growing in numbers
-
There used to be a 60-ft tall red maple in my neighbor's backyard. It was too big for our small lots, but it was a beautiful, brilliant red color in fall. The 2020 derecho destroyed it. There is a still a young Fall Fiesta sugar maple in the front yard. So far, the tree has not had good color, although this year it is definitely better.
-

Texas 2025 Discussion/Observations
Stx_Thunder replied to Stx_Thunder's topic in Central/Western States
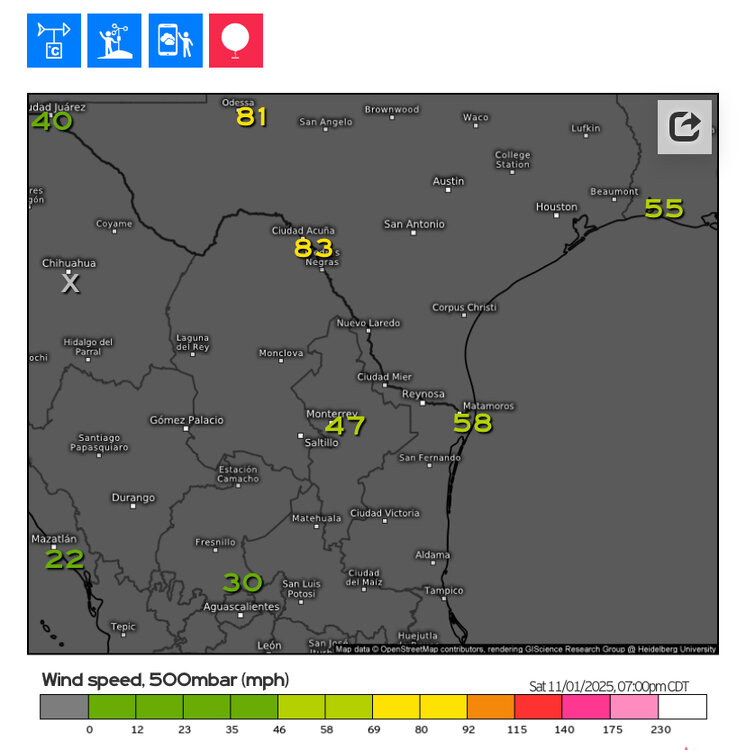
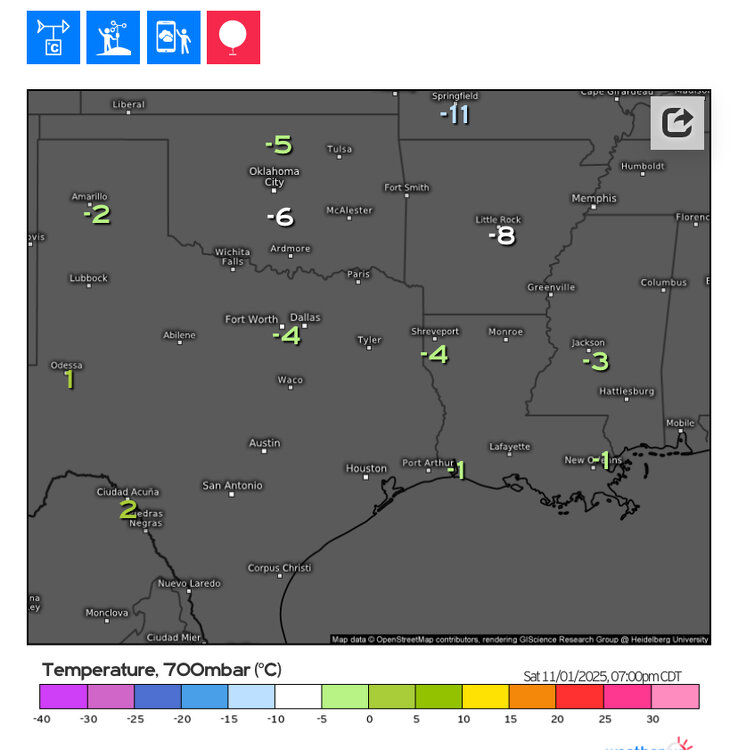
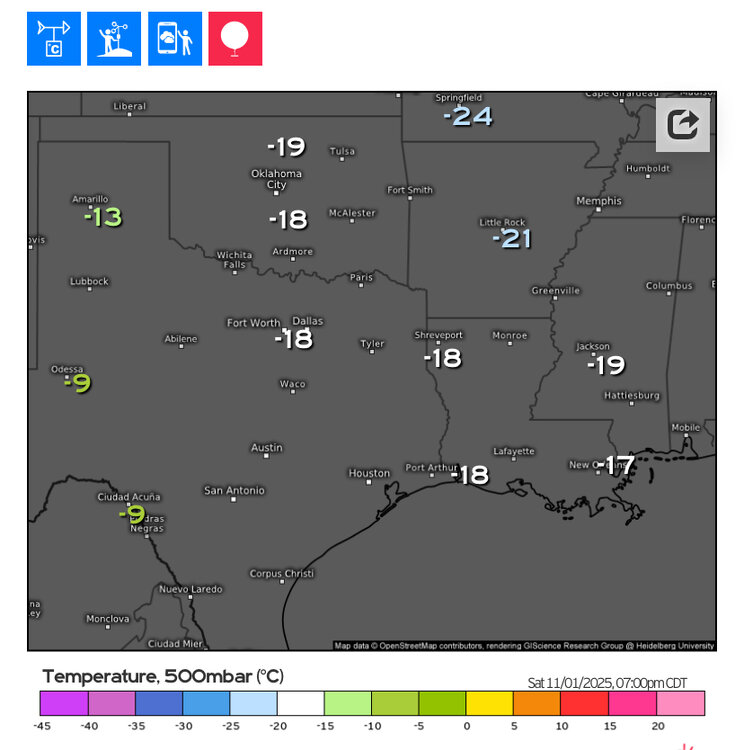
3 in. hailstones reported Saturday evening in the Coastal Bend area. Max size could've definitely been slightly larger given all the abnormally far south colder mid-level air & dynamics in place (for the time of year), near the region that evening.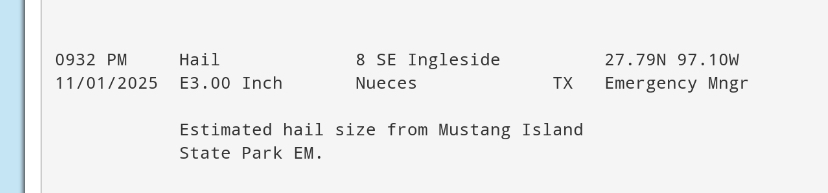
-
It seems like we have more deer than people here. I literally saw dozens today, mostly at Sunken Meadow, but a couple in my back yard. A new arrival here over the past 2 or 3 years has been skunks. Coyotes are next.
-
I've been a total deadbeat on the snow maps. Hopefully I'll get back on that project soon. I don't have my stuff right in front of me, but the 30-year average here is between 36 and 37". I think BNL is similar. Their 78-year average is 32": https://www.bnl.gov/weather/4cast/monthlysnowfall.htm