All Activity
- Past hour
-

Summer 2026 Med/Long Range Discussion
SchaumburgStormer replied to Brian D's topic in Lakes/Ohio Valley
Yep, if it’s going to be dry and boring, may as well be 80 and dry/boring -

2026-2027 Strong/Super El Nino
bluewave replied to Stormchaserchuck1's topic in Weather Forecasting and Discussion
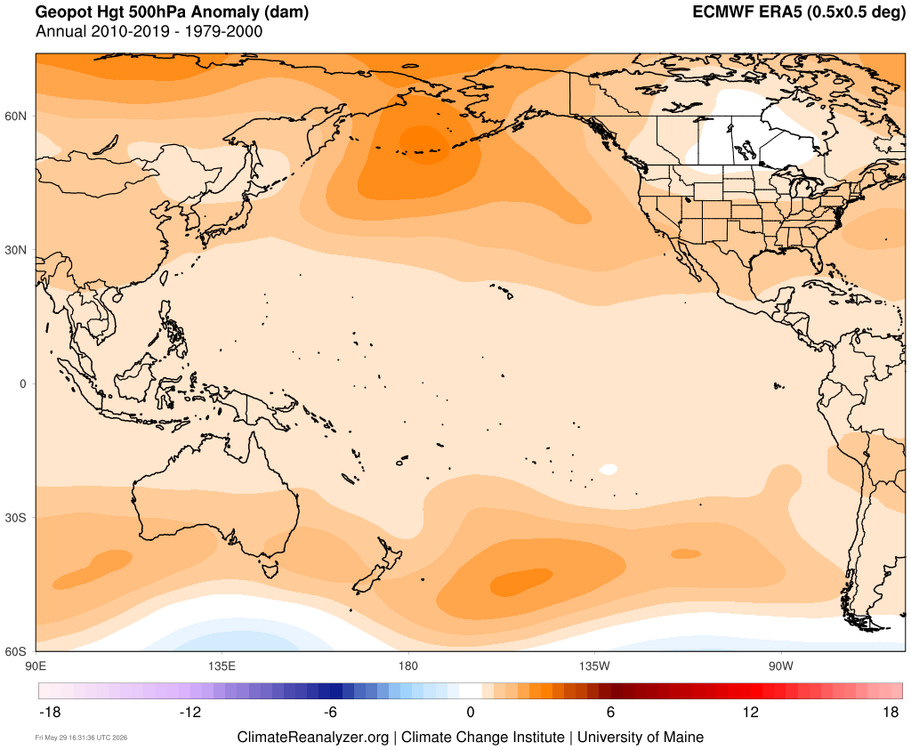
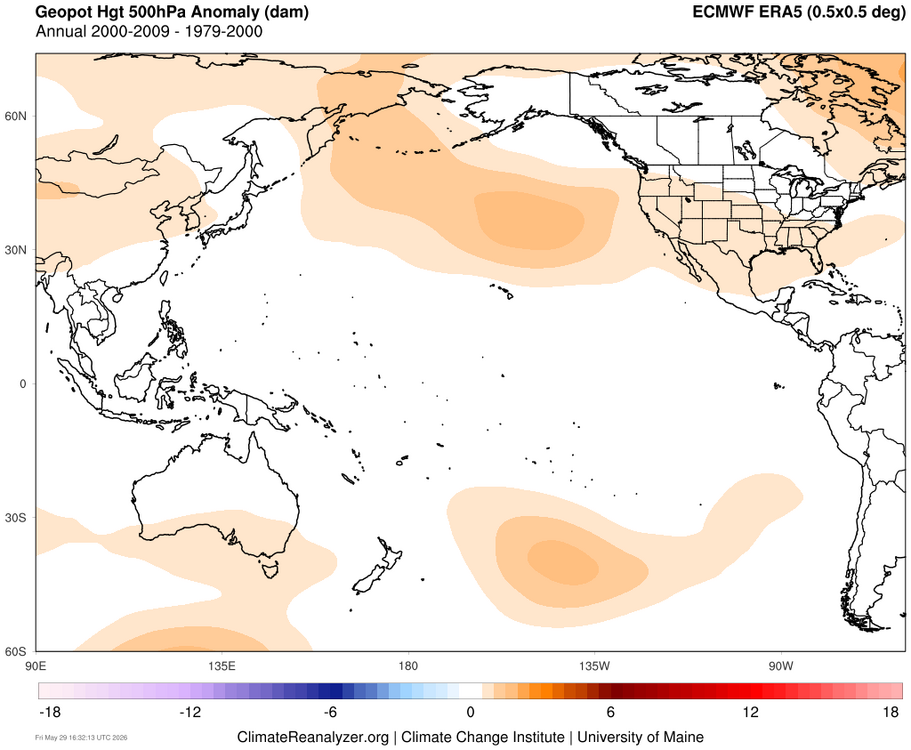
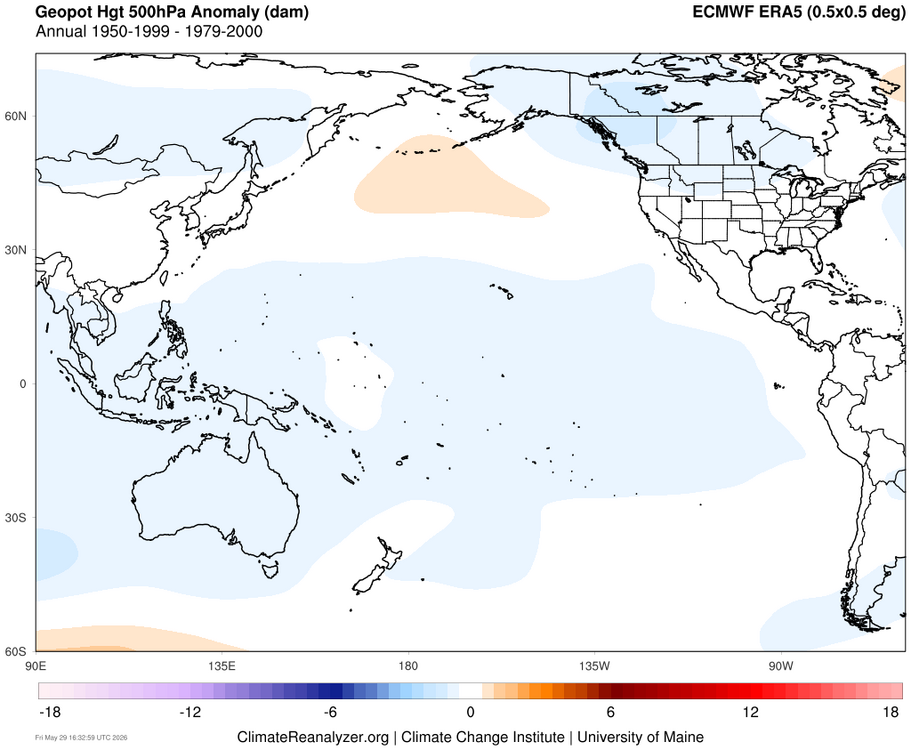
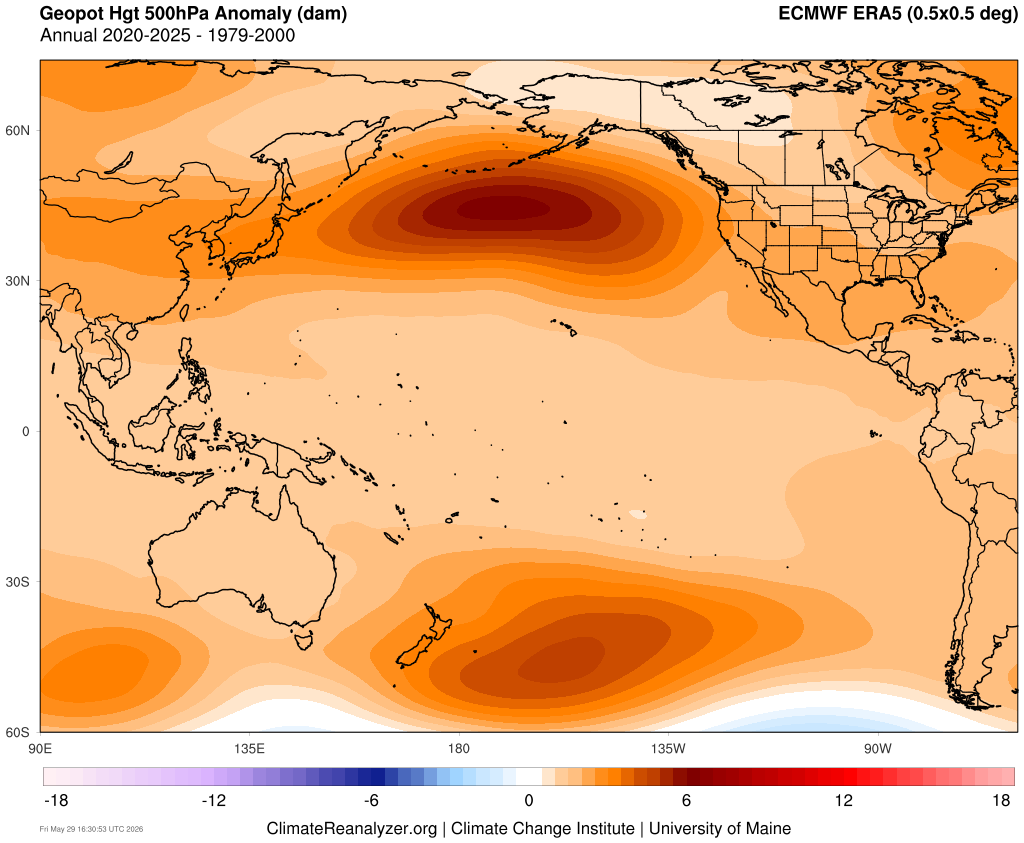
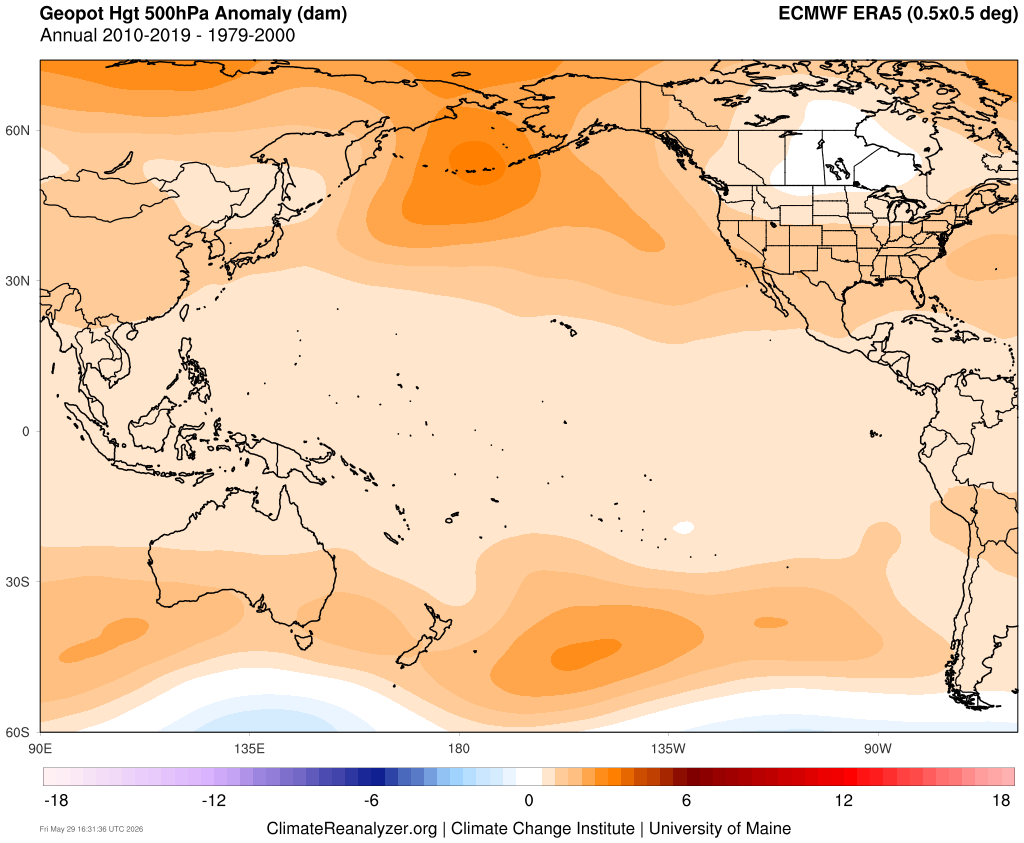
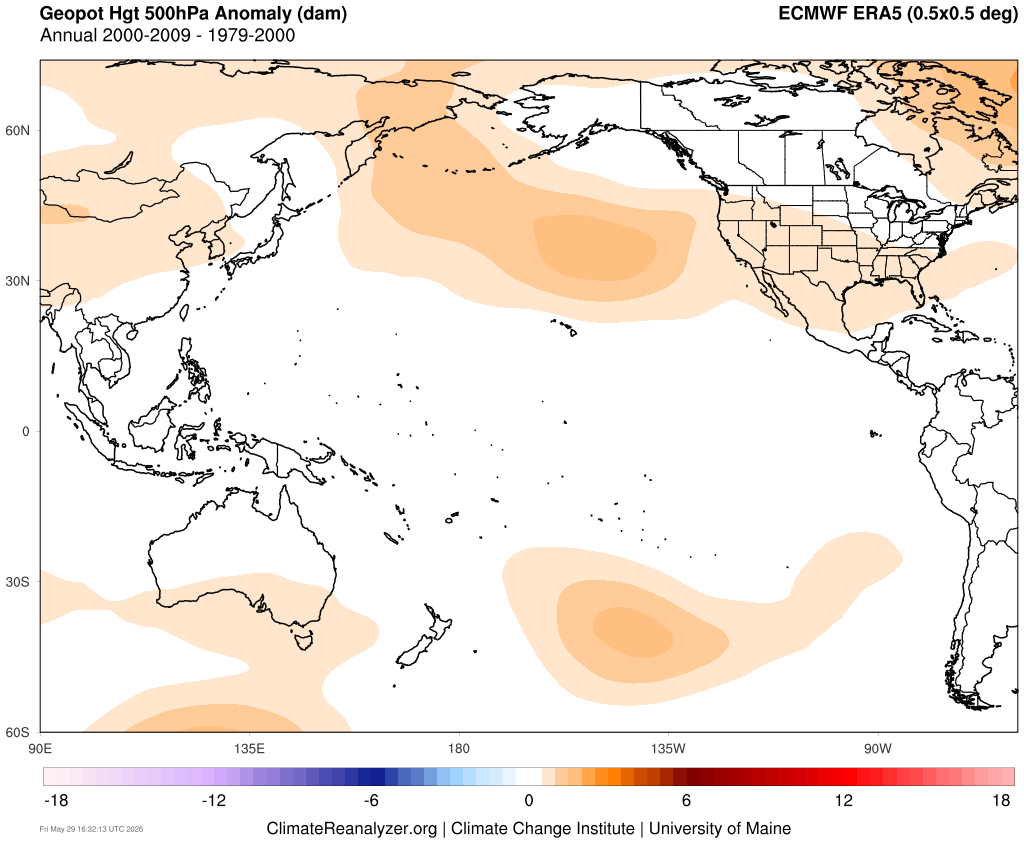
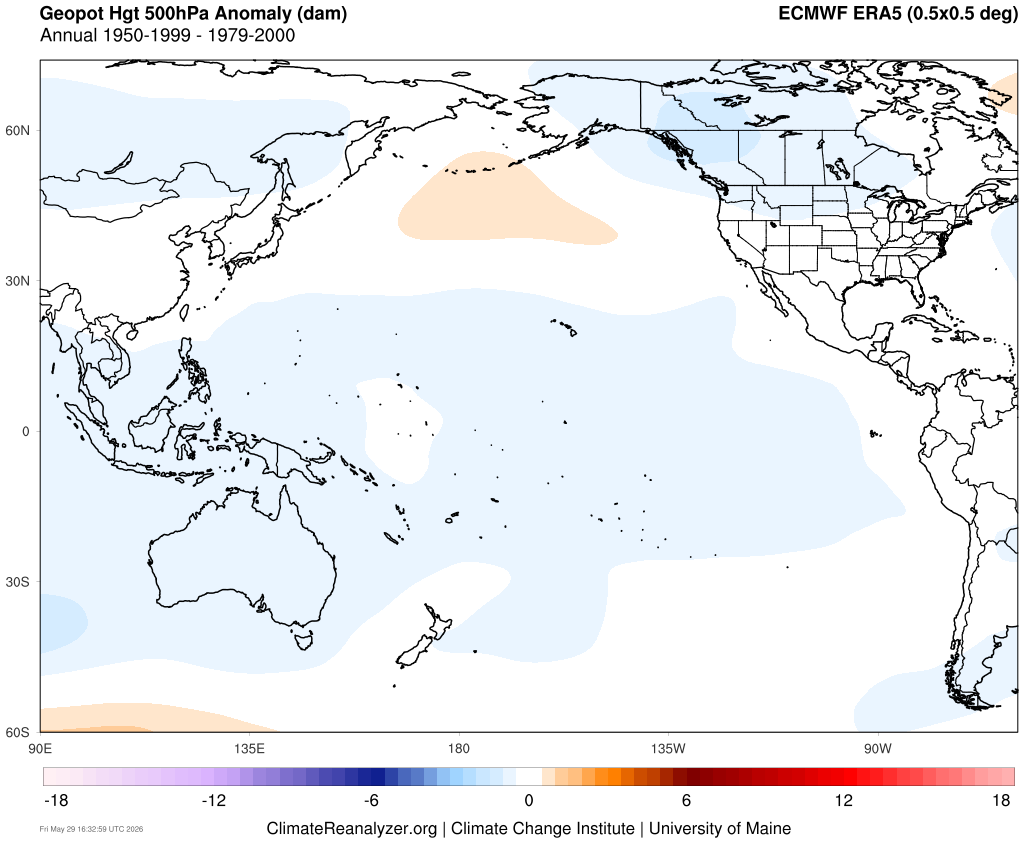
I think that it could also go beyond the RONI in that the 500 mb ridges are expanding in the mid-latitudes outside the tropical oceans which RONI measures. The 500 mb ridge across the North Pacific from east of Japan to south of the Aleutians has been unprecedented during the 2020s. Also note the slightly weaker mirroring of the pattern in the South Pacific to the east of New Zealand. So it’s been warming the SSTs underneath the ridge causing the -PDO to remain negative. In the old days ,the -PDO was more a function of colder SSTs off of California rather than the extensive warm pool from east of Japan to south of the Aleutians that we have today.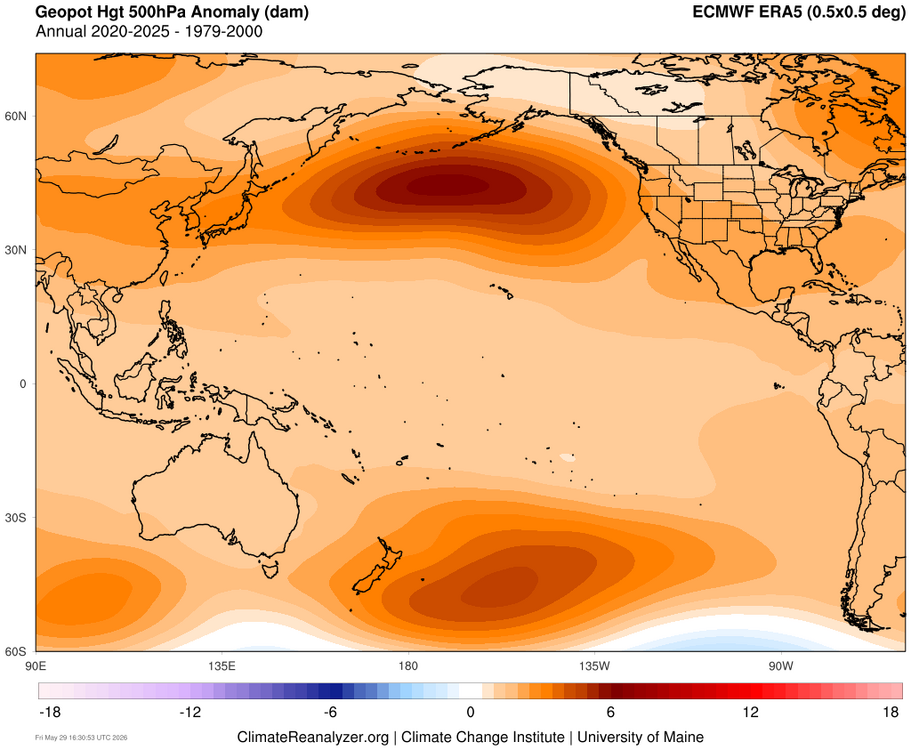
-

2026-2027 Strong/Super El Nino
so_whats_happening replied to Stormchaserchuck1's topic in Weather Forecasting and Discussion
.thumb.gif.1b9b32772878231a11b7b4b60eae9bf4.gif)
-
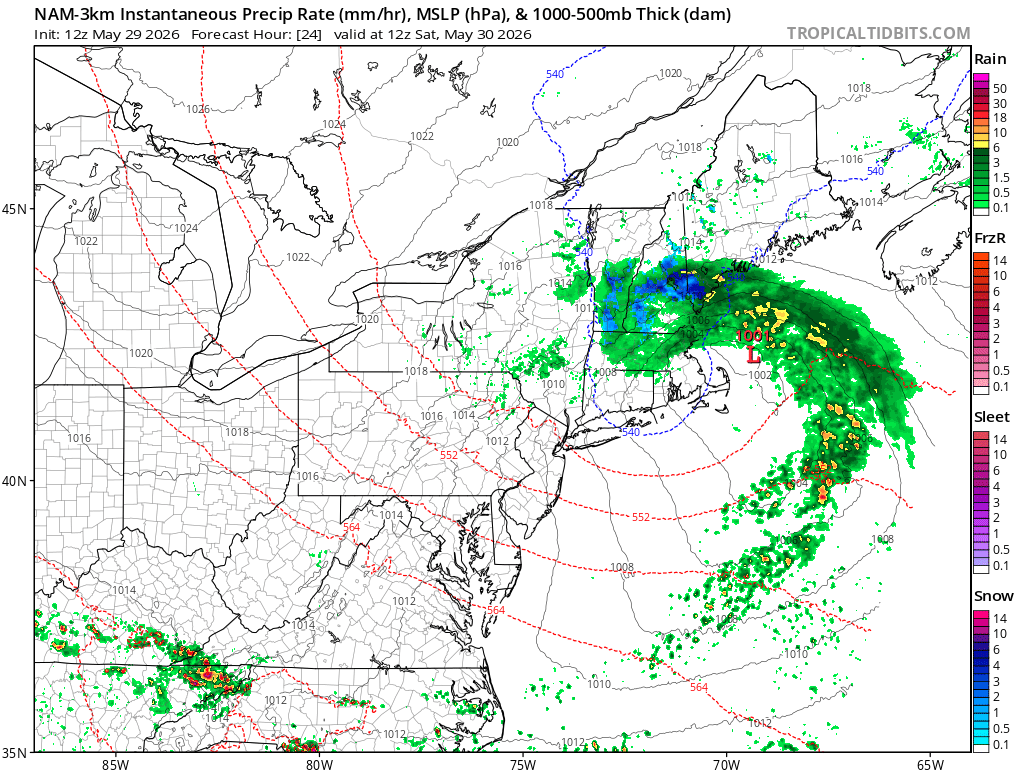
So what does that look like in terms of surface winds? I'm in central MA and trying to figure out if I need to protect the veggie garden plants.
-
Dry and partly cloudy here tomorrow while it pounds rain S Wey to Pope
-
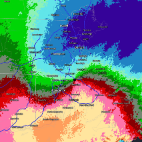
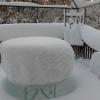
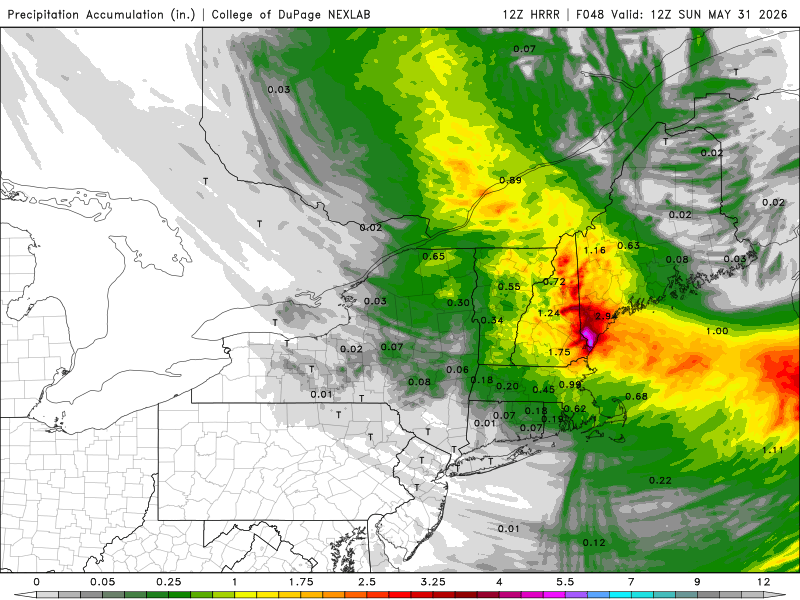
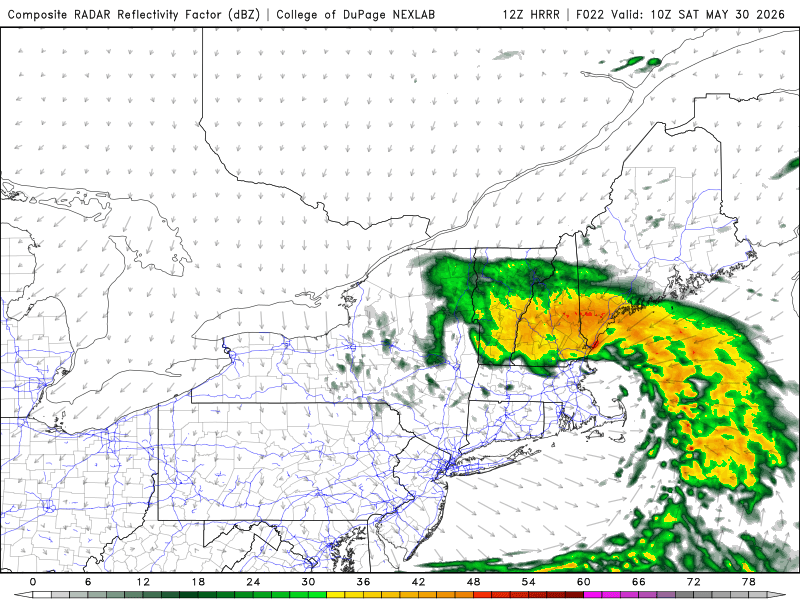
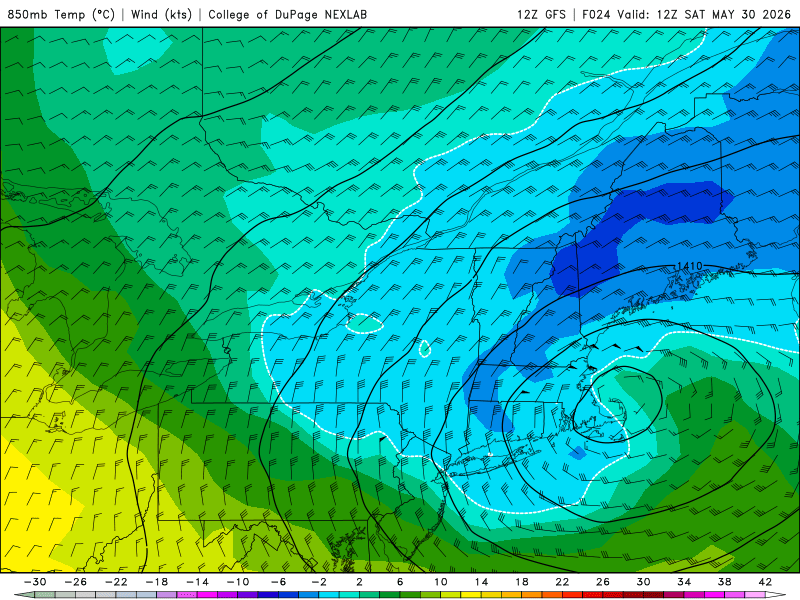
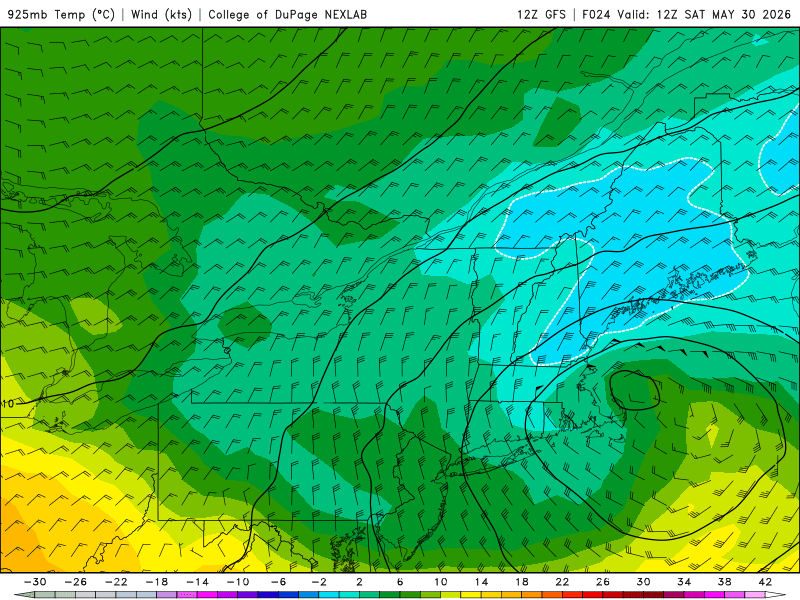
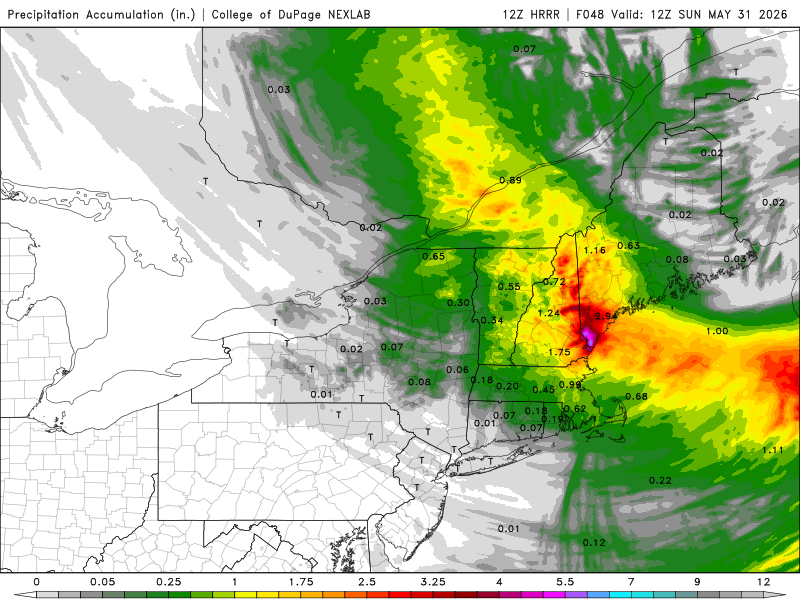
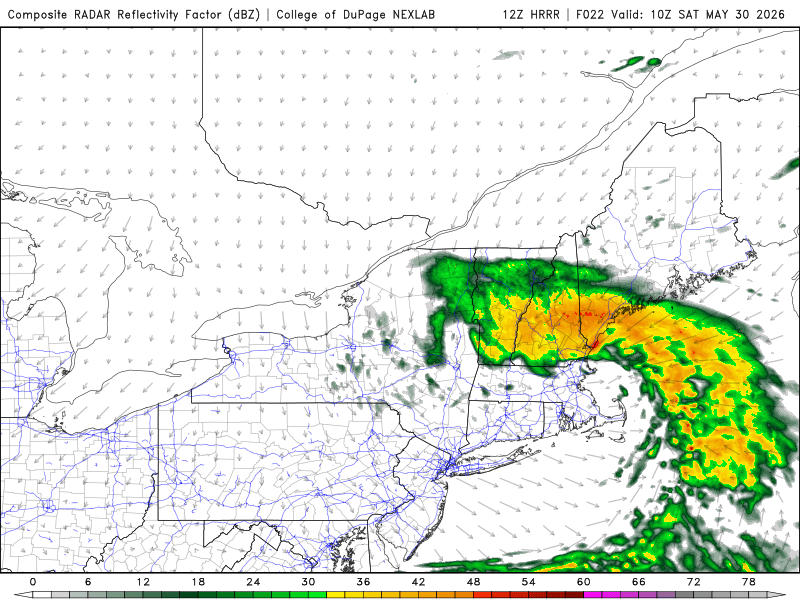
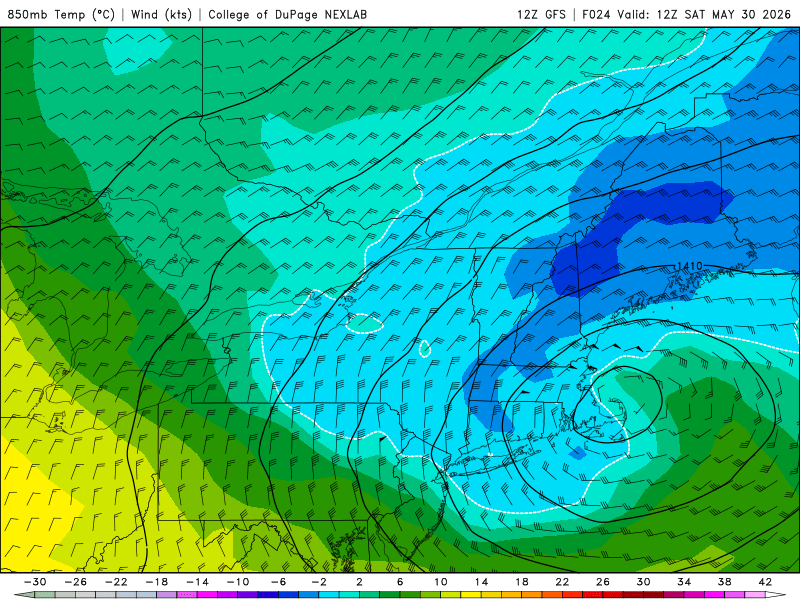
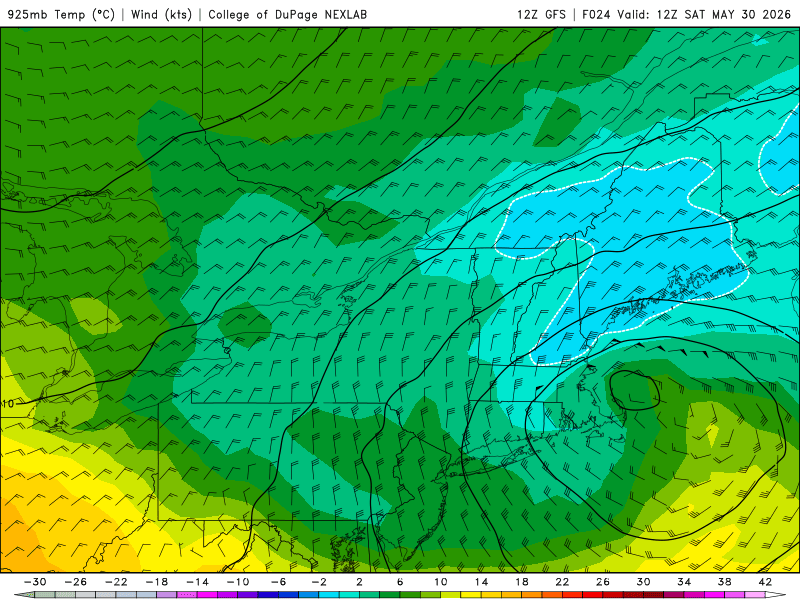
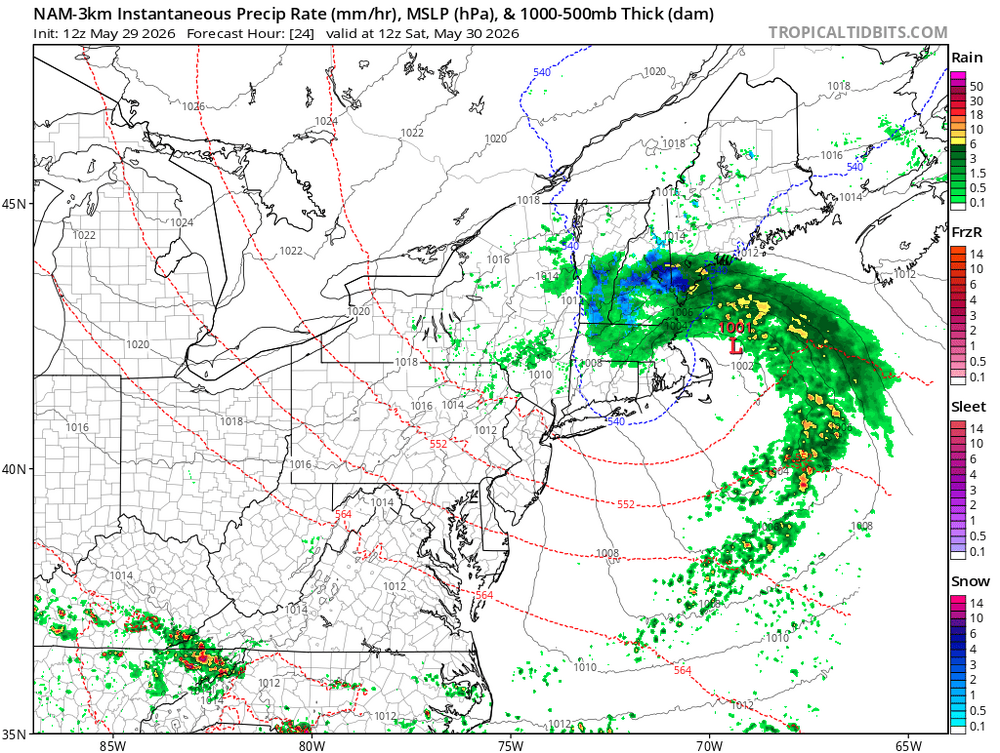
Also posted on the thread just made for this upcoming storm. Interesting what the 12z HRRR shows. It has a very high QPF max of 5.77" over SW ME. Other models do not show this, but sfc low is a tight SUCKA and I wonder about mesoscale factors. SPC has general tstms outlooked and convection stirs things up better aloft. This results in stronger downdrafts to mix down the cold air aloft better. 850 and 925 mb temps are cold enough by 12z in this area and that kind of pcpn intensity? The ante is very high here! Can you imagine on the coast w/ super paste and G50kt? I'd love to be at Hampton Beach Sat AM! The reason the HRRR shows this big pcpn max in SW ME is b/c the area is at the pivot point of the N side of the comma head, so they cash in w/ a heavy pcpn area nearly stationary in a relative sense. Such a scenario is not unreasonable and the global models would not pick up on something like this. So we may have two pcpn maxes, one over the White Mtns and another coastal ME/NH. Look at the HRRR sim radar late this eve/very early Sat over NH/VT, TRW+ FQT LTGICCG surprise before the S+??? This is about as good as it gets for the uncertainty factor for big S+ and "PHUN 'N GAMES!" Scott should be impressed! Could be a truly exceptional event. Big snowfall like this so late (higher and lower elevations)? You have to go back to the 19th century (1816 and 1842 in June) for anything later. MWN had 24.9" in the May 25-26, 1967 event and they could exceed that for the May single storm record.
-
Interesting what the 12z HRRR shows. It has a very high QPF max of 5.77" over SW ME. Other models do not show this, but sfc low is a tight SUCKA and I wonder about mesoscale factors. SPC has general tstms outlooked and convection stirs things up better aloft. This results in stronger downdrafts to mix down the cold air aloft better. 850 and 925 mb temps are cold enough by 12z in this area and that kind of pcpn intensity? The ante is very high here! Can you imagine on the coast w/ super paste and G50kt? I'd love to be at Hampton Beach Sat AM! The reason the HRRR shows this big pcpn max in SW ME is b/c the area is at the pivot point of the N side of the comma head, so they cash in w/ a heavy pcpn area nearly stationary in a relative sense. Such a scenario is not unreasonable and the global models would not pick up on something like this. So we may have two pcpn maxes, one over the White Mtns and another coastal ME/NH. Look at the HRRR sim radar late this eve/very early Sat over NH/VT, TRW+ FQT LTGICCG surprise before the S+??? This is about as good as it gets for the uncertainty factor for big S+ and "PHUN 'N GAMES!" Scott should be impressed! Could be a truly exceptional event. Big snowfall like this so late (higher and lower elevations)? You have to go back to the 19th century (1816 and 1842 in June) for anything later. MWN had 24.9" in the May 25-26, 1967 event and they could exceed that for the May single storm record.
-

Central PA Spring 2026 Discussion/Obs Thread
Itstrainingtime replied to Voyager's topic in Upstate New York/Pennsylvania
Just went out for lunch. I don't see how anyone could find fault with the weather today. It's just simply stellar. -
 Its a sharp cutoff for sure. Pittsburgh is at or above normal precip going back the past 12 months and YTD while areas as close as Western MD (actually on the southernmost edge of the PIT MSA) is solidly BN for the same period of time. The headwaters of the N BranchPotomac rolling out of Garrett Co are at the highest after the past week of rain as any time in at least the past 12 months.
 -
2026-2027 Strong/Super El Nino
40/70 Benchmark replied to Stormchaserchuck1's topic in Weather Forecasting and Discussion
It is. The Multivariate ENSO Index (MEI.v2) is a comprehensive climate index used to measure the intensity and phase of the El Niño-Southern Oscillation (ENSO). It improves upon single-variable indices by combining five oceanic and atmospheric variables across the tropical Pacific: sea surface temperatures, sea-level pressure, surface winds, and outgoing longwave radiation - Today
-
2026-2027 Strong/Super El Nino
40/70 Benchmark replied to Stormchaserchuck1's topic in Weather Forecasting and Discussion
Yea, air pressure is an element of the MEI, I believe. -

2026-2027 Strong/Super El Nino
GaWx replied to Stormchaserchuck1's topic in Weather Forecasting and Discussion
Besides the MEI, I feel that the SOI (which may be part of the MEI…Is it?) remains a good measure of the phase and strength of ENSO because it is a calculation based on SLP differences between two points thousands of miles apart and thus doesn’t seem to be influenced by CC. In essence a relative SOI is likely not needed. Of course, because it is so volatile and subject to day to day randomness, it’s best looked at in 30+ day averages. Then again, if, say avg. Australian SLPs have been affected by CV differently from how Tahiti SLPs have been affected by CC, then even SOIs would need an adjustment. Other opinions? -
2026-2027 Strong/Super El Nino
40/70 Benchmark replied to Stormchaserchuck1's topic in Weather Forecasting and Discussion
This is why I feel we want a high RONI during an El Nino event....the RONI represents a spectrum, or continuum if you will, of the ability of warm ENSO to modulate the north Pacific versus the baseline trend that is more reflective of CC, which is cool ENSO like. I think folks obfuscate this with the MEI, which simply measures the intensity of the warm ENSO coupling. RONI is not so much about the intensity of the coupling, but the war waged between ENSO and competing hemispheric forces. -
Hey! A thread might be fun
-
Figured we could have a thread about this as Vortex69 mentioned. Some good winds, rain for some... maybe even some flakes. NH mountains could grab a few inches
-
2026-2027 Strong/Super El Nino
40/70 Benchmark replied to Stormchaserchuck1's topic in Weather Forecasting and Discussion
Not that it is going to flip on a dime, but the last -AMO cycle coincided with the negative portion of the multidecadal NAO cycle in the 60s. I think we are more likely to see a modified version of that (CC) around and after the solar min early next decade. This season should be decidedly positive. -
another boring beautiful day the california climo really does get old quick

-

Summer 2026 Med/Long Range Discussion
TheClimateChanger replied to Brian D's topic in Lakes/Ohio Valley
-
 In the nicest way this is the mid atl forum, so I’m sure south central PA has a different weather experience the past few months. For 90% of us we have not had such luck.
 -

Central PA Spring 2026 Discussion/Obs Thread
Voyager replied to Voyager's topic in Upstate New York/Pennsylvania
I heard the NWS might issue a Flying Trash Can Warning for tomorrow... -
2026-2027 Strong/Super El Nino
bluewave replied to Stormchaserchuck1's topic in Weather Forecasting and Discussion
Yeah, we can see the overlapping influences between the El Niño, MJO, and -PDO heading into early June. The ridging showing up south of Alaska into Western Canada is the correlation with the El Nino and +AAM. The extension of the ridge further east across much of the CONUS is more -PDO and MJO 8-1 related for this time of year. So effectively a 500 mb composite in early June that reflects these influences. A coupled El Niño will vary in its sensible weather related to the other influences. Also the pattern in recent years of the 500 mb ridges becoming stronger and more expansive with weaker troughs during any given ENSO state. -
At least on Monday we should get some cold pool small hailers
-
heh, what was the conversation about ? Oh, I see. yeah
-

2026-2027 Strong/Super El Nino
BlizzardWx replied to Stormchaserchuck1's topic in Weather Forecasting and Discussion
Yeah, that is what my page shows as of the 27th for the daily value. As for how I did it, that's an important point to dwell on for any PDO calculation. It's dependent on the period of record, the exact domain, how much you correct the climate change signal, etc. All of these effect the EOF calculation that defines the weights that can then be used in the actual calculation. None of this is clearly standardized anywhere, which is why different groups get different values. I think that mine and WCS are better than NOAA who does not appear to have detrended the climate change signal properly. -
Just to make sure you just weren't making up s***.
.gif.2dd73b68ef712a1afcc9b692cfdbcf5f.gif)