All Activity
- Past hour
-

Septorcher 2026 Discussion - Endless Summer
MJO812 replied to Damage In Tolland's topic in New England
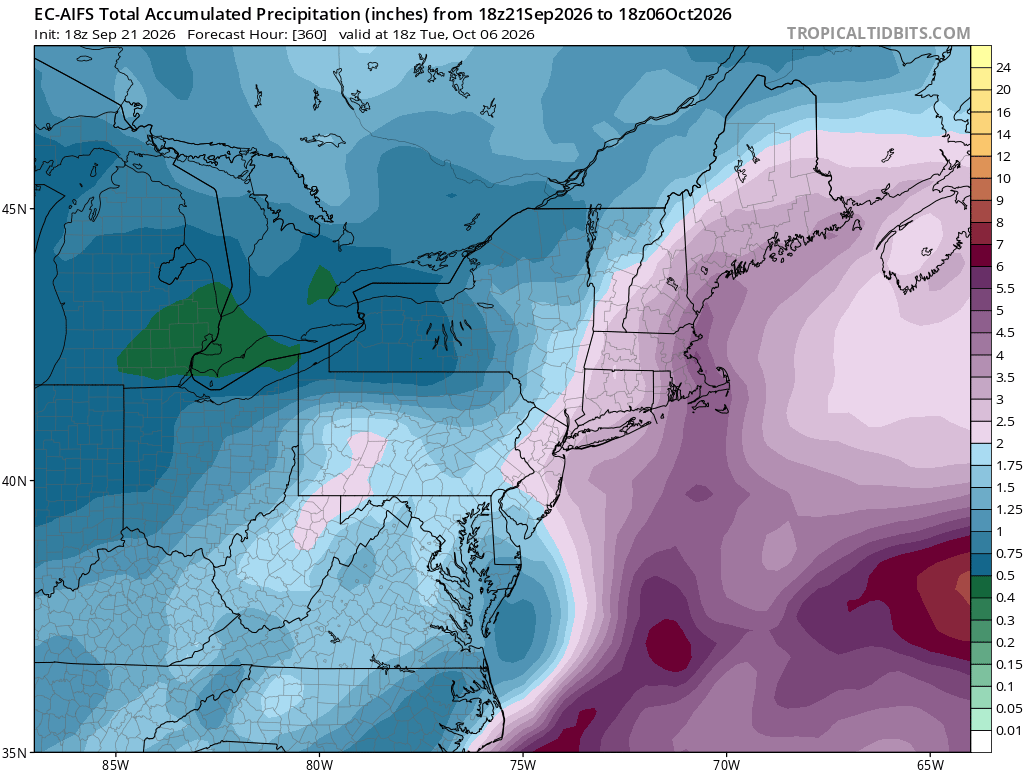
AI euro coming in west of 18z so far -

2026-2027 Fall/Winter Mountain Thread
Met1985 replied to BlueRidgeFolklore's topic in Southeastern States
All kinds of cells firing up now. Interesting since it's in the middle of the night. -
 http://axeryl.com/# prednisone cream rx
 -

2026-2027 Fall/Winter Mountain Thread
Rainforrest replied to BlueRidgeFolklore's topic in Southeastern States
Yep getting one right now. -
Congratulations, did anybody give you a medal? You definitely deserve one after all that hard work.
-
2026-2027 Fall/Winter Mountain Thread
Met1985 replied to BlueRidgeFolklore's topic in Southeastern States
Strong storms forming to the south tonight. -
new pharmacy online: Belvion Pharmacy - international drug mart
-
new pharmacy online: Belvion Pharmacy - international drug mart
-

Septorcher 2026 Discussion - Endless Summer
tunafish replied to Damage In Tolland's topic in New England
That would be a good start to reducing the deficit along all coastal ME. -
new pharmacy online: Belvion Pharmacy - international drug mart
- Today
-

2026-2027 Record-breaking El Nino
GaWx replied to Stormchaserchuck1's topic in Weather Forecasting and Discussion
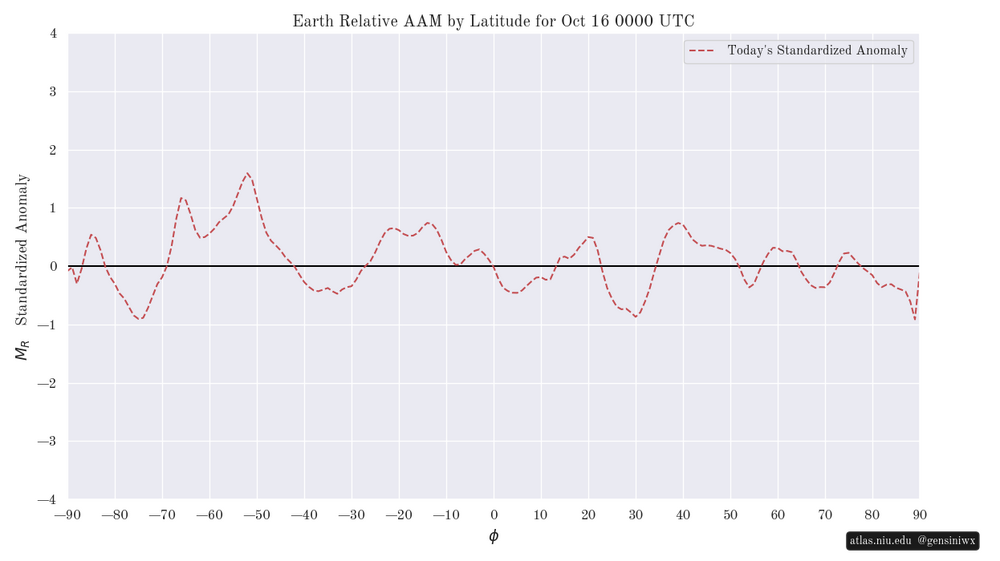
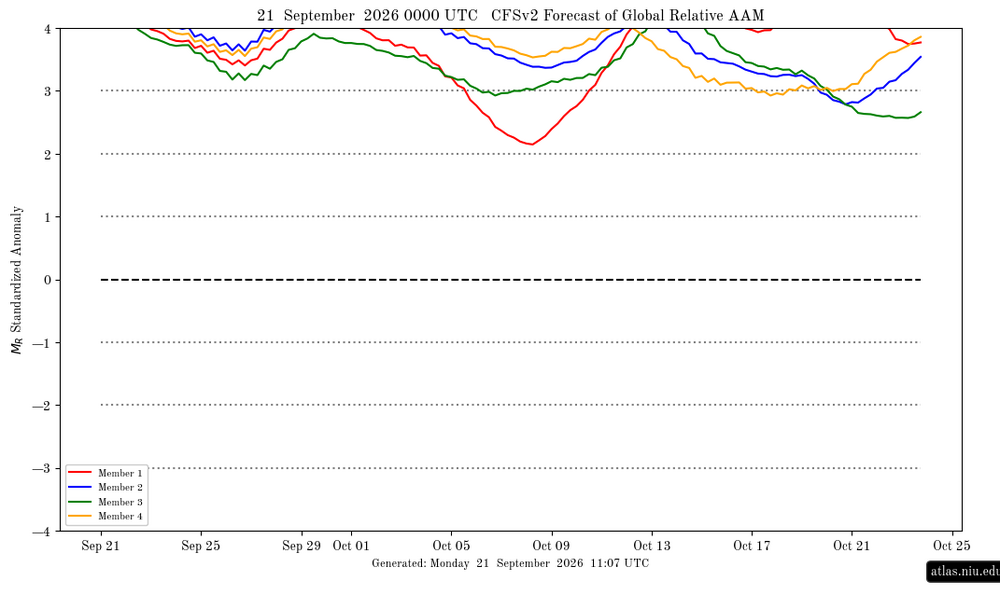
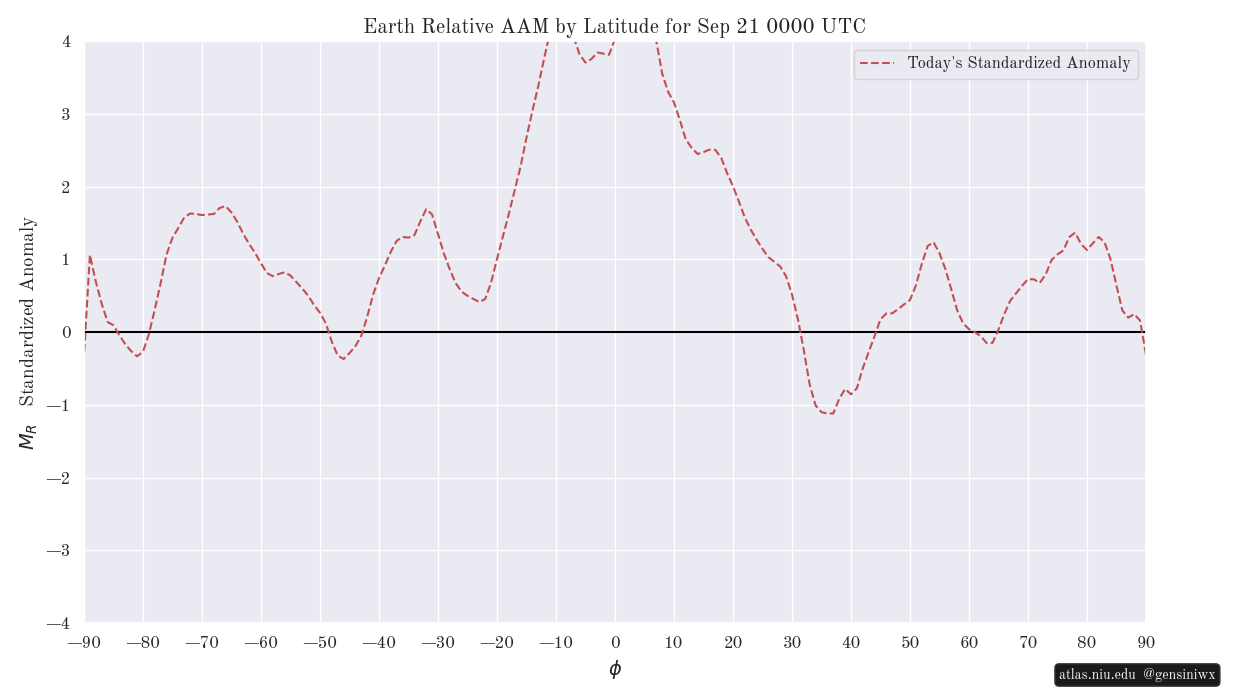
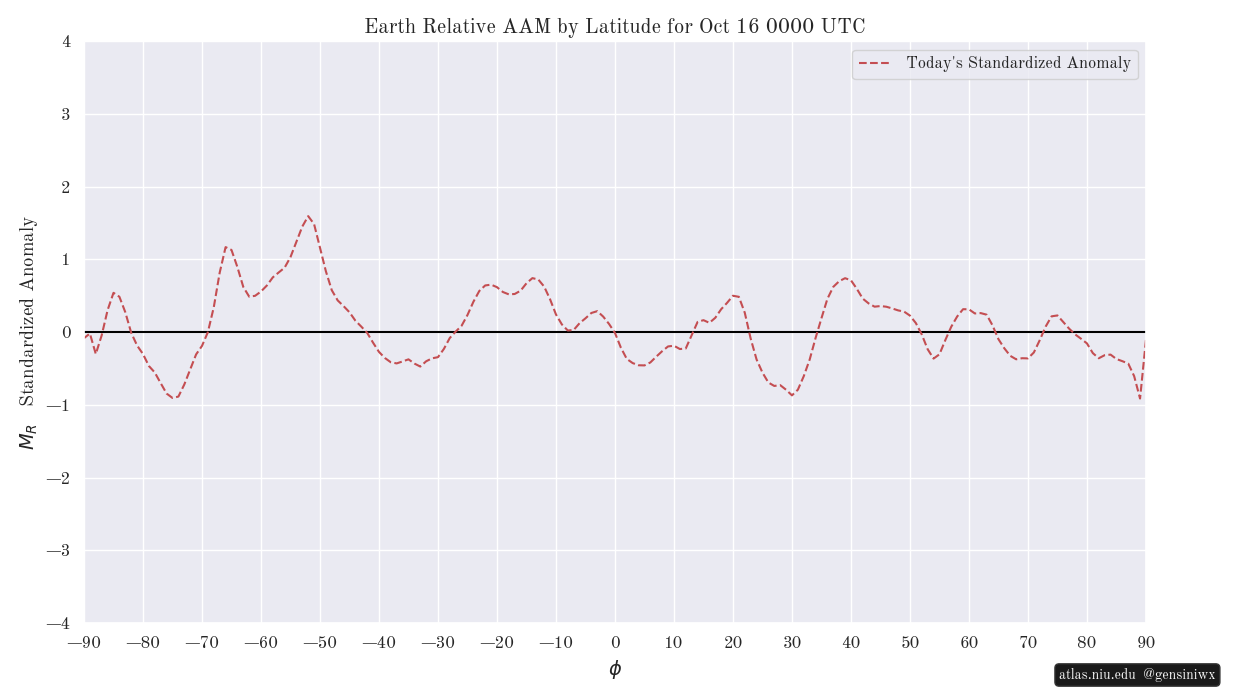
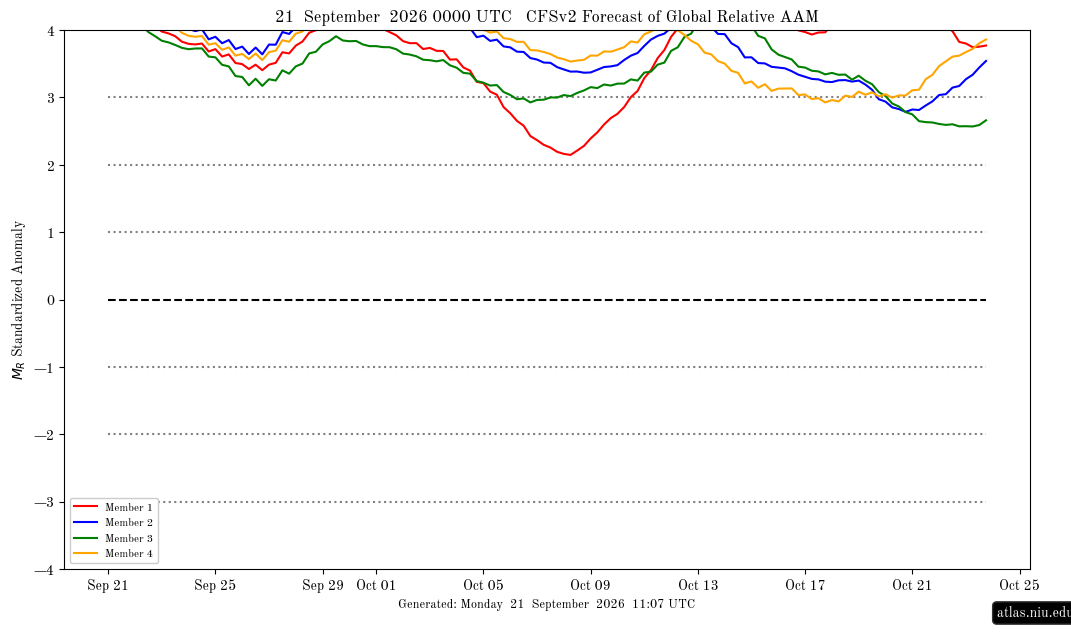
Thanks for posting this. For the first time I examined past versions of this because I just realized that the excellent website has these graphs going back to 4/11/2022. So, there’s ~1,000 of these to compare to. Now I know why the relative global AAM standardized anomaly graphs have been at extreme levels (>+4). This latitudinal based graph for 9/21/26 is an absolute beast overall and this exhibits the strength of this Nino very well! Why? 1. Back to 4/11/22, I couldn’t find even one other day’s graph with a more positive avg std. AAM anomaly for the area from -40 to +30! The straight avg std. dev above the mean for that huge area on 9/21/26 is clearly >2. Keep in mind that 2 std dev above the mean at any one latitude is way up at the 98th percentile and thus nearly 1/3 of the globe (20N to 17S) is >>+2 std dev/>>98th percentile! 2. The # of degrees of latitude with a negative AAM anomaly of the 180 total degrees on this 9/21/26 graph adds to only 29 degrees of the 180 total (16%). I couldn’t find even one other with that small a % of latitudes <0! 3. Most of the latitudes with a -AAM anomaly on 9/21/26 are only down to the 0 to -0.3 std dev range. The lowest is only down to -1.1, which is quite high for the lowest vs the other ~1,000 graphs. The highest lowest I could find is only barely higher (~-0.9) and it overall still had a much larger area below the 0 line than 9/21/26: So, it appears that 9/21/26 has the smallest area <0 of any back to 2022! Here again is this 9/21/26 beast of a +AAM anom by latitude. Keep in mind that just 1 std dev above the mean is up at the 84th percentile: Below is the corresponding relative global AAM, which since 0Z of 9/19/26 has been at an extreme level of >+4 std dev! This is probably the peak day as it should get back to <+4 by 9/23/26. How rare is 4 std dev above the mean? Per stat. formulas, only 1 in 31,574 days (that’s once per 87 years) gets to that level! (For 3 std dev, it’s ~once/year):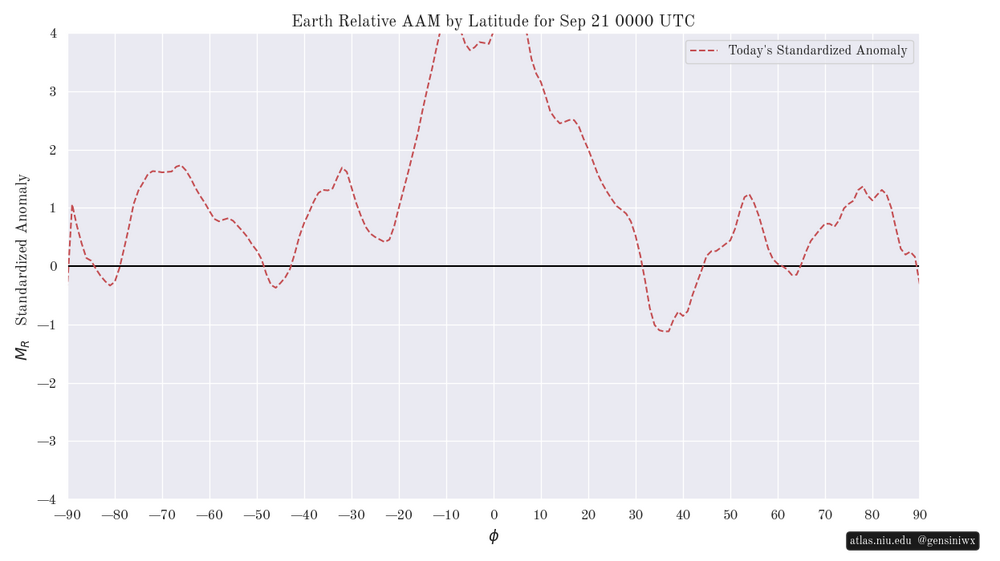
-
Septorcher 2026 Discussion - Endless Summer
WxWatcher007 replied to Damage In Tolland's topic in New England
GFS twins are big hits especially in eastern NE. -
medicine online or online pharmacy no prescription buy drugs online http://crewe.de/url?q=https://belvionpharmacy.com top-rated online pharmacies and https://vintage-car.eu/user/apklzwmwbs/ legitimate online pharmacy [url=https://community.strongbodygreenplanet.com/proxy.php?link=https://belvionpharmacy.com]trustworthy online pharmacy[/url] legitimate online pharmacy and [url=http://www.servinord.com/phpBB2/profile.php?mode=viewprofile&u=810368]pharmacy websites[/url] top online pharmacy
-
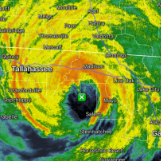
Lots more rain on the way for the DMV. Look at the radar! Good luck to everyone.
-
best online ed pills [url=https://edboldrix.shop/#]Ed Boldrix[/url] best online ed meds
-
This is the coldest 60 degree high I can remember. Breezy NW wind, cloud cover keeping us cool, and even chillier after the sun set and the temp plummeted . Def not used to this kind of wx yet
-
Septorcher 2026 Discussion - Endless Summer
powderfreak replied to Damage In Tolland's topic in New England
Drought.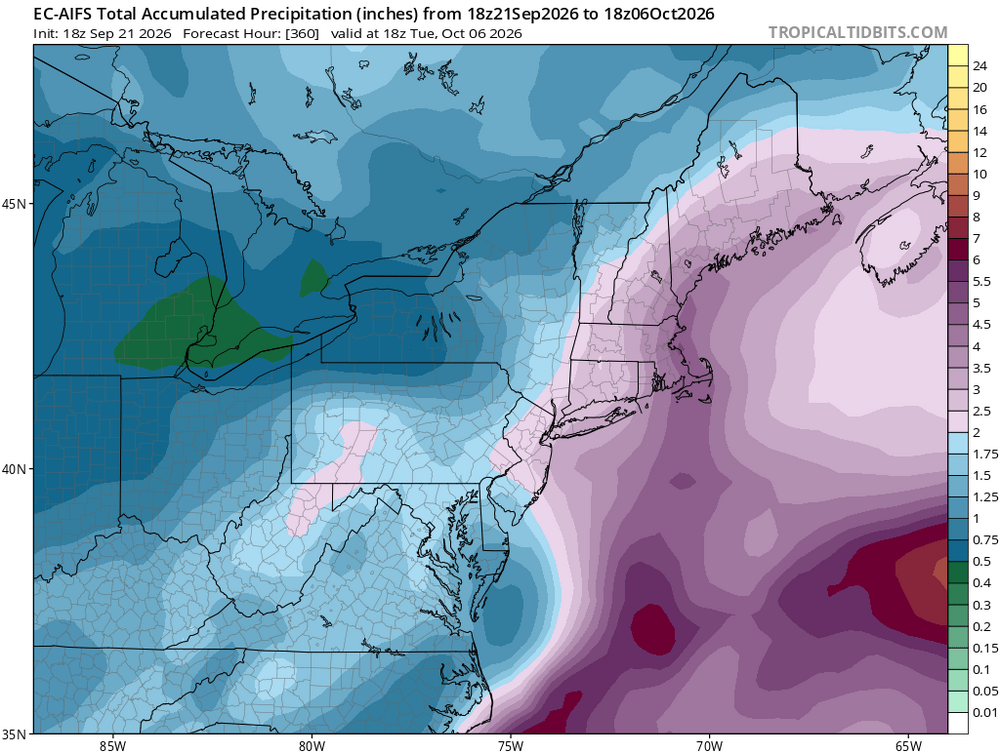
-
Septorcher 2026 Discussion - Endless Summer
Diggiebot replied to Damage In Tolland's topic in New England
High astronomical tides and long fetch will be the story. High Gusts will be on the coast and waves 15-20 maybe up to 30 or more feet could be major coastal flooding if it sets up right. Inland it’s rain as the big threat. Could easily be a dud inland tho. -
One other item concerning Polo. The only thing that may prevent record territory here is its slow, meandering movement in the next 24 hr. Yes, NHC notes the high OHC, however, when talking absolute records, everything typically has to be near ideal. The deep-layer 31 C SSTs, if that "only" falls to 30 C due to upwelling, that can be a factor. Still very intense, but 1 C difference in SST can be significant, in a relative sense, in this case, again when you are talking record territory.
-
Anniversary of both Long Island Express Hurricane-1938 and Hugo 1989.
-
By the end of this century, winters in Washington will resemble mid 20th century Greenwood, Mississippi, Greenville, Mississippi, or parts of California. While summers are likely to resemble mid 20th century Gulf Coast locations.
-
Do you guys think this is a good tool? I built this and it lets you compare all ThreadEx stations over the observed periods of 1895-1924, 1951-1980, 2016-2025, and then modeled 2041-2060 and 2081-2100. I picked these as they sample early 20th century means, mid to late 20th century means (also the normals that existed when I was born), recent anomalies, and then modeled projections for mid 21st and late 21st century. I used a relatively modest RCP2-4.5 forcing. I think they retired RCP5-8.5, but RCP3.3-7 is still in play (and some say recent forcings are closer to the high projections even if emissions are far short). And you can see how recent winters in Washington (or any other city) stack up against analog locations from 1951-1980. We can see for instance, recent winters in Washington resemble mid 20th century winters in places like Eugene, Oregon; Memphis, Tennessee; Norfolk, Virginia; Muscle Shoals, AL; and Huntsville, AL, with recent summers closely paralleling locations like Memphis, Savannah, or Daytona Beach. For the full year, Jonesboro, Arkansas is a close candidate, along with Muscle Shoals, Huntsville and Atlanta. Winter Summer Full Year
-
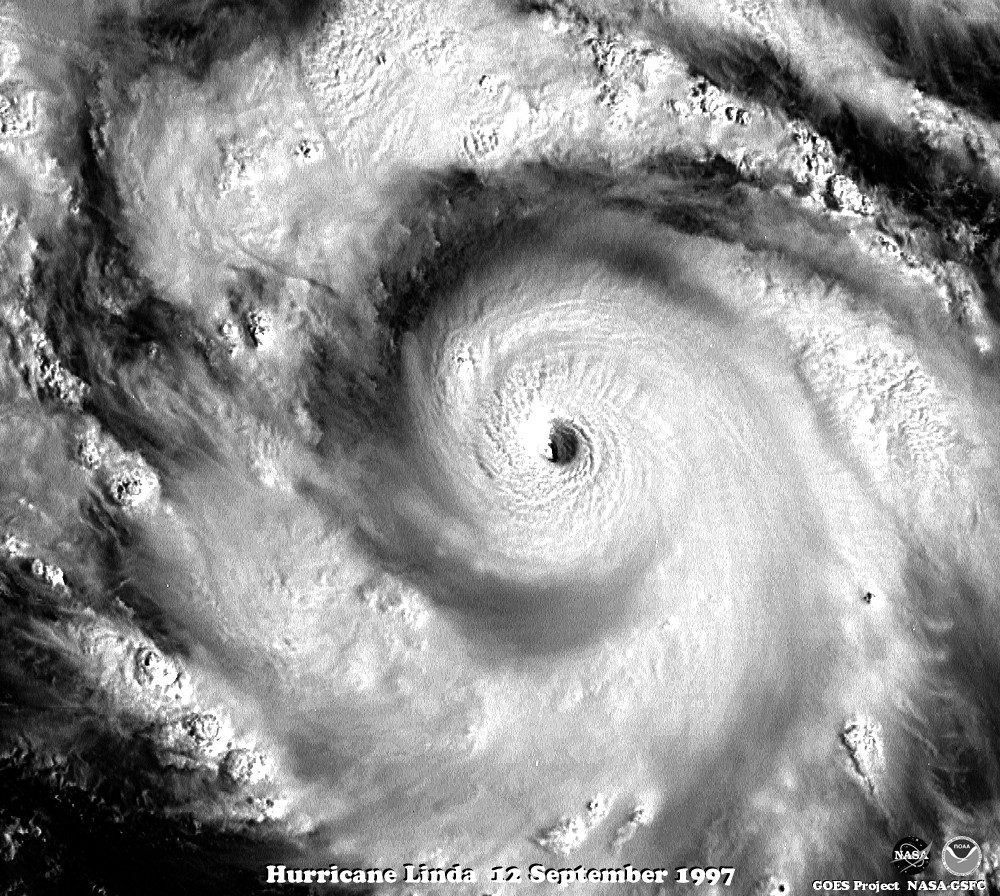
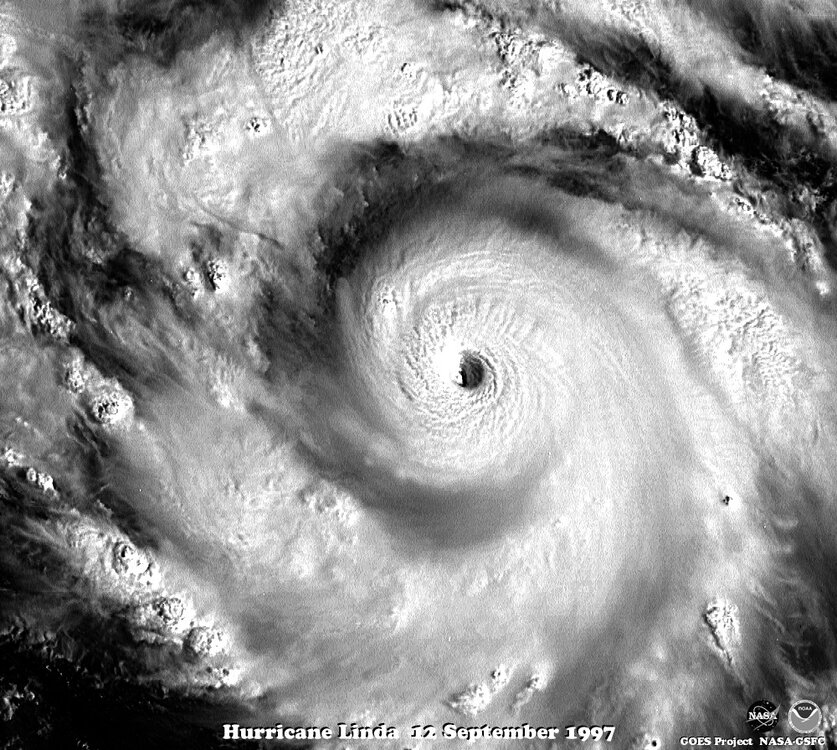
HU Polo is in an RI phase now, and it would not surprise me if it over-performs and gets to high-end (150-160 kt). This tends to occur in very strong El Nino. We had Patrica in 2015 and Linda in 1997. Linda never has a recon in when it was intense, sot its 160 kt peak is estimated, but it is likely it was higher than that. Look at this VIS image of Linda on 9/12/97. It was not as small as Patrica, but look at its CDO and very sharp subsidence ring around it. That is tell-tale sign of high-end intensity! Probably closer to 170 kt for a peak, but as I noted, NHC does not go above 160 kt for a TC in the absence of recon or other in situ data. The uncertainty when you get this intense is just too high, but one can say it was highly likely it was at *least* 160 kt!
-
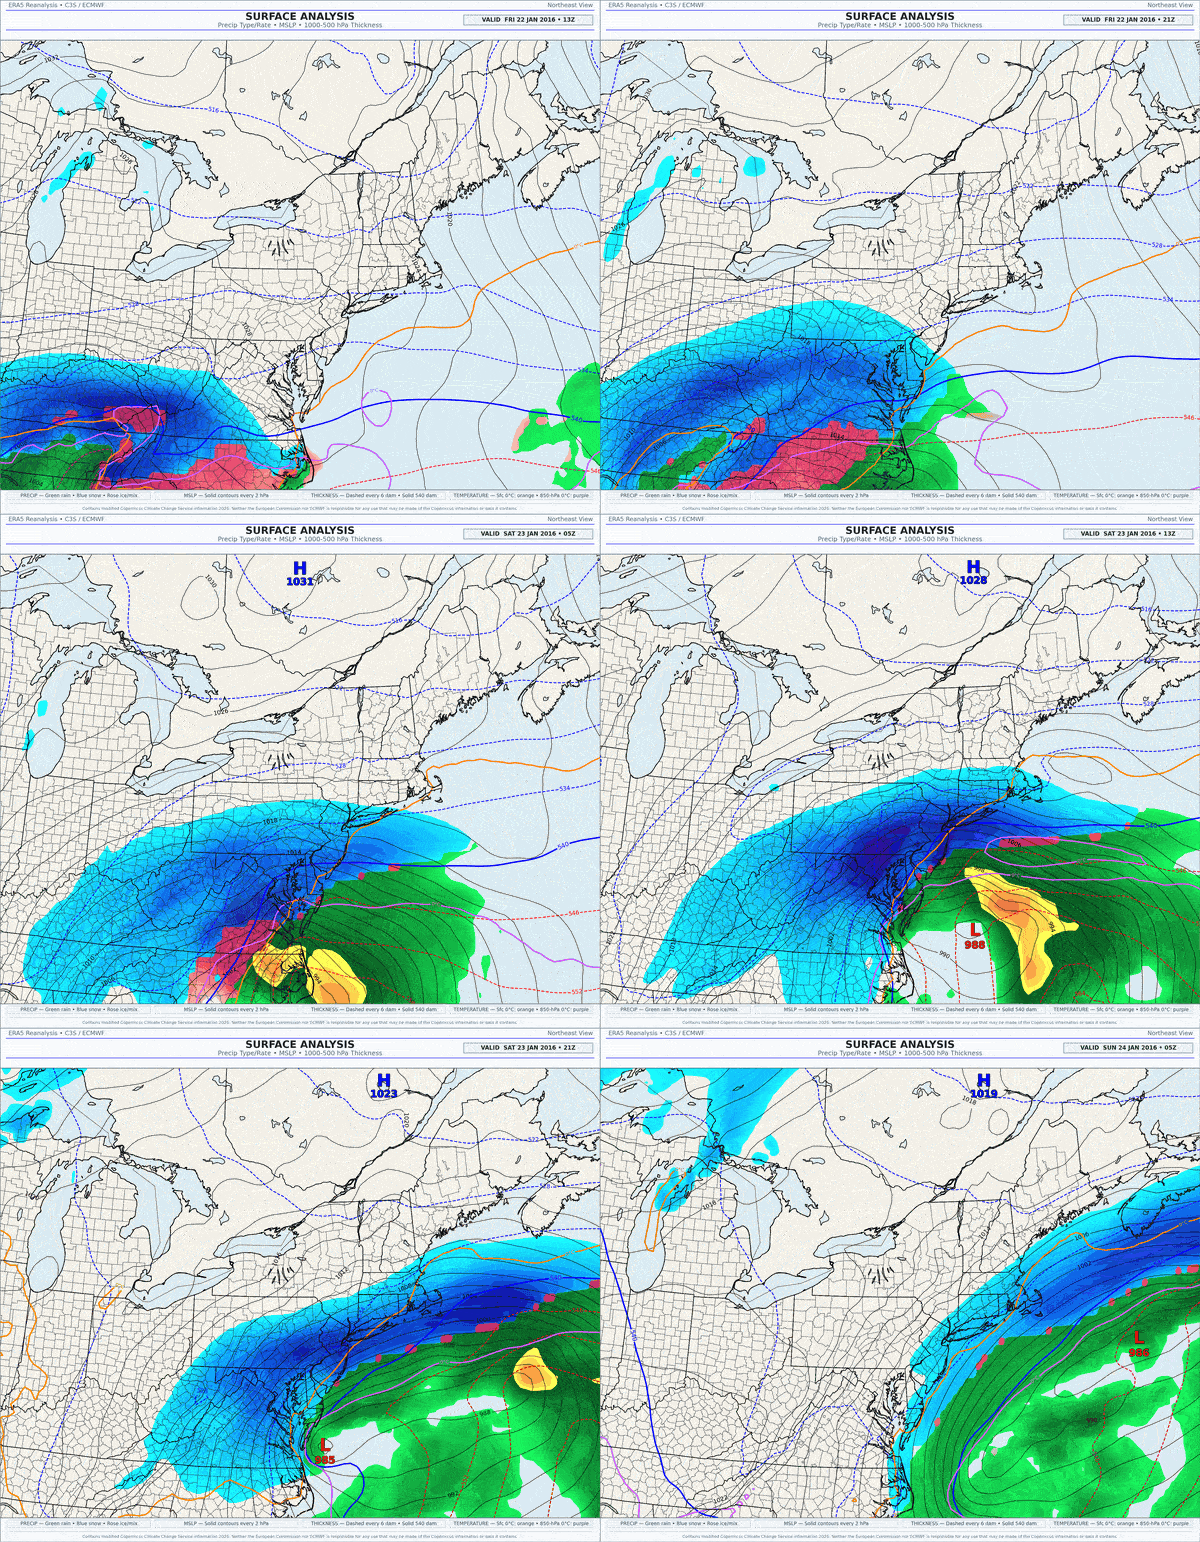
This winter, all it will take is one storm.
-
Maybe we can do a Jan 2024-like -NAO I do think there will be mean H5 ridging 60-90N this Winter. I'd give the odds of that happening at like 90%. May-Sept SLP 60-90N reverse for the Winter every time since 2012.



.thumb.jpg.ad3a2e31d30aff035044689b311a0540.jpg)