All Activity
- Past hour
-
I've been personally looking for a Bahama Blue circulation mode to set up... It's when you get a latitudinal straight S to N with mass gathering from the eastern Gulf meshing in with Trade circulation fields turning NW through the Bahamas and all the way up the stream comes. It's actually some of my most fascinating weather...just knowing the the deep blue with brilliant narrow turreted CU towers and their blinding single pixel rain shafts are not actually not from here. heh. Anyway, I have seen some hints of that in recent guidance but not convincing.
-
July 2025 Discussion-OBS - seasonable summer variability
winterwarlock replied to wdrag's topic in New York City Metro
Looks like 90 plus possible today -
It's 84 with dewpoint of 79 Sent from my SM-G970U1 using Tapatalk
-
I feel nuts sitting here worrying about rain when everyone else seems to be +7"-12" on me for the year Sent from my SM-G970U1 using Tapatalk
-
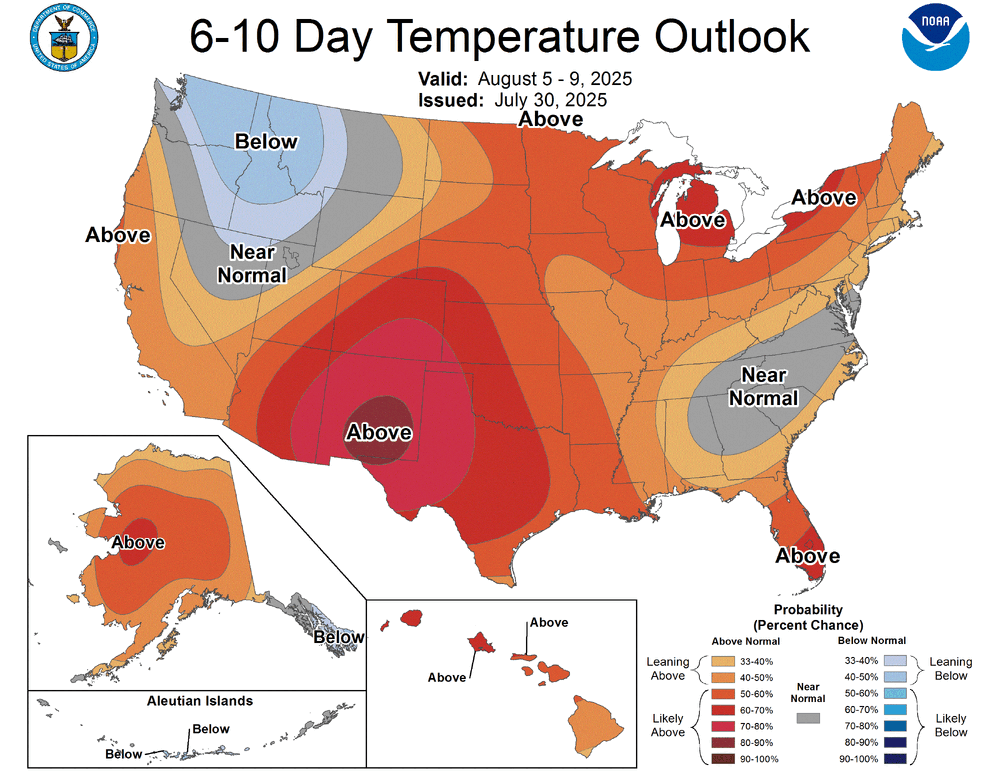
Beyond this weekend .. what we got? The CPC's enhanced probability for above normal temperatures. Just a primer (again..) on how to use this product: the intensity of red colorization does not mean higher scalar temperature. Orange hues progressing to red means greater and greater probability of above normal temperature in that order. In other words, this product says nothing of the magnitude of above normal. If the days turned out +0.01 ..this product was successful. Very high probability of above normal with that deep insidious dried scab over NM for example, means that there is a very high probability, based upon whatever methods CPC uses to assess, that the time range will average between 0 and Nth degrees above normal. This all conceptually true at the other side for BN, obviously. Having said all that, yeah...there some semblance of trend in the operational longer range means to roll another warm interlude out of the west. That observation matches timing with the day 8-14 from the same source above. The teleconnector numerical fields are positive-nominal ( AN but not +AN). SO ....there's likeliness for AN from all this blended info but nothing that smacks as exceptional at this time. It's important and obvious to note that telecons and these spatial synoptic layouts, et al, are more stochastic in summer, which doesn't lend to predictive skill.
-

July 2025 Obs/Disco ... possible historic month for heat
kdxken replied to Typhoon Tip's topic in New England
Don't know where you went to school but in mine if the teacher asked what's 6 + 6 and you answered 5 you would be wrong. -

July 2025 Obs/Disco ... possible historic month for heat
HoarfrostHubb replied to Typhoon Tip's topic in New England
Above normal as far as temps go. Less precip than normal. More humid than normal. -
I said it the other week when we were chattin up big totals for 2025, that we'd probably jinx it and rest of year struggle to reach climo. While i dont think that'll happen.....just like AI....mo nature listens to everything we say.
-

July 2025 Obs/Disco ... possible historic month for heat
dendrite replied to Typhoon Tip's topic in New England
ACATT off the rails -

July 2025 Obs/Disco ... possible historic month for heat
ineedsnow replied to Typhoon Tip's topic in New England
Top 10 to 15.. he also said no lows in the 40s in SNE. Stein for today.. I could keep going but I'm at the dentist waiting to go in so don't have the time lol -

July 2025 Obs/Disco ... possible historic month for heat
kdxken replied to Typhoon Tip's topic in New England
Why don't we just make it the hottest ever and call it a day. Close enough... -
Incredible stuff. Up to 9th warmest July overall at Pittsburgh, and 4th warmest since 1901 (excluding the early steroid-era records) behind only 1934, 1921 & 2020. I expect July to come in around 74.3F statewide, which would tie 2011 for 4th hottest (since 1895) for the statewide mean. This is based off of a current statewide (unweighted) mean of 75.4F from 105 well separated climate stations. Gridding/aerial averaging (urban adjustments?) have generally shaved off about 1-1.1F from the simple arithmetic mean in recent years with a similar basket of stations, which would bring us to about 74.3F. Monthly Data for July 2025 for Pennsylvania Click column heading to sort ascending, click again to sort descending. LANCASTER AIRPORT WBAN 79.2 MIDDLETOWN HARRISBURG INT'L AP WBAN 79.9 HARRISBURG CAPITAL CITY AP WBAN 78.7 JOHNSTOWN CAMBRIA COUNTY AP WBAN 73.4 READING REGIONAL AIRPORT WBAN 80.0 BRADFORD REGIONAL AIRPORT WBAN 69.8 PHILADELPHIA INTL AP WBAN 81.9 YORK AIRPORT WBAN 77.5 NORTHEAST PHILADELPHIA AIRPORT WBAN 79.3 PITTSBURGH ALLEGHENY COUNTY AP WBAN 76.5 PITTSBURGH INTERNATIONAL AIRPORT WBAN 77.2 ALLENTOWN LEHIGH VALLEY INTERNATIONAL AIRPORT WBAN 77.5 DUBOIS REGIONAL AIRPORT WBAN 73.0 WILLIAMSPORT REGIONAL AP WBAN 77.0 FRANKLIN WBAN 74.1 ERIE INTL AP WBAN 74.6 WASHINGTON COUNTY AP WBAN 75.9 HERITAGE FIELD AIRPORT WBAN 78.4 MEADVILLE PORT MEADVILLE AP WBAN 73.6 SELINSGROVE PENN VALLEY AP WBAN 75.9 DOYLESTOWN AIRPORT WBAN 78.2 WILKES-BARRE/SCRANTON INTERNATIONAL AIRPORT WBAN 75.5 ALTOONA BLAIR COUNTY AP WBAN 74.8 CLEARFIELD LAWRENCE AP WBAN 73.5 BUTLER COUNTY AIRPORT WBAN 75.4 AVONDALE 2 N WBAN 76.9 POCONO MOUNTAINS MUNICIPAL AIRPORT WBAN 71.6 Allentown Area ThreadEx 77.5 Avoca Area ThreadEx 75.5 Erie Area ThreadEx 74.6 Williamsport Area ThreadEx 77.0 Middletown-Harrisburg Area ThreadEx 79.9 Philadelphia Area ThreadEx 81.9 Pittsburgh Area ThreadEx 77.2 Reading Area ThreadEx 80.0 Mount Pocono Area ThreadEx 71.6 ALLEGHENY PENNSYLVANIA RAWS 72.5 PHOENIXVILLE 1 E COOP 80.0 DONEGAL 2 NW COOP 71.4 NESHAMINY FALLS COOP 77.7 CHARLEROI LOCK 4 COOP 80.4 LEBANON 2 W COOP 74.3 SELLERSVILLE COOP 77.6 BLUE MARSH LAKE COOP 77.4 POINT MARION LOCK 8 COOP 76.6 CONFLUENCE 1 SW DAM COOP 74.5 SAFE HARBOR DAM COOP 79.7 BIGLERVILLE COOP 78.5 CHAMBERSBURG 1 ESE COOP 70.8 WAYNESBURG 1 E COOP 75.7 CONNELLSVILLE 2 SSW COOP 77.4 LANCASTER 2 NE FILT PLANT COOP 79.2 SHIPPENSBURG COOP 78.5 NORRISTOWN COOP 79.6 FORD CITY 4 S DAM COOP 76.1 BELTZVILLE DAM COOP 75.3 BEAVER FALLS 1 NE COOP 76.0 LEHIGHTON 1SSW COOP 76.0 MAHANOY CITY 2 N COOP 74.2 STATE COLLEGE COOP 76.0 SUNBURY COOP 76.5 PUTNEYVILLE 2 SE DAM COOP 72.2 EAST STROUDSBURG COOP 75.0 SLIPPERY ROCK 1 SSW COOP 73.4 MURRYSVILLE 2 SW COOP 76.3 BRADDOCK LOCK 2 COOP 77.3 EBENSBURG SEWAGE PLANT COOP 69.9 SALINA 3 W COOP 75.8 ACMETONIA LOCK 3 COOP 75.8 LEWISTOWN COOP 76.4 GLENWILLARD DASHIELDS LOCK AND DAM COOP 78.2 INDIANA 3 SE COOP 73.7 NATRONA LOCK 4 COOP 77.0 SCHENLEY LOCK 5 COOP 78.4 MONTGOMERY LOCK & DAM COOP 75.9 LOCK HAVEN SEWAGE PLANT COOP 76.6 FRANCIS E WALTER DAM COOP 72.0 CLARION 3 SW COOP 74.4 RENOVO COOP 76.0 ALVIN R BUSH DAM COOP 75.2 FRANKLIN COOP 75.8 STEVENSON DAM COOP 74.8 RIDGWAY COOP 72.8 TIONESTA 2 SE LAKE COOP 75.0 PROMPTON DAM COOP 76.6 BRADFORD 4SW RES 5 COOP 71.8 LAPORTE COOP 70.2 EMSWORTH L/D OHIO RIVER COOP 78.0 NEW HOLLAND 2 SE COOP 79.2 COWANESQUE DAM COOP 73.2 SPRINGBORO 3 WNW COOP 72.7 GRAYS LANDING COOP 76.1 LEWISBURG COOP 75.5 LAUREL SUMMIT COOP 71.3 PHILIPSBURG 2 S COOP 72.9 SELINSGROVE 2 S COOP 76.4 COUDERSPORT 1 SW COOP 72.8 ALTOONA 7 SW COOP 75.3 GRAMPIAN 1E COOP 73.1 CARLISLE WATER PLANT COOP 76.3 MOON TOWNSHIP COOP 76.4 CASHTOWN 1S COOP 76.7 RAYSTOWN HQ COOP 75.0 HIDDEN VALLEY COOP 71.9 KINZUA DAM COOP 74.0 LAUGHLINTOWN 1SW COOP 73.3 MARTINS CREEK COOP 77.2 TITUSVILLE WATER WORKS COOP 72.4 CANTON COOP 73.4 PLEASANT MOUNT 1 W COOP 70.6 WELLSBORO 4 SW COOP 71.2 PORT ALLEGANY COOP 71.0 WARREN COOP 73.0 TIOGA HAMMOND DAM COOP 72.9
-

July 2025 Obs/Disco ... possible historic month for heat
dendrite replied to Typhoon Tip's topic in New England
And guess what? It is. -

July 2025 Obs/Disco ... possible historic month for heat
kdxken replied to Typhoon Tip's topic in New England
I thought he said top five? -

July 2025 Obs/Disco ... possible historic month for heat
dendrite replied to Typhoon Tip's topic in New England
It was top 5 in spots or close to it. 150 years of data. lol -
I am seeing ridge west, trough centered around ORD, and a big old WAR. Looking hurricane-ish?
-

July 2025 Obs/Disco ... possible historic month for heat
Henry's Weather replied to Typhoon Tip's topic in New England
My pumpkins need this rain (and subsequent cool stretch). My jack-o-lanterns are dropping all their female flowers pre-bloom due to heat stress, and seeing as we are coming up on Aug, time is ticking… Sugar baby watermelons though, doing just fine -

July 2025 Obs/Disco ... possible historic month for heat
ineedsnow replied to Typhoon Tip's topic in New England
And every year he says hot and humid from start to finish so there's that -

July 2025 Obs/Disco ... possible historic month for heat
ineedsnow replied to Typhoon Tip's topic in New England
He said top 5 and just this morning he said it was.. it wasnt -
3k NAM starts storms by 12-1pm
-

July 2025 Obs/Disco ... possible historic month for heat
dendrite replied to Typhoon Tip's topic in New England
He had a good call. Lol -

July 2025 Obs/Disco ... possible historic month for heat
ineedsnow replied to Typhoon Tip's topic in New England
Meh I have a few for him.. I already admitted I was wrong but for some reason he cant -

July 2025 Obs/Disco ... possible historic month for heat
radiator replied to Typhoon Tip's topic in New England
Incoming...


