All Activity
- Past hour
-
Back to cold and windy
-
2026-2027 Strong/Super El Nino
LakePaste25 replied to Stormchaserchuck1's topic in Weather Forecasting and Discussion
Does the difference matter at that temp? 97-98 could’ve easily produced a blizzard just like 15-16. Maybe just less cold shots. -

2026-2027 Strong/Super El Nino
forkyfork replied to Stormchaserchuck1's topic in Weather Forecasting and Discussion
there's also the fact that the snow people have driven almost everyone else off the forum -
2026-2027 Strong/Super El Nino
LakePaste25 replied to Stormchaserchuck1's topic in Weather Forecasting and Discussion
this gave me a good laugh: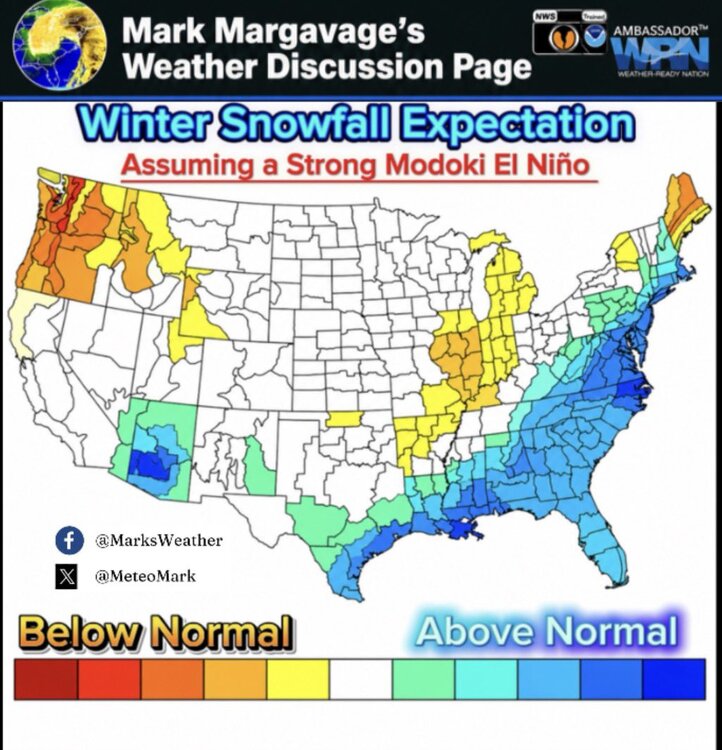
-

2026-2027 Strong/Super El Nino
TheClimateChanger replied to Stormchaserchuck1's topic in Weather Forecasting and Discussion
The hypothetical only works by assuming the entire tropical ocean belt is +3.3°C above recent climatology, which is physically impossible. But yeah, in theory, if ONI were +3.3°C and RONI were 0°C, that would not mean “monster El Niño.” It would mean the entire tropical ocean was so absurdly warm that Niño 3.4 no longer stood out. -
2026-2027 Strong/Super El Nino
forkyfork replied to Stormchaserchuck1's topic in Weather Forecasting and Discussion
it would be less annoying if you people could be objective about it. you didn't even think this would reach super a few months ago -

2026-2027 Strong/Super El Nino
GaWx replied to Stormchaserchuck1's topic in Weather Forecasting and Discussion
I’ll give an extreme hypothetical case. Let’s say ONI were +3.3C and RONI were 0C because the tropical oceans were insanely warm. So, in other words, everything in and also around Nino 3.4 as well as the other tropical waters is insanely warm. Then wouldn’t that mean essentially no Nino SST pattern/no contrast vs surrounding waters existing to then lead to typical Nino atmospheric responses? That’s my understanding about the RONI idea. -
lol
-
Oh yeah, I forgot: we’re only allowed to suggest modern readings may be biased warm. It is apparently anathema to point out that some sensor/site discrepancies could cut the other way — especially when the daily highs line up better than the lows.
-
2026 Atlantic Hurricane Season
WxWatcher007 replied to Stormchaserchuck1's topic in Tropical Headquarters
Very interesting data and absolutely, we can't forget that even if we don't see a particularly strong tropical system wind wise there could be big and far reaching impacts from rainfall. I'm guessing that early and late season will probably be most favorable for TCG because I think tropical waves are going to have an extremely hard time during peak season to survive the trek west. In the eastern MDR they are going to find a profoundly stable and hostile environment, and any that make it to the Caribbean will get ripped apart by shear. Any trying to scoot north of the Antilles are likely to run into big TUTTs ripping them apart. Waves will develop, but it's going to be uphill to say the least imo. I kind of think CAG will be the most favorable mode for TCG this year. We'll see. Another important point--it doesn't even need to be a high end Nino to cause major issues basin-wide. The SSTa tell a lot of the story. The MDR is cool (remember when some thought it would never cool again haha) and the orientation doubles down on stability/subsidence issues we had even during the highly active years recently. -
2026-2027 Strong/Super El Nino
TheClimateChanger replied to Stormchaserchuck1's topic in Weather Forecasting and Discussion
A +2.7°C RONI peak may be comparable to 1982 in relative ENSO strength, but a +3.3°C ONI peak would still be physically meaningful because it reflects the actual SST anomaly humans, ecosystems, and the atmosphere experience. ONI already uses a rolling 30-year climatology updated every five years. So why is RONI still ~0.6°C lower? Because the entire tropical ocean background is running absurdly warm even versus the recent baseline. -
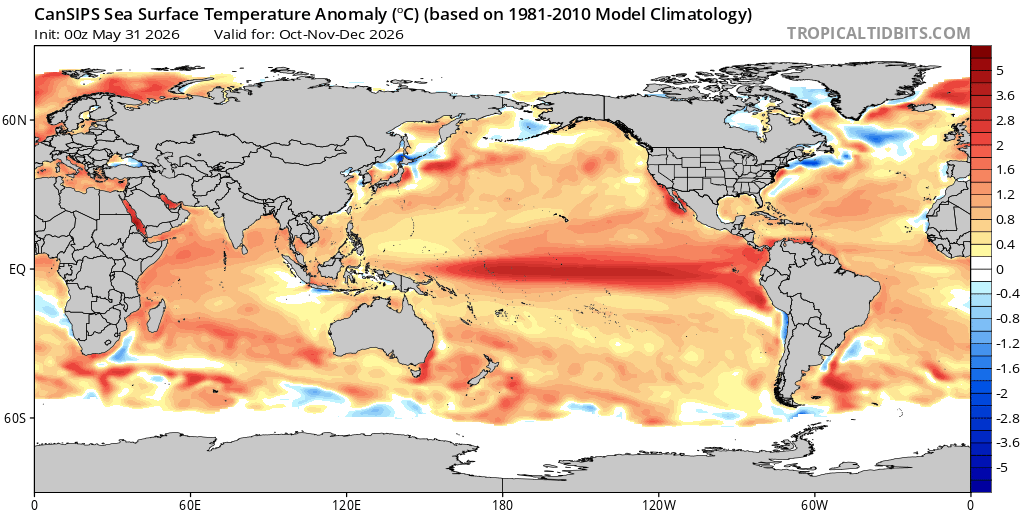
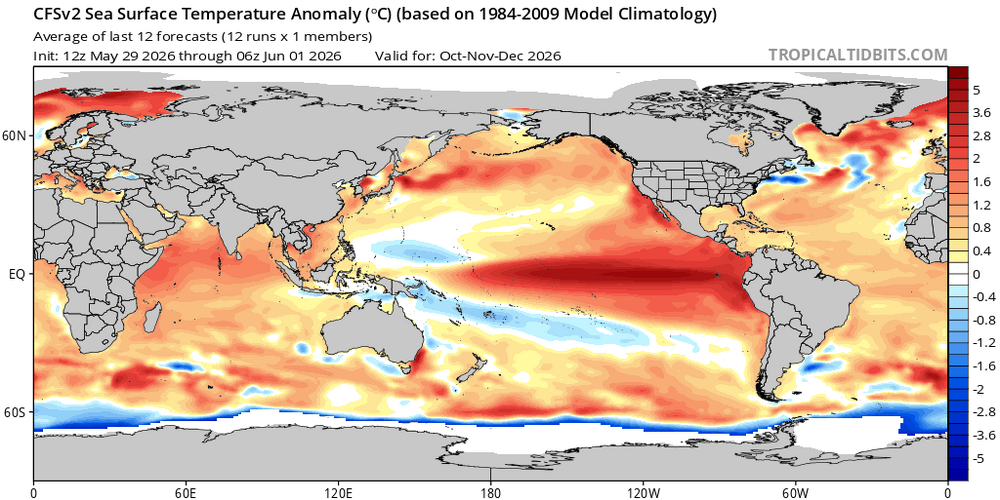
At least right now, nothing screams the developing EL Nino is a modoki, if anything it looks like we would be looking at a mixed or basin wide event given the strong anomalies in the (hostile) 1.2 region and Nino 4 region. Now, what would happen towards the end of the EL Nino event is a transition to a modoki EL Nino, which isn't uncommon for a weakening stronger EL Nino as region 1.2 tends to be the first to cool. In terms of impacts on the continental U.S. summer, Tip and I had some dialogue on this a few weeks back but I don't think there is much of a correlation and there are drivers. EL Nino's tend to not become fully established until late summer or even early Fall. An argument can be made that while the PAC is in the transitioning mode and this may have a quick and direct impact on the Hadley Cell but there atmospheric response can be quite often lagged to how the ocean is evolving and there are other factors to consider. Also, if we're just focusing on the impacts on summer to stronger EL Nino events, the sample size really isn't that great and at this point a strong event isn't even guaranteed. While the data may indicate that, we still need to get there first. IMO, I think some of the late winter/early spring responses within the Arctic and stratosphere held so much weight on the northern hemisphere pattern that we're still dealing with those impacts.
-
Couple of nice bolts close by yesterday evening.
-

2026 Atlantic Hurricane Season
jconsor replied to Stormchaserchuck1's topic in Tropical Headquarters
13/6/2 with 90 ACE (I think a reasonable range for ACE accounting for uncertainty at this stage is 60-115 ACE). My ACE forecast is slightly lower than the mean of the seasonal forecasts on https://seasonalhurricanepredictions.bsc.es/forecast/seasonal-predictions See https://seasonalhurricanepredictions.bsc.es/about/forecasters for more background on how each group/agency produces its seasonal forecasts. 268Wx and Univ. of Arizona have shown particular skill vs. other forecasts in past +ENSO years like 2019 and 2023 (when ACE was generally notably higher than most seasonal forecasts) and in -ENSO years like 2022 and 2024 (when ACE was generally notably lower than most seasonal forecasts). Interestingly, 268Wx and Univ. of Arizona this year represent the far high end of the forecast spectrum in terms of ACE/level of activity. -Yaakov -
2026-2027 Strong/Super El Nino
brooklynwx99 replied to Stormchaserchuck1's topic in Weather Forecasting and Discussion
also, let's be real, the only reason why this thread gets 95% of the traffic it does is because of the impact on the following winter, which carries the largest correlation to ENSO, anyway. i doubt anybody cares about the SW monsoon (aside from Raindance) or eastern Pacific algal blooms -
2026-2027 Strong/Super El Nino
brooklynwx99 replied to Stormchaserchuck1's topic in Weather Forecasting and Discussion
these events always begin very EP, that's nothing new. not much support on a persistent EP event... we should see things move basin-wide by the time winter rolls around. looks pretty 2015-16 esque in that regard, not 1997-98
-
-
-
I’m downwind of Winni on NE flow so it stabilizes me in these self destructive sunshine days in spring and we stay mostly sunny. You can see it downwind of Sebago too on vis.
-
66F and sunny. Sun helps this time of year.
-
My numbers for May 2026 Averaged high was 72.3 degrees vs a normal of 73.6 degrees, -1.3 degrees below average. The warmest temp recorded was 90.2 degrees on the 20th. Averaged low temp was 46.6 degrees vs a normal of 48.6 degrees, -2.0 degrees below average. The coldest temp recorded was 33.8 degrees on the 3rd. Overall averaged temp was 59.5 degrees vs a normal of 61.1 degrees, -1.6 degrees below average. Total rainfall was 3.90 inches vs a normal of 4.30 inches, -0.40 below normal. The greatest rainfall was on the 12th with 0.57 inches. There were 14 days with measurable, 3 days with a 'T' and 14 dry days. Highest wind recorded was 37 mph. There were 12 days with winds above 25 mph and 4 more days in the low 20's. Several new records. A new record 'warm minimum' was set on the 27th, and new record 'cold maxes' were set on the 15th, 23rd and 24th. A slightly cooler month, quite dry until the end when 3/4's of the monthly rain fell over 8 days.
- Today
-
A little cool but beautiful in the sun
-
The funniest part of this is that the goalposts move depending on which statistic is inconvenient.When I use mean temperatures, they complain that highs matter more because daytime warmth is what people actually experience. When I use maximum temperatures, they suddenly discover minima and diurnal ranges. There is a method to my madness here. Since the ASOS sensor/shield changes, minimum temperatures appear to be running unusually cool relative to the old observing regime, especially under radiational cooling setups. That means larger diurnal ranges can show up in the data in a way that is not necessarily apples-to-apples with the older record. That is why I have been emphasizing maximum temperatures more recently when it comes to ASOS readings. Highs are more likely to be consistent across the long-term record than minima that are especially sensitive to calm, clear-night radiational cooling and sensor/shield behavior. And, ironically, these unusually large diurnal ranges are the opposite of what you would expect if the signal were simply urban heat island or greenhouse-gas-enhanced nighttime warming. AGW tends to compress diurnal range by warming nights more than days. UHI also tends to show up most strongly in overnight minima. So yes, Detroit had a cold stretch. Nobody is denying that. But calling the winter some kind of grand rebuttal to the broader warmth is absurd. Year-to-date is still above average, March and April were very warm, and warmth has easily won the larger battle. You can cherry-pick January 15 to February 9 all you want. I can also pick March and April. That is why we look at the full context. But the rule cannot be: Mean temps matter when they help you. High temps matter when they help you. Min temps matter when they help you. And everything else is “spin” when it does not.
-

Junorch obs and discussion 2026
Damage In Tolland replied to Damage In Tolland's topic in New England
Maybe meeting a new wife? -
Should be a nice and warm day