All Activity
- Past hour
-

2026-2027 Record-breaking El Nino
OSUmetstud replied to Stormchaserchuck1's topic in Weather Forecasting and Discussion
And im talking about the peak. 3.4 taking a bit longer to get to the forecast heights does not mean that the peak will be wrong. The record trades are there..the record subsurface etc. The ecwmf from a few days ago had a RONI of 2.15 for July with a peak around 3.3C. The BOM RONI of 2.25 with a peak of 3.7C is not even that different relative to its own dataset. -
I share the same concerns, but a slightly warm seasonal avg would imply we "should" get cold periods because when it gets warm we tend to go crazy warm. I doubt we get a uniform near to slight above avg temp regime the whole winter. If we have volatility and it averages out to +2 that's fine...we can't snow anymore during warm periods anyways...just have to hit the big one during whatever cold we do get.
-

Septorcher 2026 Discussion - Endless Summer
tamarack replied to Damage In Tolland's topic in New England
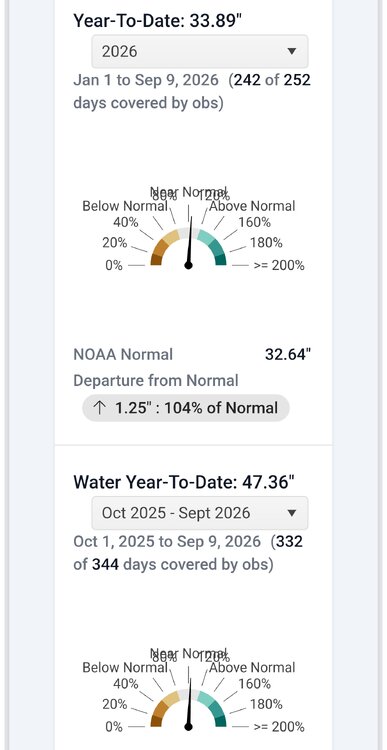
We're at 34.76" to date here. Lowest of 29 water years is 34.44" for 10/01-9/02, 2nd lowest 35.86" the following year(s). I think we'll get more than 1.1" by the 30th to climb into 3rd driest. Next step is 38.08" last year and I think that getting another 3.32"+ this month is unlikely. 39 this morning, season's first sub-40, and now struggling to get past the mid-50s. -
The sad irony is that the two in the 30’s were also the result of the actions of sentient sapiens. sorry Don … I had a very brief Tip channeling, even though I could not begin to come close to his depth or eloquence. As always …..
-

Septorcher 2026 Discussion - Endless Summer
Damage In Tolland replied to Damage In Tolland's topic in New England
Toorrrcchhh!! -

2026-2027 Record-breaking El Nino
GaWx replied to Stormchaserchuck1's topic in Weather Forecasting and Discussion
I said in my post that EVERY month since April verified significantly too warm. That’s five months in a row, not just August. I pointed out Aug because your two maps showed how much Aug had to be revised down. But April, May, June, and July also had to be similarly revised significantly down. Like for Aug, I’m talking about when each was the then current month. In other words, these were very poor forecasts considering they were then the first month. I’ve got all of the maps saved and can post them if necessary. -
.thumb.gif.f92b16c631a1d15d405ed77b33f0710d.gif)
Septorcher 2026 Discussion - Endless Summer
Torch Tiger replied to Damage In Tolland's topic in New England
did someone call for big heat? that's nearly impossible after early September -
2026-2027 Record-breaking El Nino
OSUmetstud replied to Stormchaserchuck1's topic in Weather Forecasting and Discussion
I think assuming the relatively poor verification of a single month of August is bad logic. Every month prior to the past verified near or higher than models effectively. The warm water is still there and will eventually head west. BOM RONI forecast of 3.7 is effectively an ERSSTv6 RONI forecast of 3.0. Given the sst dataset and satellite integration. Its in line with other models just biased that warm direction. -

Septorcher 2026 Discussion - Endless Summer
CoastalWx replied to Damage In Tolland's topic in New England
If we don’t get a dirty airmass with debris clouds 85-90 possible next week. It’s really toasty at 850. -

Septorcher 2026 Discussion - Endless Summer
Brian5671 replied to Damage In Tolland's topic in New England
That's above normal yes, but not big heat. -

Occasional Thoughts on Climate Change
donsutherland1 replied to donsutherland1's topic in Climate Change
The preliminary data reveal that Summer 2026 swept past Summers 1936 and 2021 to easily become the warmest summer on record for the contiguous United States. Five of the ten warmest summers have occurred since 2020. Just two occurred during the 1930s.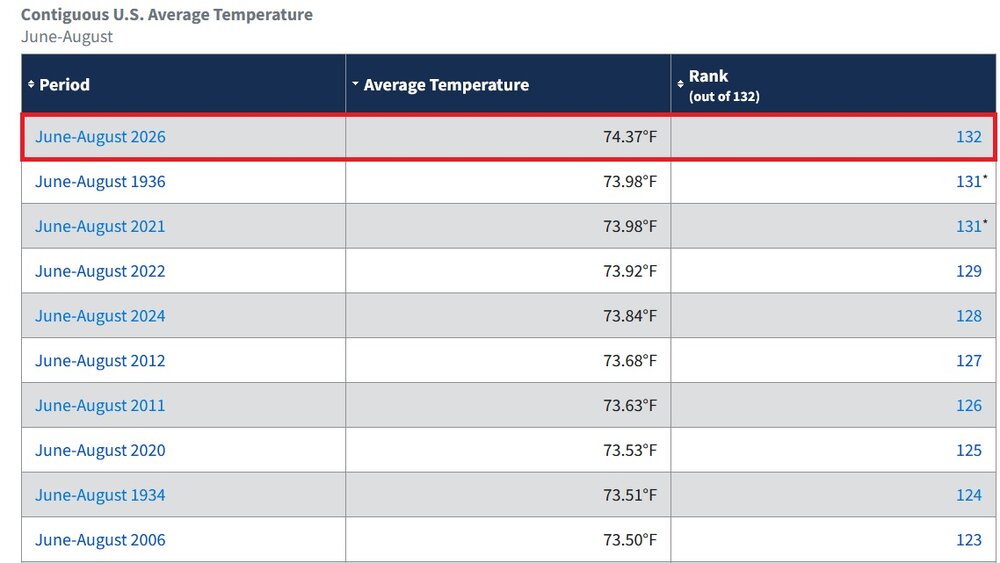
-
2026-2027 Record-breaking El Nino
GaWx replied to Stormchaserchuck1's topic in Weather Forecasting and Discussion
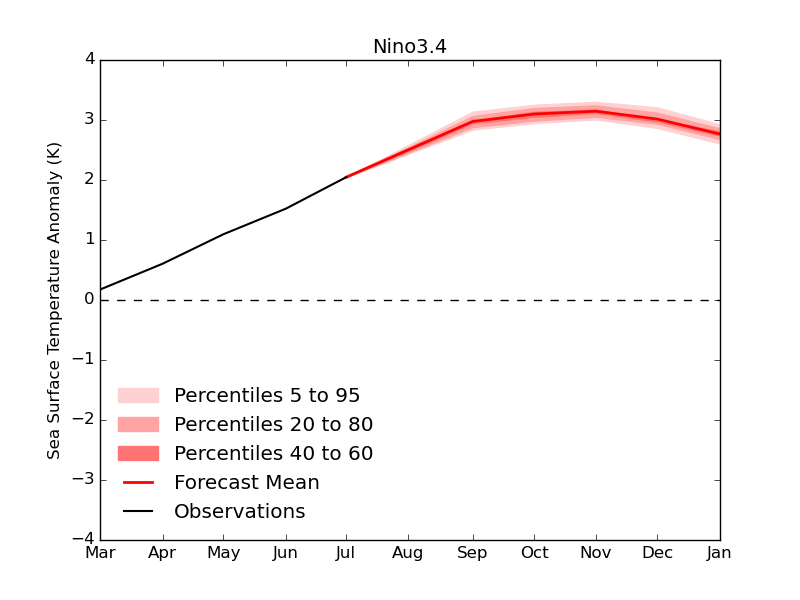
In Sept of 2023, the UKMET did much better than the way too warm BoM and was about the best of all models. Sept ‘23 UKMET progged ONI peak ~+2.0, which verified almost perfectly: I’ll be anxiously awaiting the Sept ‘26 UKMET ONI peak forecast. Here’s August of ‘26: ~+3.0. Keep in mind that this is ONI, not RONI! https://www.metoffice.gov.uk/research/climate/seasonal-to-decadal/gpc-outlooks/el-nino-la-nina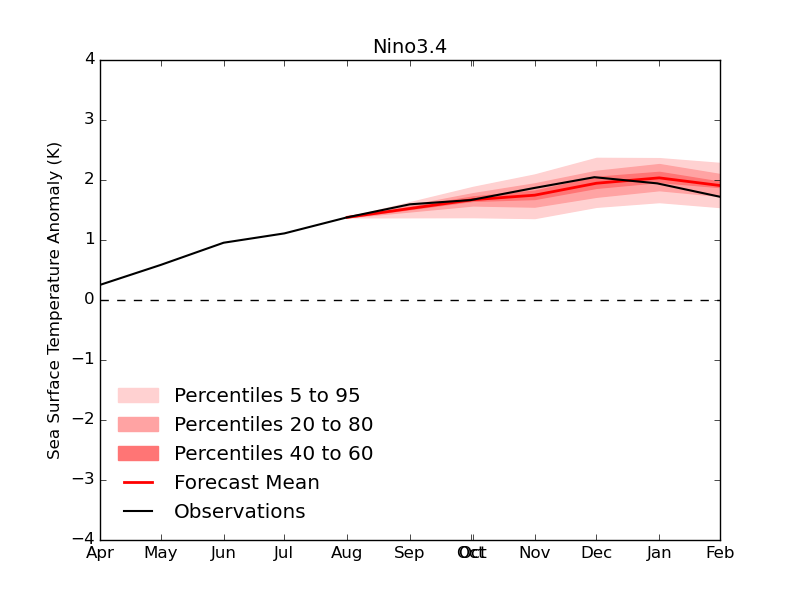
-

Septorcher 2026 Discussion - Endless Summer
Ginx snewx replied to Damage In Tolland's topic in New England
-
From nyack high school playing field complex.

-
Looks like back to the future lol
-

Septorcher 2026 Discussion - Endless Summer
FXWX replied to Damage In Tolland's topic in New England
Exactly... While arctic sand / powder storms might be hard to come by, ante is upped for slush bombs? - Today
-
Septorcher 2026 Discussion - Endless Summer
Torch Tiger replied to Damage In Tolland's topic in New England
Ensembles are in agreement in above normal height fields and 2 meter temp anomalies for the first half of next week. This supports above normal temps for the first half of next week...mainly in the upper 70s to the middle 80s -
2026-2027 Record-breaking El Nino
GaWx replied to Stormchaserchuck1's topic in Weather Forecasting and Discussion
Yep, the BoM monthly relative peak actually rose ~0.1 over the last month to ~+3.7, very much unlike the drop of 0.5 of the CFSv2 RONI trimonthly peak. Also, it unlike most others keeps it almost that high in Dec. I expect BoM will bust significantly too warm for this progged relative monthly peak of +3.7 like it did in 2023, when it was the warmest and verified way too warm. Also, note that every month since April on the BoM has busted significantly too warm. One can even see that for Aug by comparing your two graphs: the Aug 8th run had Aug way up at +2.7. The Sep 5th run lowered it down to +2.35. (I believe that the BoM uses a different dataset anomaly that makes it warmer than NOAA as you probably realize. I think it uses the warmer CRW as a base at least to an extent. That only adds to confusion.) The BoM (AUS-Access) had a whopping +2.9 for its peak forecast in its Sept ‘23 run! NDJ verified 0.9 too warm and DJF verified 1.1 too warm vs the NOAA ONI table seen at the link at the bottom of this post: https://www.cpc.ncep.noaa.gov/products/analysis_monitoring/enso/oni/v6/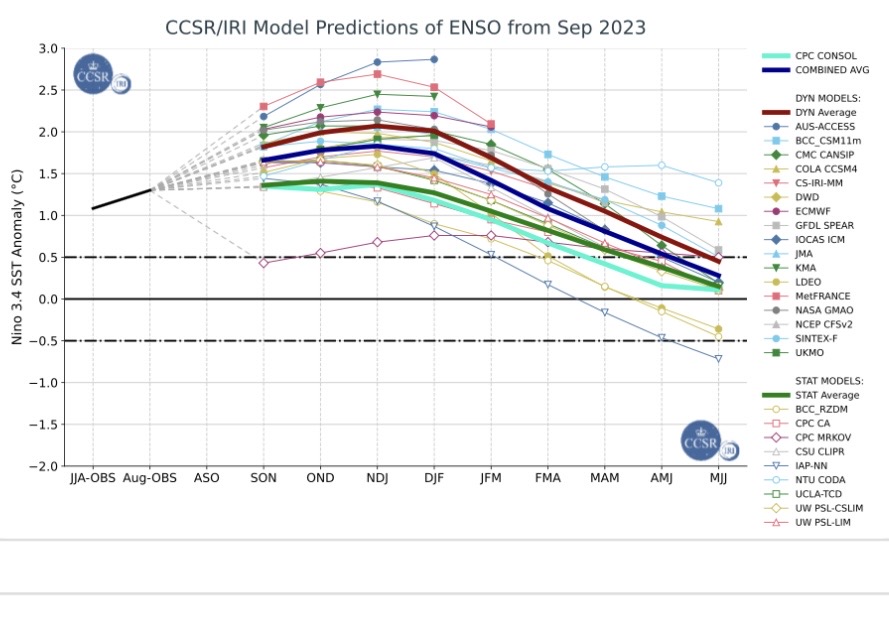
-
2026-2027 Record-breaking El Nino
40/70 Benchmark replied to Stormchaserchuck1's topic in Weather Forecasting and Discussion
Yea, the EURO was better...but I'm willing to bet that the CANSIPS and JAMSTEC have missed by more than the CFS. -
Septorcher 2026 Discussion - Endless Summer
OldSkool replied to Damage In Tolland's topic in New England
Mid 80s today and tomorrow......that's it. -
Septorcher 2026 Discussion - Endless Summer
WxWatcher007 replied to Damage In Tolland's topic in New England
Couldn’t agree more. We will have our chances. -

E PA/NJ/DE Autumn 2026 Obs/Discussion
Birds~69 replied to PhiEaglesfan712's topic in Philadelphia Region
85F/DP 69F at 12:30pm -

Septorcher 2026 Discussion - Endless Summer
SJonesWX replied to Damage In Tolland's topic in New England
66 degrees at noon. hell of a way to run a TORCH! -
2026-2027 Record-breaking El Nino
OSUmetstud replied to Stormchaserchuck1's topic in Weather Forecasting and Discussion
Bom weekly data runs hotter than other agencies so you gotta compare apples to apples. The latest forecast compared to the one from just under a month ago: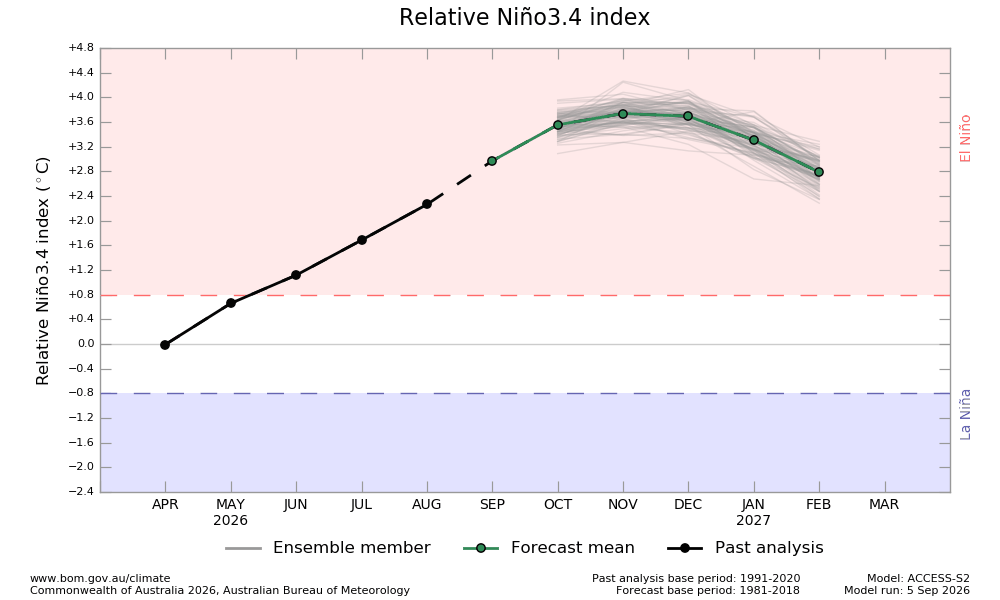
.png.c5db1e1c0a1a0869f36bc0c83d62cb0a.png)
-
Occasional Thoughts on Climate Change
donsutherland1 replied to donsutherland1's topic in Climate Change
Astra did a really good job.