All Activity
- Past hour
-
Honestly, I don't think we have another option.
-
Latest GOES-East update GOES-East, which is GOES-19, entered “Safehold” after a spacecraft anomaly. NOAA says the outage began at 4:23 p.m. EDT on Wednesday, July 15, 2026. All GOES-19 imagery and derived products are unavailable, including visible, infrared, water vapor and lightning data delivered to operational systems. What “Safehold” means Safehold is a protective spacecraft mode. The satellite automatically places itself in a stable, power-safe configuration when it detects a potentially serious problem. Normal observations and data transmission are usually suspended while engineers determine what triggered the event and carefully restore the spacecraft. NOAA’s latest official message says: Engineers confirmed GOES-19 is in Safehold. They are actively working to recover the satellite. The suspected source is the satellite or one of its instruments, rather than simply a website failure. The restoration time remains TBD, with no official recovery timeline yet. Is the satellite permanently damaged? There is no indication yet that GOES-19 is permanently lost. Safehold is designed specifically to protect a satellite during an anomaly. However, NOAA has not disclosed the underlying technical cause or provided an estimated return-to-service time. The most recent NOAA alert remains Update #1, issued July 15 at 6:16 p.m. EDT. No Update #2 or recovery announcement had been posted when I checked. What about the backup satellite? NOAA has GOES-16 in on-orbit storage as the designated backup for GOES-18 or GOES-19. It is positioned near 104.7°W, between the normal East and West locations. NOAA has not yet announced that GOES-16 is being activated or moved into the GOES-East position. Even when a backup is available, activating instruments, validating data and possibly repositioning the satellite can take time. There is also a separate NOAA STAR network-server problem disrupting some image production and website delivery. That issue may make NOAA web pages appear even more incomplete, but it is not the primary cause of the current GOES-East outage—the spacecraft itself is not transmitting data. Current status: GOES-19 remains in Safehold, all GOES-East products are unavailable, engineers are attempting recovery, and there is no estimated restoration time.
-
What is used instead for important matters that only visible sat products can provide? I can't ken this happening for so long before for GOES East.
-
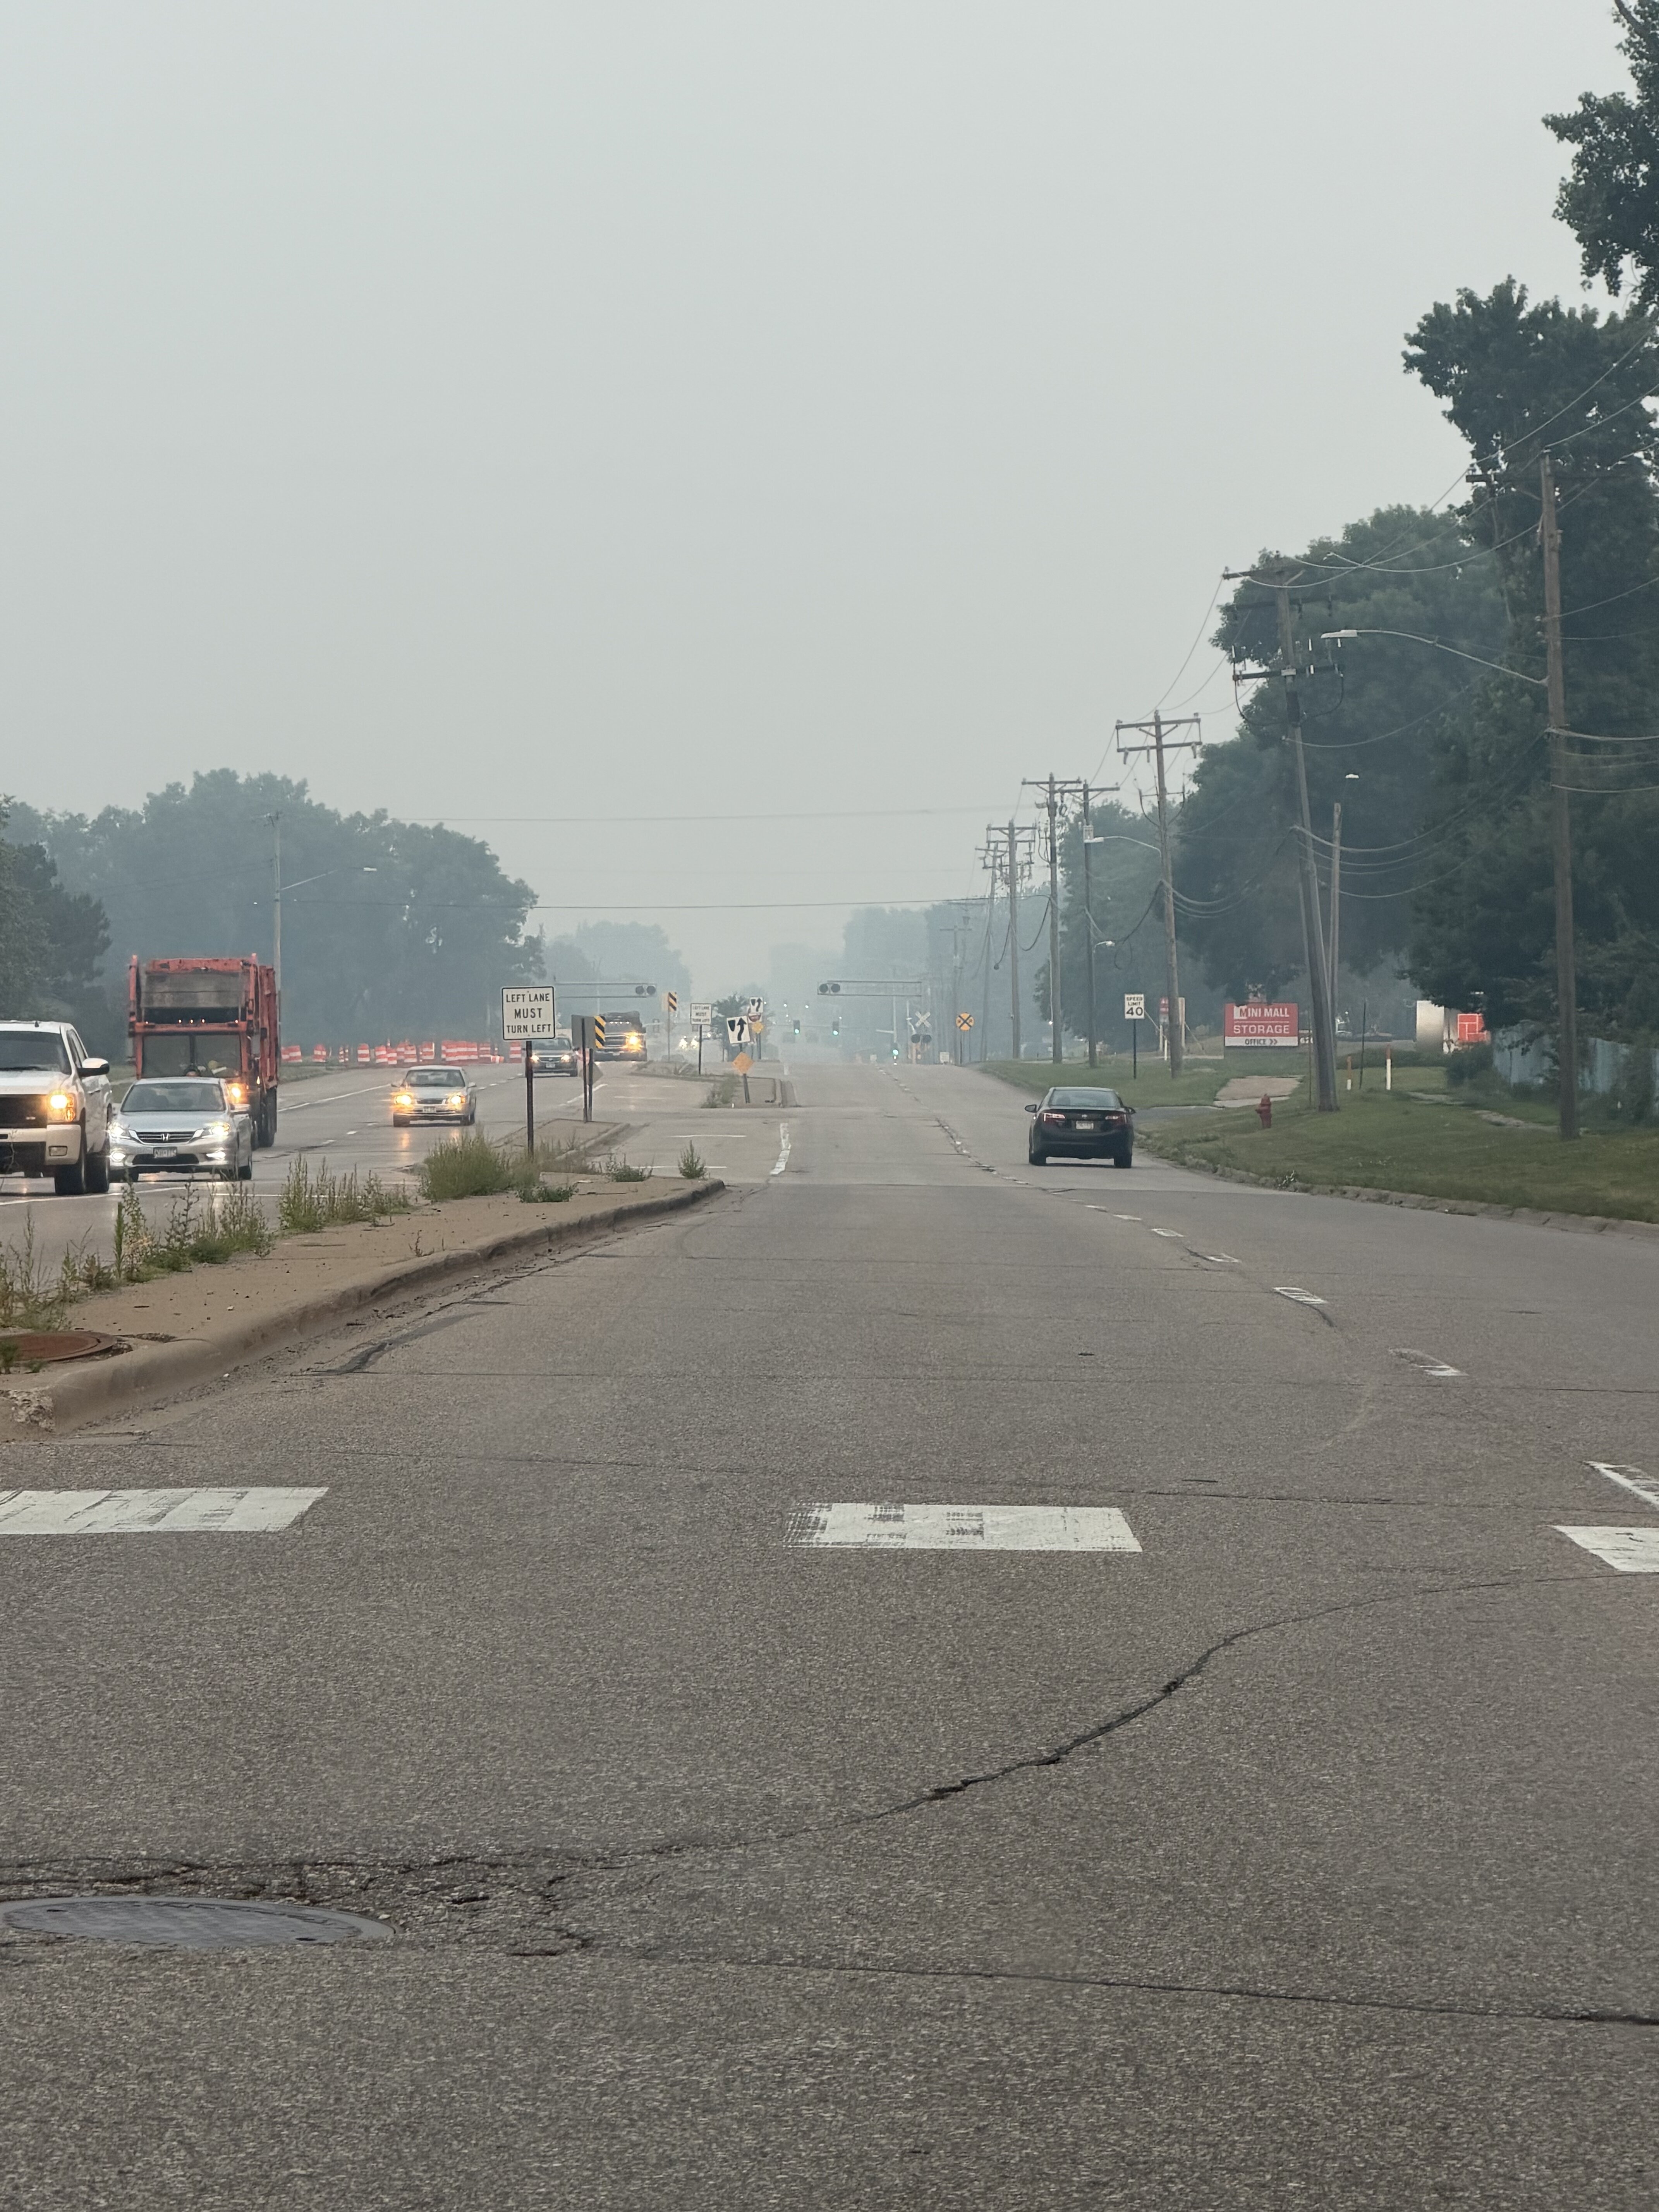
3/4SM here, its smoky inside the building even, its so bad.
-
GOES East is down, might be down for a bit too.
-
To be clear, IAD has never recorded an 80+ low for any day. The morning low was 81. The question is whether it falls below 80 by the end of the day. It did drop down to 79 last evening when the winds went calm, and then rose again before midnight.
-
Never lol, though there were a few more hazy days in the summer. Not sure I buy the improved pollution thing too much. There seems to be less of a vibrant blue sky than when I grew up, though my eyesight is not a strength of mine and there could be other reasons for it (more air traffic, cloud seeding, whatever).
-
Not being forced. I have stop work authority and plan on exercising it today.
-
COD sat imagery being down, sigh
-
Records: Highs: EWR: 104 (1995) NYC: 102 (1995) LGA: 103 (1995) JFK: 99 (1983) Lows: EWR: 55 (1940) NYC: 57 (1930) LGA: 62 (1960) JFK: 59 (1999) Historical: 1643: (July 5th on old Julian calendar) 1643, Plymouth Colony: A violent windstorm hits the Plymouth Colony, the "sudden gust" fells trees and kills one Native American. May have been first documented American tornado or microburst. (Ref. WxDoctor) 1901: The city of Marquette, Michigan set their all-time record high temperature with 108-degree reading. 1916 - A dying South Atlantic Coast storm produced torrential rains in the southern Appalachian Mountains. Altapass, NC, was drenched with more than 22 inches of rain, a 24 hour rainfall record for the state. Flooding resulted in considerable damage, particularly to railroads. (David Ludlum) 1936: Perhaps the hottest night ever recorded in the US outside of the desert Southwest, occurred at Lincoln, Nebraska when the minimum temperature fell to only 91°F. The citizens of that city spent the night outdoors trying to sleep on the lawn of the state capitol. (Nebraska State Historical Society) (Extreme Weather p. 30, by Christopher C. Burt) 1936: All-time record highs were set at the following cities: Quincy, IL: 114°, Peoria, IL: 113°, Lincoln, IL: 113° and Rockford, IL: 112°. Champaign, IL hit 107°. This stood as their all-time record until 1954. 1940: A cool 51° minimum temperature equaled July's record low on July 2nd in 1965 in Richmond, VA. (Ref. Richmond Weather Records - KRIC) 1954 - The temperature at Balcony Falls, VA, soared to 110 degrees to establish a state record. (The Weather Channel) 1976: Thunderstorms caused 76 mph winds at DCA and the highest since 98 mph winds were recorded in Hurricane Hazel in October 15, 1954. (Ref. Washington Weather Records - KDCA) 1980: Minneapolis, MN was plagued by severe thunderstorms that produced hail and tornadoes. Nearly 100,000 people were without power. Damage totaled over $43 million dollars. The city of Memphis, TN set their all-time record high temperature record with 108 °F and Albany, GA also set their all-time record high with 107 °F. (Ref. Wilson Wx. History) 1981: Daytona Beach, FL set their all-time record high with 102 °F. (Ref. Wilson Wx. History) 1983 - The Big Thompson Creek in Colorado flooded for the second time in seven years, claiming three lives, and filling the town of Estes Park with eight to ten feet of water. (The Weather Channel) 1987 - Unseasonably cool weather spread into the south central and eastern U.S. Fifteen cities reported record low temperatures for the date, including Houghton Lake, MI, with a reading of 37 degrees. The high temperature for the date of 58 degrees at Flint, MI, was their coolest of record for July. Thunderstorms spawned several tornadoes in Illinois and Indiana, injuring a cow near Donovan, IL. (The National Weather Summary) (Storm Data) 1988 - Twenty-six cities east of the Mississippi River reported record high temperatures for the date. Charleston, WV, established an all-time record high with a reading of 103 degrees, and Chicago, IL, reported a record fifth day of 100 degree heat for the year. A severe thunderstorm moving across Omaha, NE, and the Council Bluffs area of west central Iowa spawned three tornadoes which injured 88 persons, and also produced high winds which injured 18 others. Winds at the Omaha Eppley Airport reached 92 mph. Damage from the storm was estimated at 43 million dollars. (Storm Data) (The National Weather Summary) 1989 - Thunderstorms drenched Kansas City, MO, with 4.16 inches of rain, a record for the date. Two and a half inches of rain deluged the city between Noon and 1 PM. Afternoon thunderstorms in South Carolina deluged Williamstown with six inches of rain in ninety minutes, including four inches in little more than half an hour. (The National Weather Summary)(Storm Data) 1995: Upstate New York: A extremely severe derecho sweeps across upstate New York. Wind gusting to 106 mph devastates over one million acres (400,000 hectares) of trees, felling tens of millions. Five campers are killed by the falling timbers. (Ref. WxDoctor) 1995: Danbury, Connecticut: The highest temperature ever reported in Connecticut is 106 °F. (Ref. Lowest and Highest Temperatures for the 50 States) 1995: Dew points >80 degrees, with a date record high of 103 degrees gave Philadelphia, PA a heat index of 129 degrees. 40 people died from heat in SE PA; approx. 1 million PA chickens succumbed to the heat. Some highways (including I-83 in York County) closed due to heat buckling. (Weather Guide Calendar with Phenomenal Weather Events 2011 Accord Pub. 2010, USA) 2003: Phoenix, Arizona: A daily maximum temperature above 90°F is usually considered a hot day, but this date, the official minimum temperature at Phoenix Sky Harbor International Airport never dipped below 96°F. It is the highest low temperature in Phoenix history. (Ref. WxDoctor) 2006: Kelly Ranch/Usta set South Dakota’s ties high temperature record for SD with 120 °F. Pierre and Rapid City, SD sets their new all-time daily maximum temperature records with 117 °F and 111 °F respectively. Chadron, NE also set their all-time record high with 112 °F. Alliance, NE reported their second hottest day on record with 107 °F. Denver, CO set daily record highs on this date and the 16th with 101 °F and 103 °F respectively. (Ref. Wilson Wx. History)
-
76 / 70 cloudy / smoky. Satellites visible imagery down across the board (stuck on Jul 15) so clearing of clouds and mix of smoke will be key in extending the heat 90+. Same for Friday - hottest spots extend this current heat while other just short and smoke may further limit. Saturday trough pushes front through which is slow to pass with ridge resisting and could mean some hevaier rains for some locations. It does looks like we clear out of the smoke and rain/storms for Sunday and Metlide World cup finale. Overall near normal to slightly below 7/20 - 7/24, beyond there pending on the W. Atlantic Ridge more southerly flow could push lows and bring overall near - above normal with next chance of western heat 7/27 and beyond. No Satellite feed for today (yet) - This is real-time and when it comes back should update to 7-16
-
Central PA Summer 2026 Discussion/Obs Thread
Mount Joy Snowman replied to Voyager's topic in Upstate New York/Pennsylvania
Low of 74 as the smoke starts to roll in. The heaviest of it appears to be tonight through tomorrow morning. May be pretty rough on Saturday as well, although I imagine the rain will help with that. LNS and THV topped out at only 93 and 94 yesterday. -
Your forced to work in that? From COD: WTF? Where is the sight now?
-
sky is a milky grayish orange, and the smell of smoke is notable.
-

2026-2027 Super El Nino
csnavywx replied to Stormchaserchuck1's topic in Weather Forecasting and Discussion
Leaning towards it getting even stronger than the 1877-78 event, much less the 97/98 one, but that depends on whether or not we get any sort of pause in the WWB train/standing wave. That event was exotically warm across most of North America through the vast majority of the winter. In fact, farmers were planting their crops in Minnesota in February (yes, really). Article covering that from Mark Seeley out of the University of Minnesota: 1878 El Niño saw crops planted in February Texas itself was mild (relative to normal at the time) and very wet into the fall and especially winter. The current event you're suffering through is a side effect of a persistent rossby wave train that has set up in (at least in part) due to the response to the forcing induced by the developing Nino, but ENSO relationships in the summer are weaker and it's also partly just bad luck. -
 We have a lot of fixing to do.
 -
Driving into work this morning you couldn't even see Manhattan from the turnpike the smoke was so thick.
-
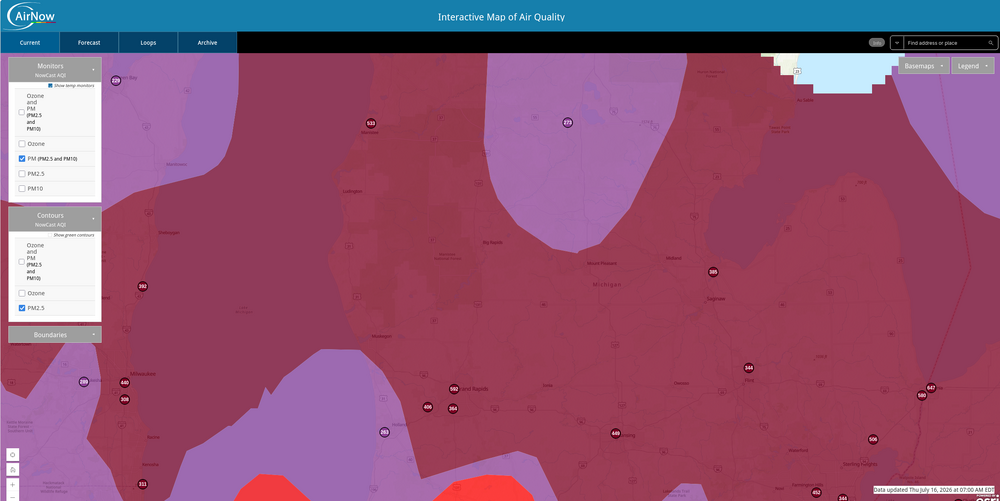
MI into PA looks p locked in with the sludge air today, rough
-
hey guys hope all is well and everyone's enjoying their summer. I was just wondering when do you think this smoke problem will go away?
-
Pretty nasty out there this morning
-
2026-2027 Super El Nino
40/70 Benchmark replied to Stormchaserchuck1's topic in Weather Forecasting and Discussion
Maybe it eventually becomes more east-based given how far east the warm pool is relative to other events, but right now at the surface this is clearly basin-wide and not as east-based as 1997. I have posted the weekly figures. It's similar to 2015. Do I think that this really matters? No, there is so much warm water throughout the ENSO basin. This all screams "variable pattern that is warm in the seasonal mean" to me. -
Vis 10 miles here with deep blue skies. Best climo.
-
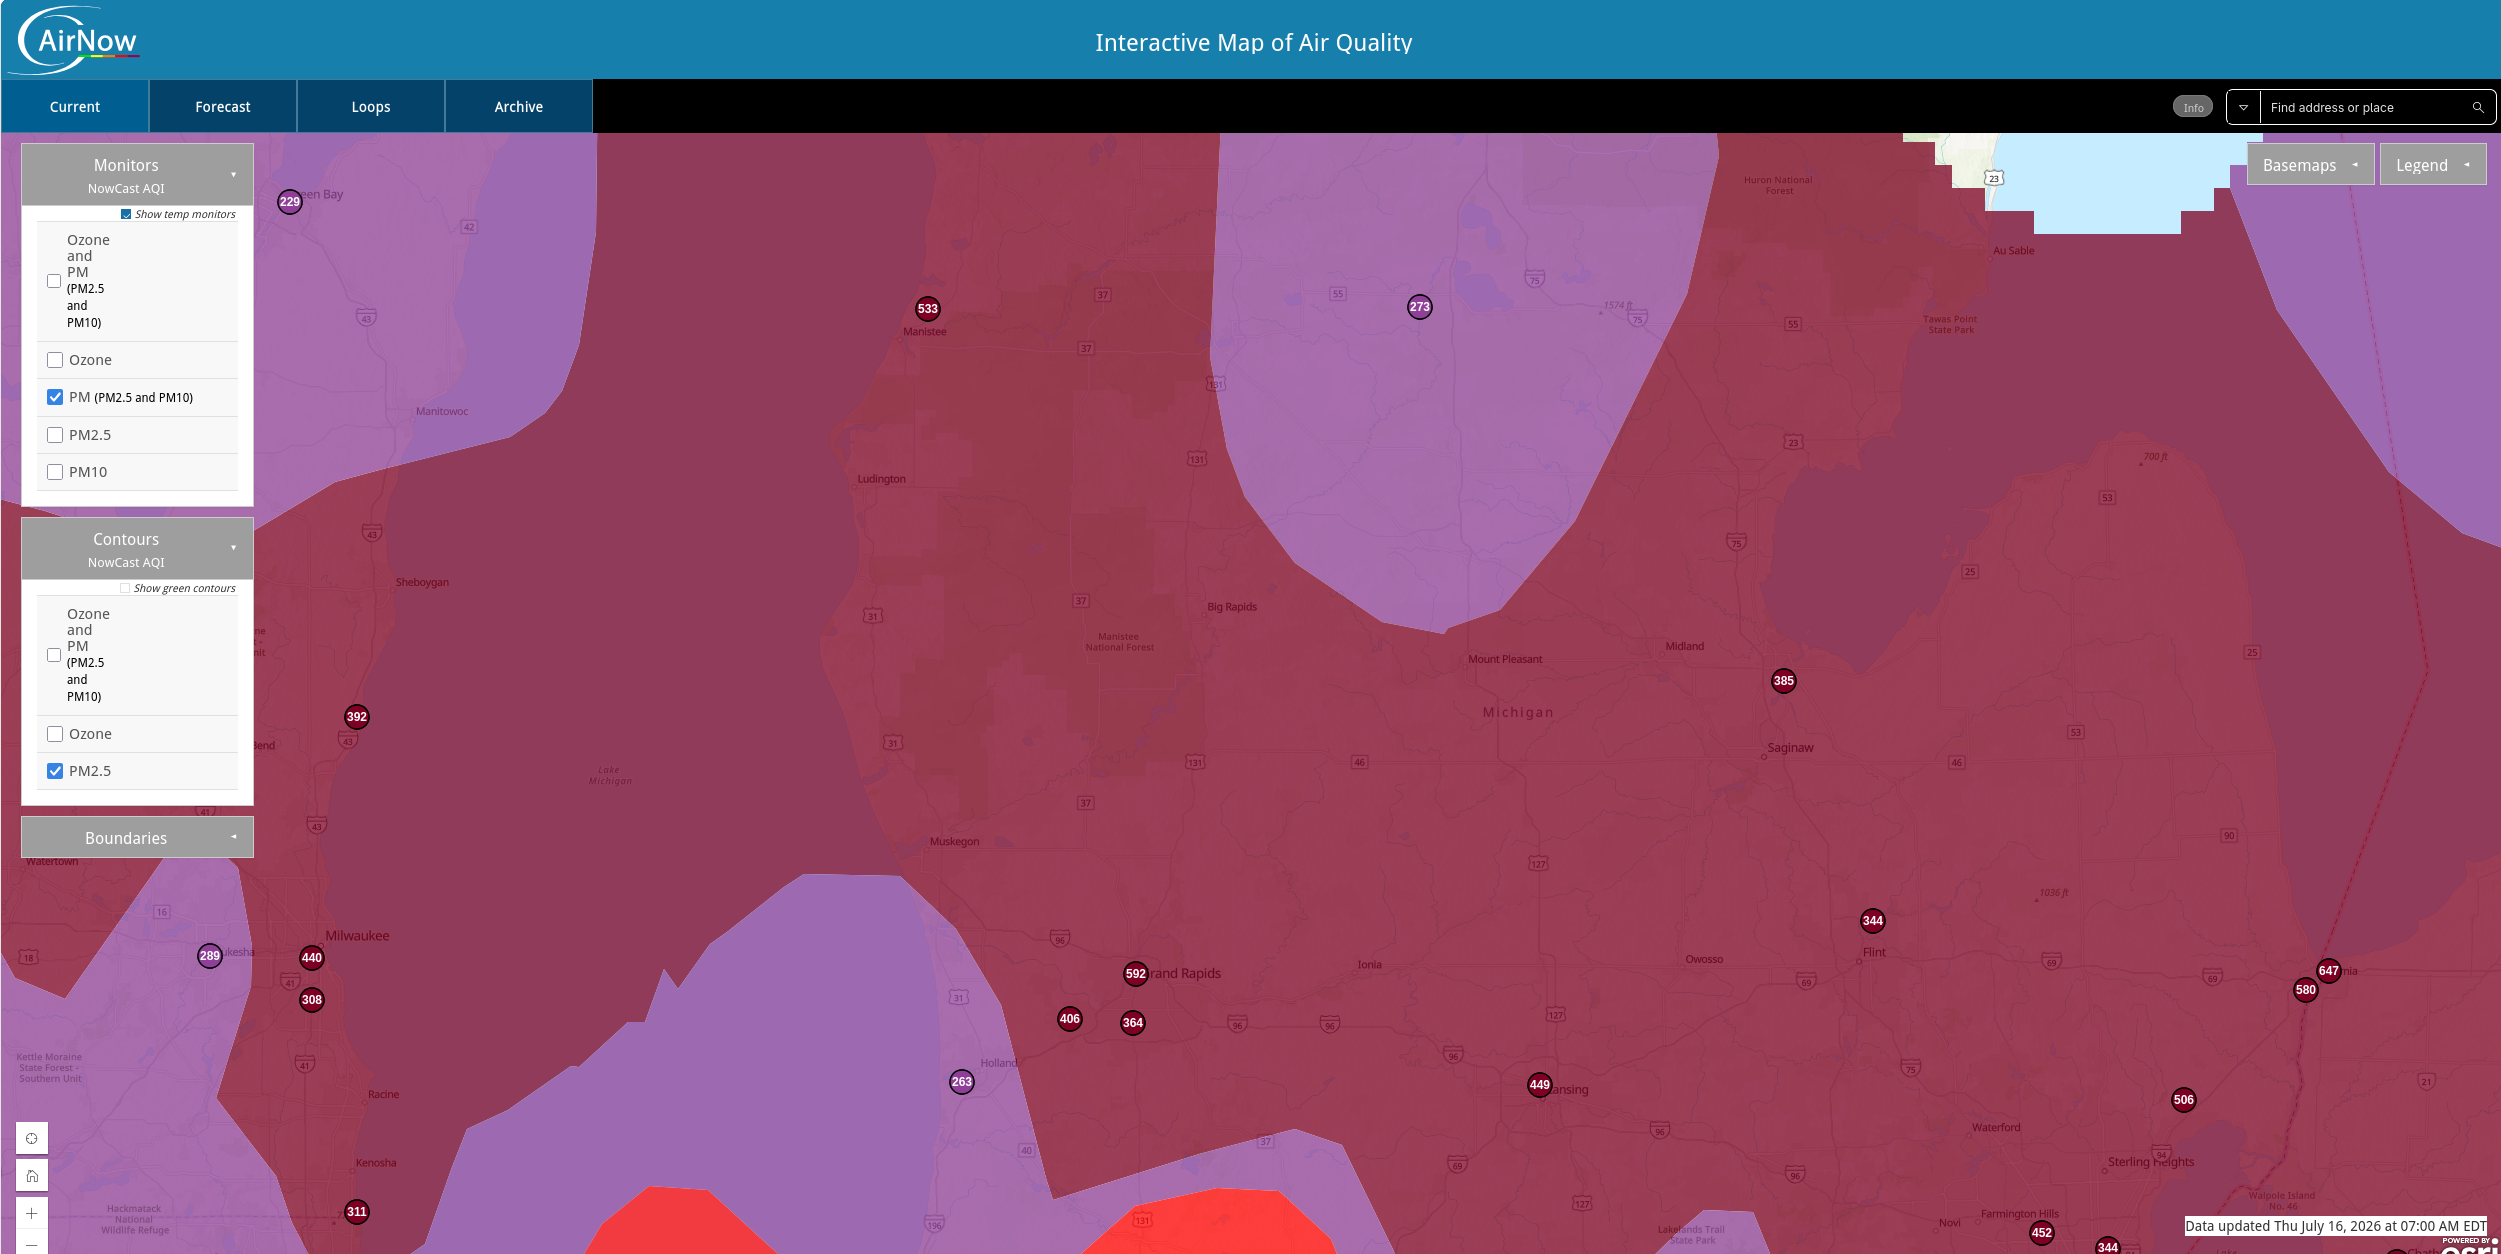
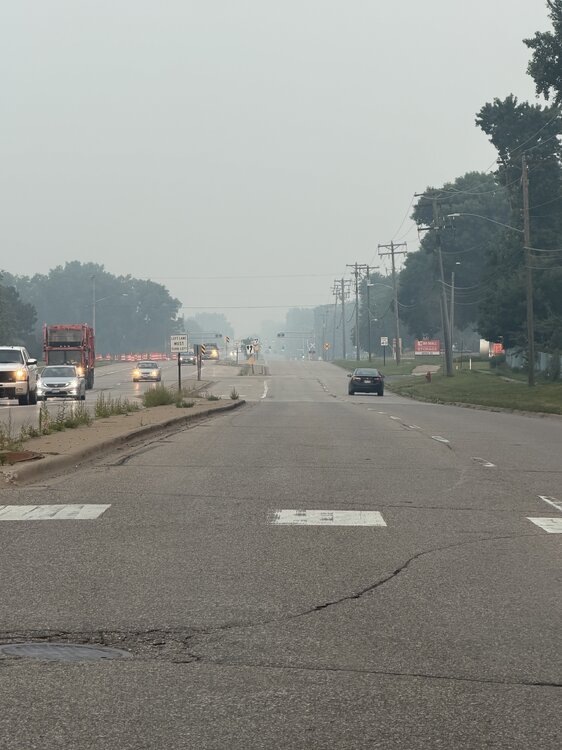
530 was the peak AQI in Minneapolis overnight. Eyes and throat burn working outside in this crap. Good times
-
2026-2027 Super El Nino
40/70 Benchmark replied to Stormchaserchuck1's topic in Weather Forecasting and Discussion
Clearly my early hunch was wrong, as is often the case. -
2026-2027 Super El Nino
40/70 Benchmark replied to Stormchaserchuck1's topic in Weather Forecasting and Discussion
They are touting the pattern in the composite of Super El Nino events as being comparable to the precursor pattern in SSW events, which when combined with W QBO favors a warming in January or February. While I agree that any warming will be during the second half, I can't help but question why we haven't actually seen any SSW during super El Nino events, despite the similarity to the precursor pattern....then don't address that. They are also focusing on the low arctic sea ice as a big factor to predisposing the PV to disruption.