All Activity
- Past hour
-

E PA/NJ/DE Summer 2026 Obs/Discussion
RedSky replied to PhiEaglesfan712's topic in Philadelphia Region
96/79 -
 94
94 -
Up to 101
-

2026-2027 Super El Nino
bluewave replied to Stormchaserchuck1's topic in Weather Forecasting and Discussion
It does happen occasionally and probably will again one of these years. But it’s a very low probability of success forecast any given year since 1993-1994. Only 4 seasons fell in this range from 1993-1994 to 2025-2026 vs 17 seasons from 1960-1961 to 1992-1993. NYC used to be clustered much closer to the middle 19-30 range in the previous 30 year period. So it was a good bet that you would be correct more often than in recent years calling for seasonal snowfall closer to the mid range or average of the distribution. These days most years are skewed toward the extreme ends of well above or well below average snowfall. Monthly Total Snowfall for NY CITY CENTRAL PARK, NY 19-30”seasons bolded Click column heading to sort ascending, click again to sort descending. 2025-2026 0.0 T 7.2 13.9 22.3 T 0.0 43.4 2024-2025 0.0 0.0 2.8 3.0 7.1 0.0 0.0 12.9 2023-2024 0.0 T T 2.3 5.2 T 0.0 7.5 2022-2023 0.0 0.0 T T 2.2 0.1 0.0 2.3 2021-2022 0.0 T 0.2 15.3 2.0 0.4 0.0 17.9 2020-2021 0.0 0.0 10.5 2.1 26.0 T 0.0 38.6 2019-2020 0.0 0.0 2.5 2.3 T T T 4.8 2018-2019 0.0 6.4 T 1.1 2.6 10.4 0.0 20.5 2017-2018 0.0 T 7.7 11.2 4.9 11.6 5.5 40.9 2016-2017 0.0 T 3.2 7.9 9.4 9.7 0.0 30.2 2015-2016 0.0 0.0 T 27.9 4.0 0.9 T 32.8 2014-2015 0.0 0.2 1.0 16.9 13.6 18.6 0.0 50.3 2013-2014 0.0 T 8.6 19.7 29.0 0.1 T 57.4 2012-2013 0.0 4.7 0.4 1.5 12.2 7.3 0.0 26.1 2011-2012 2.9 0.0 0.0 4.3 0.2 0.0 0.0 7.4 2010-2011 0.0 T 20.1 36.0 4.8 1.0 T 61.9 2009-2010 0.0 0.0 12.4 2.1 36.9 T 0.0 51.4 2008-2009 0.0 T 6.0 9.0 4.3 8.3 T 27.6 2007-2008 0.0 T 2.9 T 9.0 T 0.0 11.9 2006-2007 0.0 0.0 0.0 2.6 3.8 6.0 T 12.4 2005-2006 0.0 T 9.7 2.0 26.9 1.3 0.1 40.0 2004-2005 0.0 T 3.0 15.3 15.8 6.9 0.0 41.0 2003-2004 0.0 0.0 19.8 17.3 0.7 4.8 0.0 42.6 2002-2003 T T 11.0 4.7 26.1 3.5 4.0 49.3 2001-2002 0.0 0.0 T 3.5 T T T 3.5 2000-2001 T 0.0 13.4 8.3 9.5 3.8 0.0 35.0 1999-2000 0.0 0.0 T 9.5 5.2 0.4 1.2 16.3 1998-1999 0.0 0.0 2.0 4.5 1.7 4.5 0.0 12.7 1997-1998 0.0 T T 0.5 0.0 5.0 0.0 5.5 1996-1997 0.0 0.1 T 4.4 3.8 1.7 T 10.0 1995-1996 0.0 2.9 11.5 26.1 21.2 13.2 0.7 75.6 1994-1995 0.0 T T 0.2 11.6 T T 11.8 1993-1994 0.0 T 6.9 12.0 26.4 8.1 0.0 53.4 Monthly Total Snowfall for NY CITY CENTRAL PARK, NY Click column heading to sort ascending, click again to sort descending. 1992-1993 0.0 0.0 0.4 1.5 10.7 11.9 0.0 24.5 1991-1992 0.0 T 0.7 1.5 1.0 9.4 T 12.6 1990-1991 0.0 0.0 7.2 8.4 9.1 0.2 0.0 24.9 1989-1990 0.0 4.7 1.4 1.8 1.8 3.1 0.6 13.4 1988-1989 0.0 0.0 0.3 5.0 0.3 2.5 0.0 8.1 1987-1988 0.0 1.1 2.6 13.9 1.5 T 0.0 19.1 1986-1987 0.0 T 0.6 13.6 7.0 1.9 0.0 23.1 1985-1986 0.0 T 0.9 2.2 9.9 T T 13.0 1984-1985 0.0 T 5.5 8.4 10.0 0.2 T 24.1 1983-1984 0.0 T 1.6 11.7 0.2 11.9 0.0 25.4 1982-1983 0.0 0.0 3.0 1.9 21.5 T 0.8 27.2 1981-1982 0.0 0.0 2.1 11.8 0.4 0.7 9.6 24.6 1980-1981 0.0 T 2.8 8.0 T 8.6 0.0 19.4 1979-1980 T 0.0 3.5 2.0 2.7 4.6 T 12.8 1978-1979 0.0 2.2 0.5 6.6 20.1 T T 29.4 1977-1978 0.0 0.2 0.4 20.3 23.0 6.8 T 50.7 1976-1977 0.0 T 5.1 13.0 5.8 0.6 T 24.5 1975-1976 0.0 T 2.3 5.6 5.0 4.4 T 17.3 1974-1975 0.0 0.1 0.1 2.0 10.6 0.3 T 13.1 1973-1974 0.0 0.0 2.8 7.8 9.4 3.2 0.3 23.5 1972-1973 T T T 1.8 0.8 0.2 T 2.8 1971-1972 0.0 T T 2.8 17.8 2.3 T 22.9 1970-1971 0.0 0.0 2.4 11.4 T 1.3 0.4 15.5 1969-1970 0.0 T 6.8 8.4 6.4 4.0 T 25.6 1968-1969 0.0 T 7.0 1.0 16.6 5.6 0.0 30.2 1967-1968 0.0 3.2 5.5 3.6 1.1 6.1 0.0 19.5 1966-1967 0.0 0.0 9.1 1.4 23.6 17.4 T 51.5 1965-1966 T 0.0 T 11.6 9.8 T 0.0 21.4 1964-1965 0.0 0.0 3.1 14.8 2.5 2.8 1.2 24.4 1963-1964 0.0 T 11.3 13.3 14.1 6.0 T 44.7 1962-1963 T T 4.5 5.3 3.7 2.8 T 16.3 1961-1962 0.0 T 7.7 0.6 9.6 0.2 T 18.1 1960-1961 T 0.0 18.6 16.7 18.2 1.2 T 54.7 -
mm 21.5 C should get one to 39 C if the mixing hgt's to 850 sigma. The adiabat stops at 1000 ( you know this..), 36 C on the skew t log p diagram, but then the 1000 to absolute surface slopes to the right for 2 to 3 C (typically) in a fair expectation. That's about a buck-2 ... when you don't get outflowed overnight causing hard to prove lag holding you down LOL
-

Central PA Summer 2026 Discussion/Obs Thread
Storm Clouds replied to Voyager's topic in Upstate New York/Pennsylvania
Thanks! I’m not concerned with recording snowfall…measuring snowfall using a ruler or yardstick, yes haha. My old Davis couldn’t record snowfall either. I would forget to empty the gauge and on a warm day it would start recording rain from the snowmelt! -
Yeah IAD has no chance at 100 today. They were 3 under forecast yesterday too.
-
Correct. Apparent Temp is Heat Index and/or Wind Chill. Yes. It's what the NWS systems call it.
-
99 here as of noon. Dew Point 68 F Humidity 41 %
-
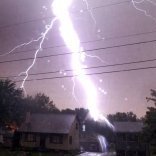
 Have to see exactly where the boundary ends up but the RRFS with some nasty storms rolling through later Saturday afternoon. I strongly recommend securing the grill unless you want it going airborne and it starts raining burgers and hot dogs all over.
 -
 I will say it’s a little strange to see LCI/AFN at 90 while the MRV hot spots of CON/MHT/ASH are 91….wonder if he have a little mixing boost still to go this afternoon like we did yesterday.
 -
No they're not all sited properly, you can usually pick out the problem ones like that one.
-
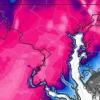
Heat indexes are 120+ in that very southwest corner of NJ. Must be a lot of corn or some other local confluence. Readings are 105-115 elsewhere. The humidity so far does not seem any less today. Without clouds, someone makes a run at 105-107 on official stations. Stay hydrated.
-
Mostly cloudy here now. Boooo lol
-

Central PA Summer 2026 Discussion/Obs Thread
Voyager replied to Voyager's topic in Upstate New York/Pennsylvania
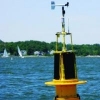
As Canderson said, I have the Tempest station. I like it a lot, but with the hepatic rain gauge, you're not going to get accurate winter precipitation readings, as the snowflakes aren't heavy enough to trip the sensors. You'll need a separate gauge to melt and record snow. -
I liked 98-100 for awhile given the 850s up here of 21-22C. NYC-NJ was more in that 23-24C zone with spotty 25C.
-
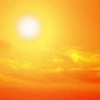
Big hit in the Summer of 1966..one of the hottest summers on record..feels that way today!!
-
This is what it's like around here when it comes to tracking big heat I've come to find over the years. It's like the 2026 Red Sox: they always find a way to lose. Then they'll sweep the Yankees in a 4 game series. That's like when we're supposed to be 88 but we get a 97 - amazing but ultimately not amazing. I knew this in my partial wakened state overnight .. that those gentle rains and barely audible thunder rumbles were gently destroying the heat extremes today. Figured
-
Believe EWR hit 100 between hours or the 11:51 reading New Brnswck to 101
-
Corona: 100 on mesonet and I'm about to head out into it to get lunch
-
Down to 91/78 but feels like 106 Maxed at 94 here, ISP hit 97 with compressional heating from the sea breeze front. It's now down to 92/78 Traded off higher temps for higher dews near 80
-
noon Round up hot town summer i the city New Brnswck: 100 JFK: 100 EWR: 99 ACY: 99 BLM: 97 TEB: 97 PHL: 97 LGA: 96 NYC: 96 TTN: 95 ISP: 92
-
All I know is it damn hot out
-
I'm thinking that boat sailed when that outflow came throughout overnight -
-
107 in Hillside NJ ?? Hillside, NJ Weather Conditions | Weather Underground