All Activity
- Past hour
-

July 2025 Obs/Disco ... possible historic month for heat
powderfreak replied to Typhoon Tip's topic in New England
That’s crazy. They keep popping wild highs during these 90+ days. -

July 2025 Obs/Disco ... possible historic month for heat
weatherwiz replied to Typhoon Tip's topic in New England
Despite whatever pretty blues people want to find, the regime and theme is going to continue well into August which is above average and humid. Any pretty blues aren't from a change in pattern, its just the product of an airmass advecting in behind a FROPA which is then replaced with the overall theme once the heights reset. -
Got down to 72 here. It’s 79 at 8:50 and very humid
-

July 2025 Obs/Disco ... possible historic month for heat
Lava Rock replied to Typhoon Tip's topic in New England
Oh yeah, Monday was gusty there. Be out on long lake tomorrow. Looking stellar Sent from my SM-S921U using Tapatalk -

July 2025 Obs/Disco ... possible historic month for heat
Typhoon Tip replied to Typhoon Tip's topic in New England
GEFs, GEPS and EPS means all with a three run warming trend Monday and Tuesday. GEFs in particular are sending mid upper 90s Tuesday by 18z. Wednesday is the hold out on a heat wave officially. Marginal due to front or convection... From this range, timing any summer front can be even more difficult at D5 as convection processing muddles what's happening in the physical processing of the models. Fair confidence in a pattern change - if perhaps temporarily - by mid week, though, so we're clearing the slate with a reprieve heat/dews for 2 or 3 days after Wednesday most likely. Beyond which skill pretty much does not exist. Fwiw, the GEFs signals heat return, while the Euro cluster does not. The operational GFS was the warmest model I saw for the Mon-Wed period, making low 90, upper 90s, and around 90. -

July 2025 Obs/Disco ... possible historic month for heat
dendrite replied to Typhoon Tip's topic in New England
Yeah when I looked last time I expected a smoking gun and saw nada. -
Hoping for some good rains today and tomorrow
-
I was thinking this last week. I usually set the cutting height on my mower low in spring, and then when the hot/dry comes along I start cutting it higher. Typically in June. But this year I'm still stuck on the low cut. It think in a week or 2 it will slow down. At least at my location.
-

July 2025 Obs/Disco ... possible historic month for heat
mreaves replied to Typhoon Tip's topic in New England
I was thinking of you when I drove through Naples on Monday. The waves were pretty big on Long Lake. I'm guessing 2'-3', though I'm not a boater so I don't have a great grasp on estimating wave height. I just know that it looked like it would have been a rough day out on the water. -
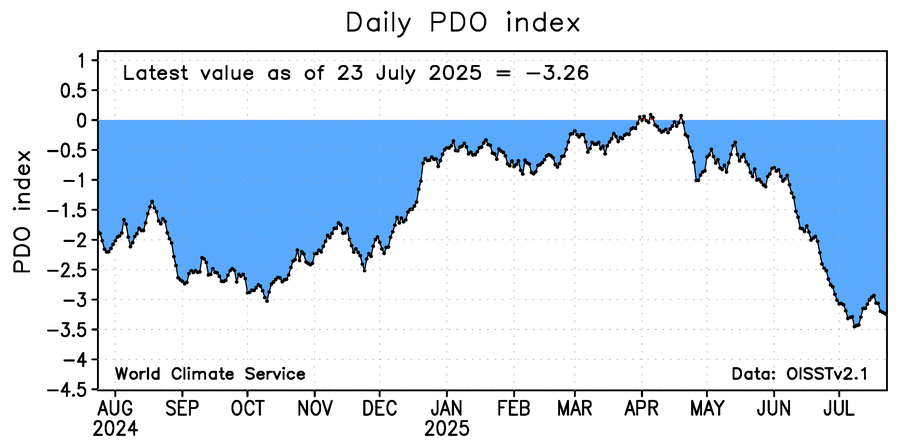
Currently, the equivalent NOAA version of the PDO based on recent relationship to WCS is likely not far from -4. The record low monthly NOAA PDO through June of 2025 is ~-3.8.
-

July 2025 Obs/Disco ... possible historic month for heat
ineedsnow replied to Typhoon Tip's topic in New England
Ya today looks meh for anything good.. everything I've looked at looks isolated -

July 2025 Discussion-OBS - seasonable summer variability
Sundog replied to wdrag's topic in New York City Metro
Summer rains are almost always hit and miss and coverage can vary. Some spots are browning, others are good. -

July 2025 Discussion-OBS - seasonable summer variability
donsutherland1 replied to wdrag's topic in New York City Metro
Thank you. I will have to check it out once I get back from Maine next week. -

Central PA Summer 2025
Mount Joy Snowman replied to Voyager's topic in Upstate New York/Pennsylvania
Low of 70 with dew points on the rise. -
The July -PDO will be one of the lowest we have seen as the record marine heatwave near Japan continues.
-
July 2025 Obs/Disco ... possible historic month for heat
weatherwiz replied to Typhoon Tip's topic in New England
I'm also hoping we can pull out something in the Tuesday-Wednesday time frame. This is going to require getting everything timed perfectly which is not the case right now but still a few days to watch. Problem though is best dynamics are just behind the front and that's not something that usually changes over time. -
July 2025 Obs/Disco ... possible historic month for heat
weatherwiz replied to Typhoon Tip's topic in New England
That's where the CAMs seem to hit at strongest theta-e advection and moisture pooling. You'll also probably have some sort of sea-breeze boundary to aid in forcing -

July 2025 Obs/Disco ... possible historic month for heat
OceanStWx replied to Typhoon Tip's topic in New England
It seems like CAMs are leaning towards an RI to Cape cluster and that may be the only show. -
July 2025 Obs/Disco ... possible historic month for heat
OceanStWx replied to Typhoon Tip's topic in New England
I just don't see the surface convergence to pop storms off in a big way around these parts. -

July 2025 Discussion-OBS - seasonable summer variability
bluewave replied to wdrag's topic in New York City Metro
The last cool summer here was in 2014. But it wasn’t as cool as 2009 which had the coolest June and July since the 1940s. Our summers switched to much warmer and 2010. So there have been no cool summers with 15 or lower 90° days since the 15-16 baseline jump in temperatures. We would frequently get a few warmer summers followed a much cooler one. Now it’s all well above the historical 90° norms with no cool summers anymore. As you can see on the charts below, we had plenty of those cooler summers in the 1940s and 1950s. Time Series Summary for NEWARK LIBERTY INTL AP, NJ - Jan through Dec Click column heading to sort ascending, click again to sort descending. 1 1967 7 0 2 1996 9 0 3 1985 11 0 4 1982 12 0 - 1975 12 0 - 1946 12 0 7 2004 13 0 8 2009 14 0 - 1962 14 0 - 1956 14 0 11 2014 15 0 - 1976 15 0 - 1969 15 0 - 1960 15 0 - 1942 15 0 - 1940 15 0 Coldest June-July since 1940Time Series Summary for NEWARK LIBERTY INTL AP, NJ Click column heading to sort ascending, click again to sort descending. 1 1940-07-31 71.5 0 2 2009-07-31 71.6 0 3 1947-07-31 71.7 0 4 1958-07-31 72.2 0 - 1946-07-31 72.2 0 5 1945-07-31 72.4 0 6 1956-07-31 72.5 0 7 1985-07-31 72.8 0 8 1951-07-31 72.9 0 - 1950-07-31 72.9 0 - 1941-07-31 72.9 0 9 2000-07-31 73.0 0 10 1967-07-31 73.1 0 - 1962-07-31 73.1 0 - 1948-07-31 73.1 0 - 1942-07-31 73.1 0 -
July 2025 Obs/Disco ... possible historic month for heat
weatherwiz replied to Typhoon Tip's topic in New England
That's probably the only hope. I guess the NAM is out to lunch with those dewpoints but if we can pool the dewpoints it may be a little more interesting. I still wouldn't be shocked if we were to see a line organize across southern CT into RI but yeah shear is weaker farther south...maybe just enough to help updrafts organize. Looks like convergence along the front is a big issue -
July 2025 Obs/Disco ... possible historic month for heat
Lava Rock replied to Typhoon Tip's topic in New England
heading out on casco bay at noon for a few hrs. looks like we should ok on the wx side of things -

July 2025 Obs/Disco ... possible historic month for heat
Damage In Tolland replied to Typhoon Tip's topic in New England
When all Mesos only show very isolated stuff it’s time to pick up ball and head to Stein’s house -
July 2025 Obs/Disco ... possible historic month for heat
OceanStWx replied to Typhoon Tip's topic in New England
The crazy thing is nothing really stands out from the last year. If anything their daytime temps are cooler relative to surrounding sites than they were last summer. -
July 2025 Obs/Disco ... possible historic month for heat
OceanStWx replied to Typhoon Tip's topic in New England
Heavy, heavy meh. Maybe you can get the moisture to pool enough in SNE for something, but then the shear is only so-so.


