All Activity
- Past hour
-

July 2025 Obs/Disco ... possible historic month for heat
Torch Tiger replied to Typhoon Tip's topic in New England
A few light storms, nothing too heavy. -
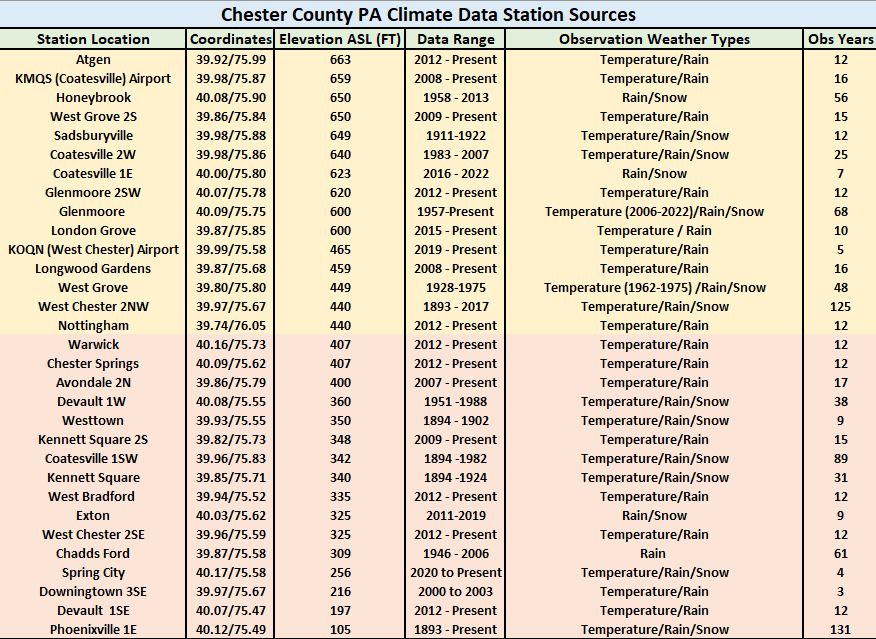
 Look at how close these 2 stations are in NE Chesco....certainly not representative of the county climate
-

July 2025 Obs/Disco ... possible historic month for heat
dendrite replied to Typhoon Tip's topic in New England
Contoocook reporting 1/2” hail again -

July 2025 Discussion-OBS - seasonable summer variability
Brian5671 replied to wdrag's topic in New York City Metro
Looks pretty isolated on the HRRR -

July 2025 Obs/Disco ... possible historic month for heat
Typhoon Tip replied to Typhoon Tip's topic in New England
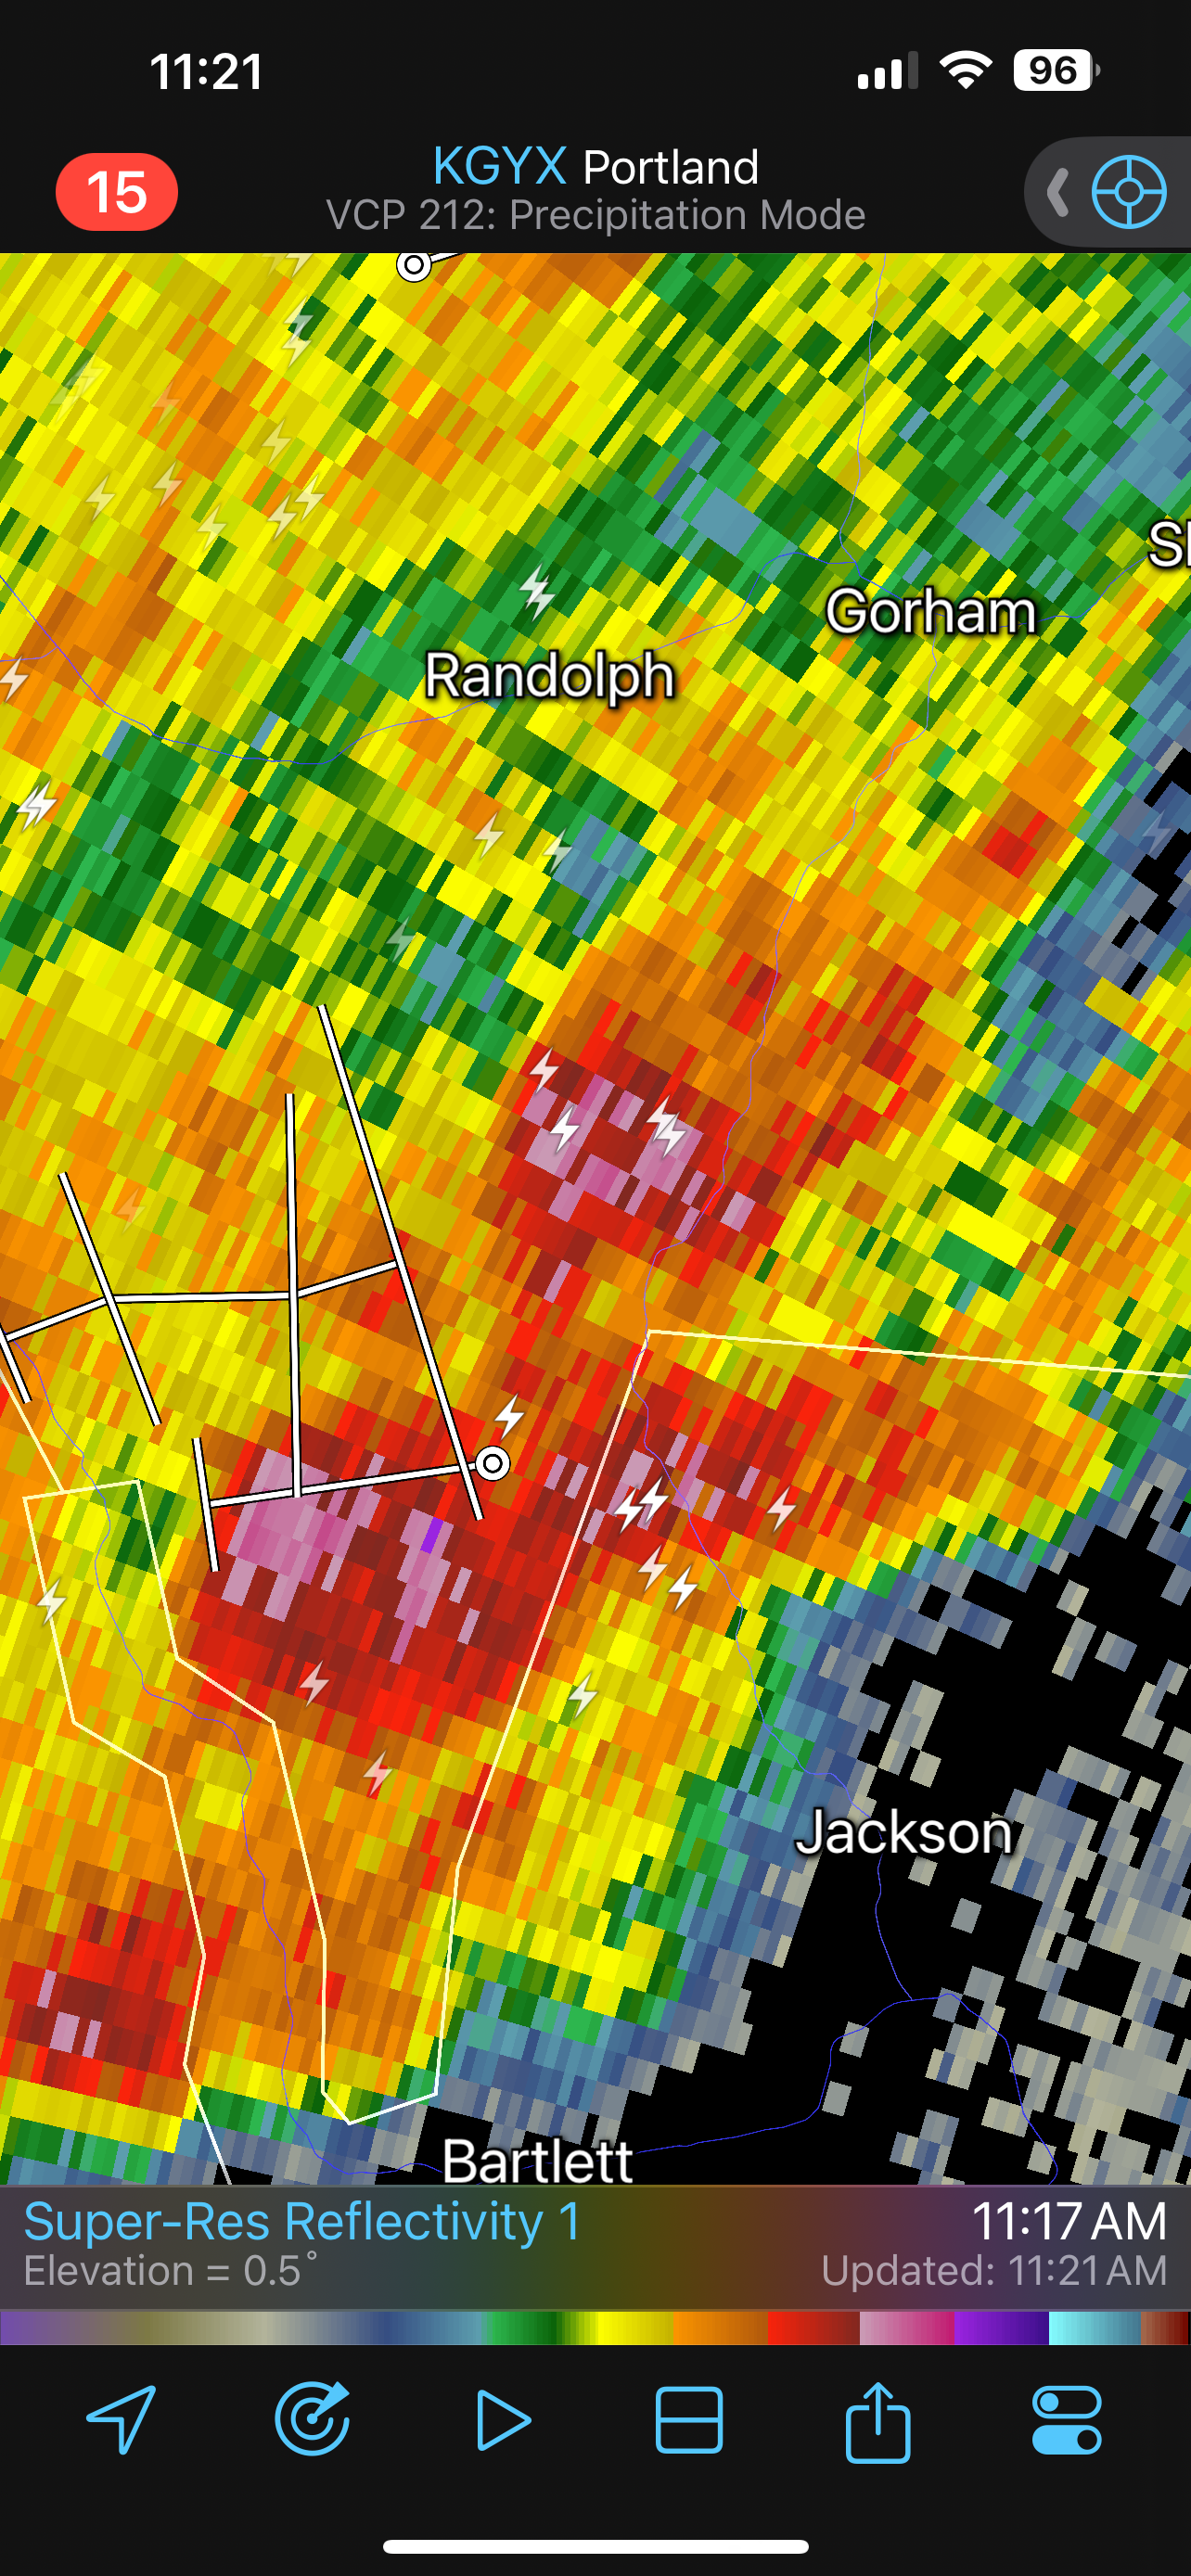
Impressive CB structures visible here on the NW-N horizon associated with that... I can also see TCU ( new) just up the way so I suspect Rt 2 may take off down here soon -
July 2025 Obs/Disco ... possible historic month for heat
dendrite replied to Typhoon Tip's topic in New England
Shit I don’t need hail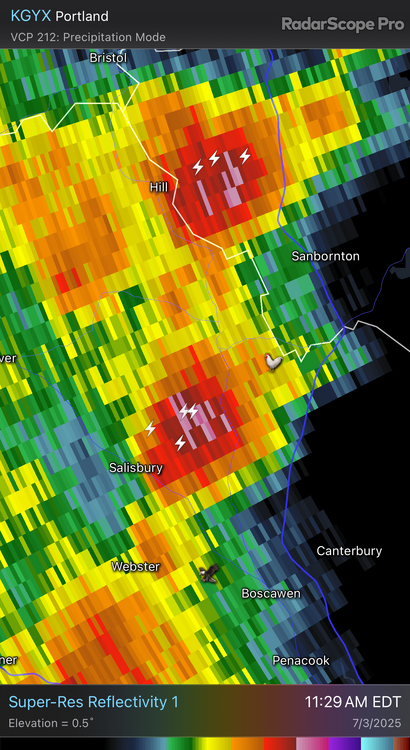
-
July 2025 Obs/Disco ... possible historic month for heat
dendrite replied to Typhoon Tip's topic in New England
Almost 80dBZ up in the county must’ve been fun -

2025 Spring/Summer Mountain Thread
BlueRidgeFolklore replied to Maggie Valley Steve's topic in Southeastern States
Pretty weird seeing the Southern Escarpment so dry. -

July 2025 Discussion-OBS - seasonable summer variability
STORMANLI replied to wdrag's topic in New York City Metro
Not sure if any activity makes it here before 630pm and watching Dews drop or at all. -

July 2025 Obs/Disco ... possible historic month for heat
Chrisrotary12 replied to Typhoon Tip's topic in New England
NNE round 1. -
The Phoenixville and Spring City sites that are now the only remaining NWS COOP stations of course run warmer than all other stations in 24 of the last 25 years. On average a 0.8 degree variation. With those sites running as much as 3 degrees too warm in one year and at least a degree warmer in 15 of those years!! Makes very little sense as these 2 stations are much lower in elevation and near each other in the Northeastern section of Chester County....yet these are the 2 stations that NCEI will use to calculate their county averages.....call me stunned!! LOL!

-

July 2025 Obs/Disco ... possible historic month for heat
dryslot replied to Typhoon Tip's topic in New England
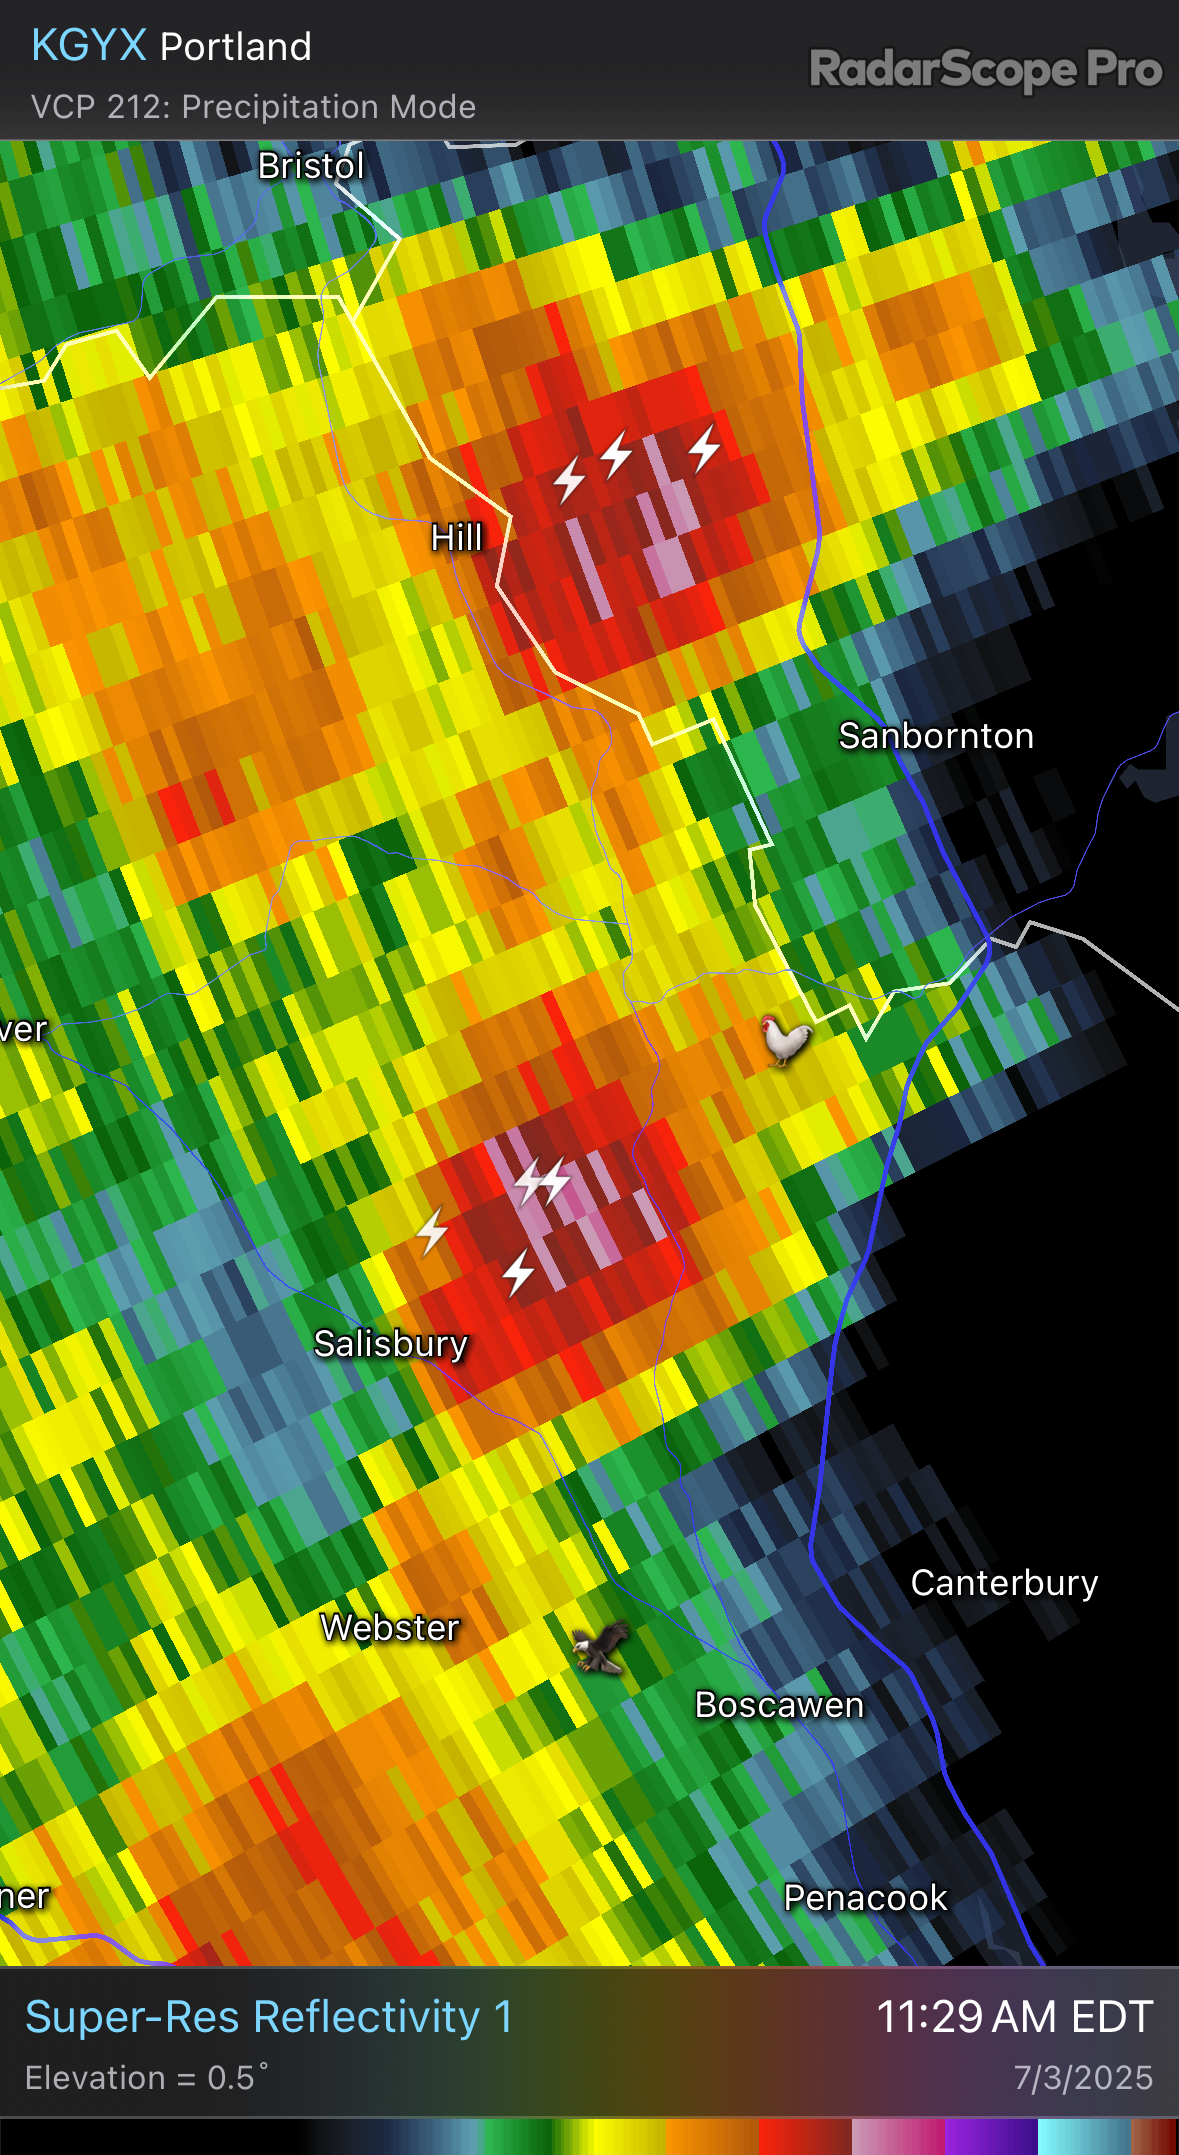
Those cell's near Berlin went severe with some hail in them.
-
July 2025 Obs/Disco ... possible historic month for heat
dendrite replied to Typhoon Tip's topic in New England
Let’s wash out Center Harbor and the Weirs again
-
I see the pol thread got nuked lol
-

July 2025 Discussion-OBS - seasonable summer variability
JonClaw replied to wdrag's topic in New York City Metro
GFS has dewpoints getting into the mid-50s tomorrow. It'll be a pleasant 4th. -
2025 Spring/Summer Mountain Thread
wncsnow replied to Maggie Valley Steve's topic in Southeastern States
Didn't realize some of the SW mountains were below this much for June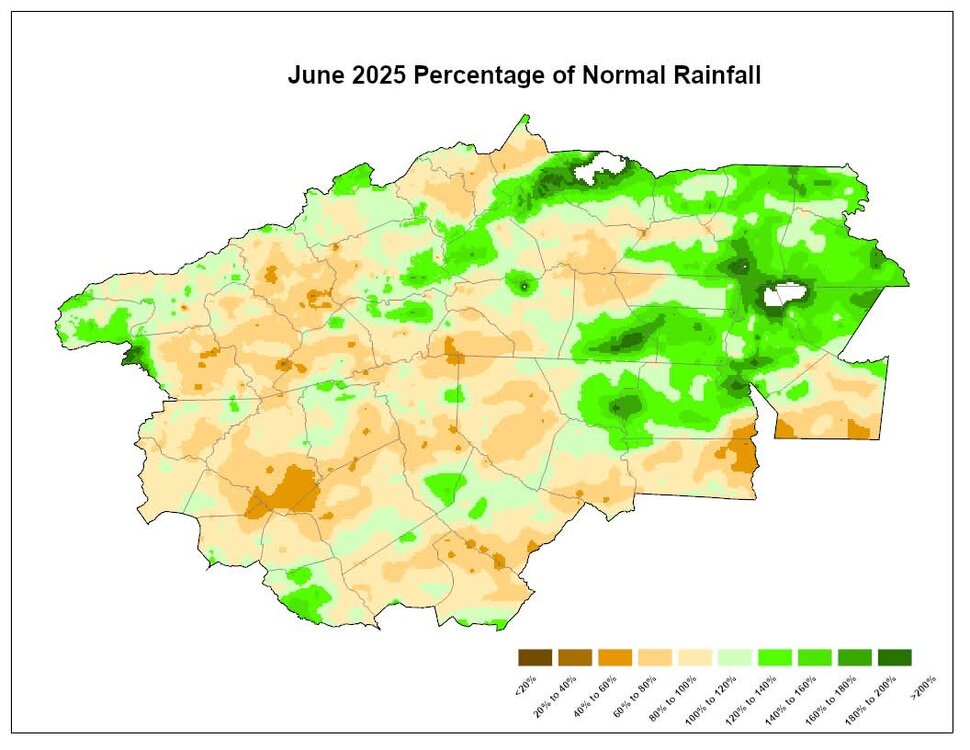
-
Below are the stations used and dates operational
-

2025-2026 ENSO
PhiEaglesfan712 replied to 40/70 Benchmark's topic in Weather Forecasting and Discussion
Oh gosh, I hope not. There is nothing more depressing than that combination. I'll take a colder than average January, December, heck even November or October. Even a 2011-12 type winter would be better than this. A colder than average March after an above average Dec-Feb would be a complete waste. -
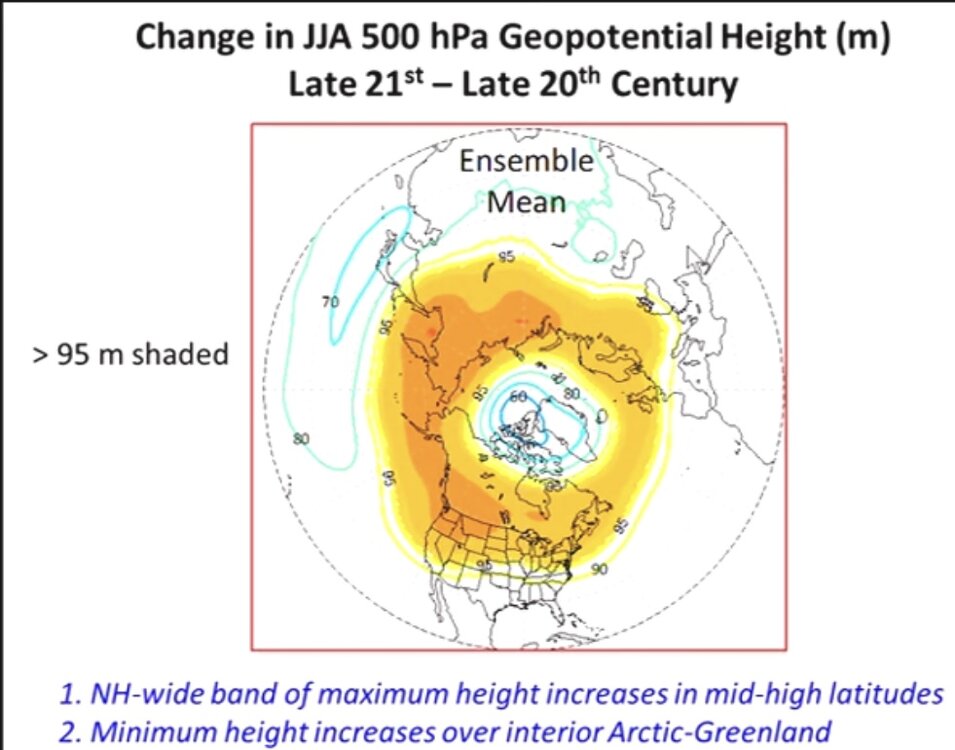
The ridge is verifying further south toward the subtropics than the climate models have been forecasting. They theorize that this pattern is related to decreasing snow and sea ice. But I think it could be driven by the subtropics and tropics forcing a 500mb standing wave pattern. Perhaps, there is an interplay at work between all the regions which the climate models haven’t able to pick up on. In any event, the study below came out in 2014 and we have been seeing this pattern quite a bit in recent years. So the forecast from 2014 picked up in something happening in the climate system even though it’s could very well be an incomplete assessment.
-

July 2025 Obs/Disco ... possible historic month for heat
weatherwiz replied to Typhoon Tip's topic in New England
Looks like we should be solidly above average, even behind any FROPAs...the only thing we'll noticeably have is a brief period of lower dews. People could call this cheap or whatever because it could be alot of 90/91's but some of the typical torch spots will have a good shot to rack up some 90's over the next few weeks. A quick glimpse of the pattern too should yield hope for MCS potential but we probably get screwed and everything goes from northern Plains, upper-Midwest, Ohio Valley -
 Taking a look at the actual data, I was largely able to replicate NOAA's rankings/values from the raw data back to at least 2000. I limited this to 25 years, because it would be a big undertaking to expand significantly beyond that and you run into more data discontinuities as you head back in time. In the "Occasional Thoughts on CC" thread, user @ChescoWx claims an actual summertime mean of 72.8F for the 2000s, 73.2F for the 2010s, and 73.5F for the 2020s, which it is claimed that NOAA alters to 73.1F, 73.9F, and 74.1F. Limiting the analysis to actual NOAA stations, I calculate a summertime mean of 73.1F, 73.9F, and 74.4F for the three decades, the first two exactly matching the reported and the current decade actually slightly warmer than reported. It appears those values are calculated only by adding in stations that aren't included in the NOAA analysis - mesonets, secondary airports (AWOS sites?), perhaps personal weather stations. I'm not sure what's going on. In my analysis, I have data for Phoenixville 1E for 2000-2024, West Chester 2 NW for 2000-2016, Coatesville 2 W for 2000-2007, Avondale 2 N for 2006-2024, and Spring City 2 WSW for 2023-2024. Looking at this basket of stations, Phoenixville 1 E looks to be the warmest, followed by West Chester 2 NW, then Coatesville 2 W, then Avondale 2 N, and Spring City 2 WSW. So it looks like the station mix has gotten cooler with time with the Coatesville and West Chester sites gradually swapped out for the cooler Avondale and Spring City sites, so I would expect homogenization to increase the recent temperatures and/or decrease the older temperatures, but the opposite is true, with the older temperatures equal to the true mean and recent temperatures slightly chilled from the true mean. If anything, it looks like the NOAA trend for Chester County is slightly low for the most recent 25 summers?
 -
July 2025 Obs/Disco ... possible historic month for heat
Typhoon Tip replied to Typhoon Tip's topic in New England
Next chance for a heat wave is Sun-Mon-Tue ... Tuesday's a bit of a wild card. May fail, but Sun-Mon are modeled as low or middle 90s. Beyond that... there doesn't appear to be an ensemble supported cooler transport, so it's not clear how far down toward normal the ambience will settle off. It may in fact stay modestly above normal during the remainder of the week. Beyond that...watching for the possibility of a newer warm ridge emergence. The spatial synoptic layout of the ensemble, particularly in the EPS mean, for that that period show a distinct tendency for lowering heights in the Pac Nw... At this time of year that teleconnects to a ridge in the mid lat continent down stream. We're talking D10+ so the operational runs don't really have any responsibility to necessarily show that - so we'll see. But that tendency preceded the eventual emergence of the bigger heat event recently when it too was in the 10 day to 2 week lead, but only vaguely. It seems to be this is a leitmotif so far this warm season - could be an indicator for a warm summer if that continues. In the meantime, I do suspect we'll have to contend with bigger heat once or twice during these next 3 weeks at some point. -

July 2025 Discussion-OBS - seasonable summer variability
SACRUS replied to wdrag's topic in New York City Metro
87 / 60 here -

July 2025 Discussion-OBS - seasonable summer variability
winterwx21 replied to wdrag's topic in New York City Metro
Should hit at least 90 here today, but the dewwpoint is down to 62. Doesn't feel bad out there with the lower humidity. Severe weather risk this evening, but it looks like just isolated activity and more likely to the north. -

2025-2026 ENSO
Stormchaserchuck1 replied to 40/70 Benchmark's topic in Weather Forecasting and Discussion
It's not often that you see the cold anomaly max (Iceland) exceed the warm anomaly max in the Northern Hemisphere! (Although the relative value of Europe ridge because it was further south is greater).