All Activity
- Past hour
-
2026-2027 Super El Nino
40/70 Benchmark replied to Stormchaserchuck1's topic in Weather Forecasting and Discussion
Just brutal; the world stopped with the discontinuation of NCAR. -

2026-2027 Super El Nino
Stormchaserchuck1 replied to Stormchaserchuck1's topic in Weather Forecasting and Discussion
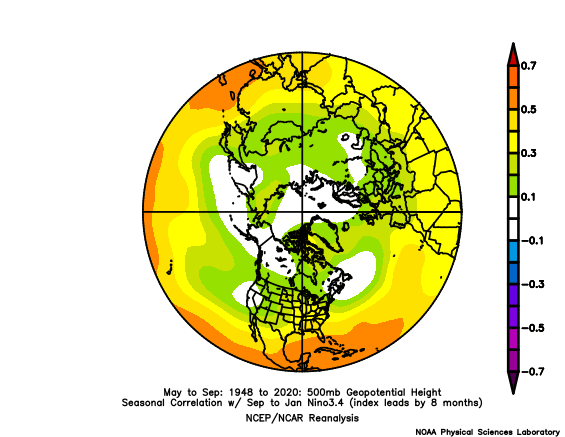
I am so curious to see what pattern we have over the Arctic next Summer after this Super, perhaps record breaking El Nino. The correlation with Nino 1+2 +time is fairly weak Nino 3.4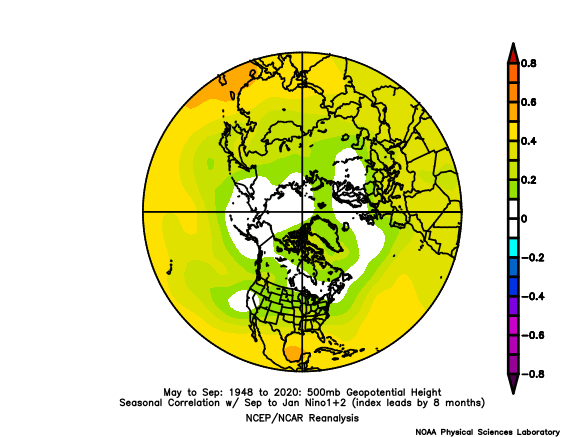
-

2026-2027 Super El Nino
GaWx replied to Stormchaserchuck1's topic in Weather Forecasting and Discussion
Thanks, Adam. For the period May-July, we’re likely headed to ~-22 avg SOI. One has to go all of the way back to 1905 to find any year at -22 or lower for May-July! Then it was -27. But that was a second year Niño (moderate). The only other one was in 1896, a strong Nino. That was at -28. Per Eric Webb’s tables, 1894-5 barely missed a low end weak Nino because there were only 4 tri-months in a row of +0.5 surrounded by +0.3s! So, 1895-6 was practically a 2nd year Nino. So, 2025-6 with 2024-5 having been La Niña is in uncharted territory going back to the mid-1800s as regards the extremely intense summer -SOI. -
We're top 5 warmest from june 1 through July 15 or half of met summer. The hot stretches have been record breaking and the smoke didn't help either. After a cooler spell in late July all signs point to a lot more record heat for early August. Humans are like goldfish when it comes to weather though
-
2026-2027 Super El Nino
Stormchaserchuck1 replied to Stormchaserchuck1's topic in Weather Forecasting and Discussion
What's the deal man? The stuff that we have access to is pretty basic and it discontinues lol. I actually miss the zoomed in CONUS radar they used to have available, a combination of all the radar sites. Now I can just look at the SPC overview threats radar. -
they were just so quick - the opposing team could never really string together a possession long enough to pose much of a threat.
-
Storms all around us but very little rain. Ended with just .05". Temp soared up to 97/83 for a feels like of 124 at around 1 pm then the storms came. Clouds and outflow cooled us to the low 80's.
- Today
-
2026-2027 Super El Nino
40/70 Benchmark replied to Stormchaserchuck1's topic in Weather Forecasting and Discussion
Yea, I know about that...but it doesn't have the monthly tabulations like this site (50mb): https://psl.noaa.gov/data/correlation/qbo.data And this one (30mb): https://psl.noaa.gov/data/correlation/qbo.data They stopped updating in February. -
81.5 today. 64 now.
-
2026-2027 Super El Nino
Stormchaserchuck1 replied to Stormchaserchuck1's topic in Weather Forecasting and Discussion
Probably >95% chance it's +QBO for the Winter. 15-16 was also a rare 2nd year Nino that went Super so maybe that could possibly have something to do with it? Closest multi-year Nino analog is 86-88 and that QBO was very uniform. -
The SPC outlook for tomorrow (7/20) has enhanced risk for wind in the upper Midwest, with 5% tornado outlook in Wisconsin. The 00z convection-allowing model runs have several scattered storms in Wisconsin and Iowa, with higher updraft helicity tracks
-
Not giving me hope in the slightest...we know who this team is--and there has been a good deal of luck involved (especially yesterday and Friday( I did not see enough to convince me they're suddenly getting better. And not ot mention we may need to play Boston with Adley and Basallo less than 100% if available, smh This team cannot have good things--everytime something good happens, some negative (typically in the form of an injury) has to happen. 7-game winning streak, extended Bradish...then boom catching duo both injured. That bad "luck" element I put on Elias...I don’t think that will change until he's outta here, lol
-
Honestly, I really don't think this summer has been that bad. Yes I know I'm biased because this is my season, but when the heat hits we seem to get some relief after (today and tomorrow for example). It's really been up and down. We had a couple summers awhile back where the dewpoints were consistently high and just lingered throughout most of the season. Someone could probably confirm, but I know at least one was pre-covid.
-
A disappointing haul this weekend: 0.07" last night and 0.13" today. RAH AFD is bullish on activity overnight, and radar is blossoming around Charlotte area, but mostly looks like a threat to the sandhills.
-
 Eannerose joined the community
 -
2026-2027 Super El Nino
GaWx replied to Stormchaserchuck1's topic in Weather Forecasting and Discussion
Chuck, I don’t follow you. Do you see anything that could prevent a +QBO from starting ~now or in autumn and then going through winter? If so, what? I’ve been banking on it based on the common ~24 month pattern. -
Human forecasters act as the ultimate decision-makers in formulating a forecast. AI and advanced computer modeling are certainly incorporated into the process but humans provide oversight to any and all forecasts.
-
2026-2027 Super El Nino
Stormchaserchuck1 replied to Stormchaserchuck1's topic in Weather Forecasting and Discussion
This is a great site to monitor the QBO. The Quasi-biennial Oscillation (QBO) El Nino's effects do propagate to the Stratosphere and the Strat winds are opposite +QBO vs El Nino so it is possible there is some correlation No other year on record was nearly as wacky as 15-17 QBO-wise. 48-53 maybe couldn't get out of -QBO and that had a string of La Nina's. -
Winner, only 1.05 here
-
2026-2027 Super El Nino
GaWx replied to Stormchaserchuck1's topic in Weather Forecasting and Discussion
How do you know that the El Niño is what caused this? Couldn’t it just be a coincidence? I’m suspicious of that because I couldn’t find even one similar occurrence with any of the other super-Nino events! @40/70 Benchmark@Stormchaserchuck1 https://psl.noaa.gov/data/correlation/qbo.data -
 Pour commander librement, la visite de réseau hospitalier AP-HP est recommandée.
 -
Tired of dry weather. Do appreciate the cool mornings, though…
-
2026-2027 Super El Nino
40/70 Benchmark replied to Stormchaserchuck1's topic in Weather Forecasting and Discussion
And of course we would have a season like that right after they stop calculating it monthly. -
2026-2027 Super El Nino
Stormchaserchuck1 replied to Stormchaserchuck1's topic in Weather Forecasting and Discussion
Yeah, especially after Winter 15-16 2015 -26.70 -28.62 -28.15 -24.38 -12.34 2.18 7.45 10.96 12.07 13.38 12.79 11.39 2016 9.34 6.77 3.16 0.64 2.37 3.86 6.25 10.07 10.48 12.83 14.16 15.09 2017 14.92 14.78 14.35 13.88 8.01 -

2026-2027 Super El Nino
raindancewx replied to Stormchaserchuck1's topic in Weather Forecasting and Discussion
The 2015-16 El Nino screwed up the progression of the QBO if I remember correctly. Did anyone ever figure out why and if it could happen again? I would think its decent odds for this year with this El Nino, even though the QBO is off a bit from where it was then. -

Central PA Summer 2026 Discussion/Obs Thread
Voyager replied to Voyager's topic in Upstate New York/Pennsylvania
I'm on Wunderground. It's in my signature.