All Activity
- Past hour
-

Central PA Winter 25/26 Discussion and Obs
paweather replied to MAG5035's topic in Upstate New York/Pennsylvania
Hopefully I won’t need to chase somewhere else and can stay in Palmyra. -

January 2026 regional war/obs/disco thread
Damage In Tolland replied to Baroclinic Zone's topic in New England
I think the 15th storm is legit -

Central PA Winter 25/26 Discussion and Obs
pasnownut replied to MAG5035's topic in Upstate New York/Pennsylvania
I took advantage of the nice evening sans howling wind, and took christmas lights down last night as well as brought another load of wood down. Pattern looks loaded later next week and beyond. Trough axis hurtin us as best qpf well off shore, but IF we can get better spacing and less progressive w/ the flow, it might give something a chance to spin up a nice miller A. Going to be a lot of sorting out in the next few days, but it's fun to look at no matter the result. The chase is a big part of the fun for me. TGIF boys n girls. -

January 2026 regional war/obs/disco thread
Ginx snewx replied to Baroclinic Zone's topic in New England
Pretty obvious to me anyway but what do I know. All I now is one look and it was tent material -
January 2026 regional war/obs/disco thread
Ginx snewx replied to Baroclinic Zone's topic in New England
Spectacular looks. Ice castle like -
January 2026 regional war/obs/disco thread
Ginx snewx replied to Baroclinic Zone's topic in New England
Lol by the time I get to the map its bedtime j/k -

January 2026 regional war/obs/disco thread
dendrite replied to Baroclinic Zone's topic in New England
Not sure I agree. I think it’s in the process of tilting neg quickly. Did you loop it? I mean, I don’t doubt that it may end up a salad of interfering shit streaks, but I thought this run was ready to blow up.
-
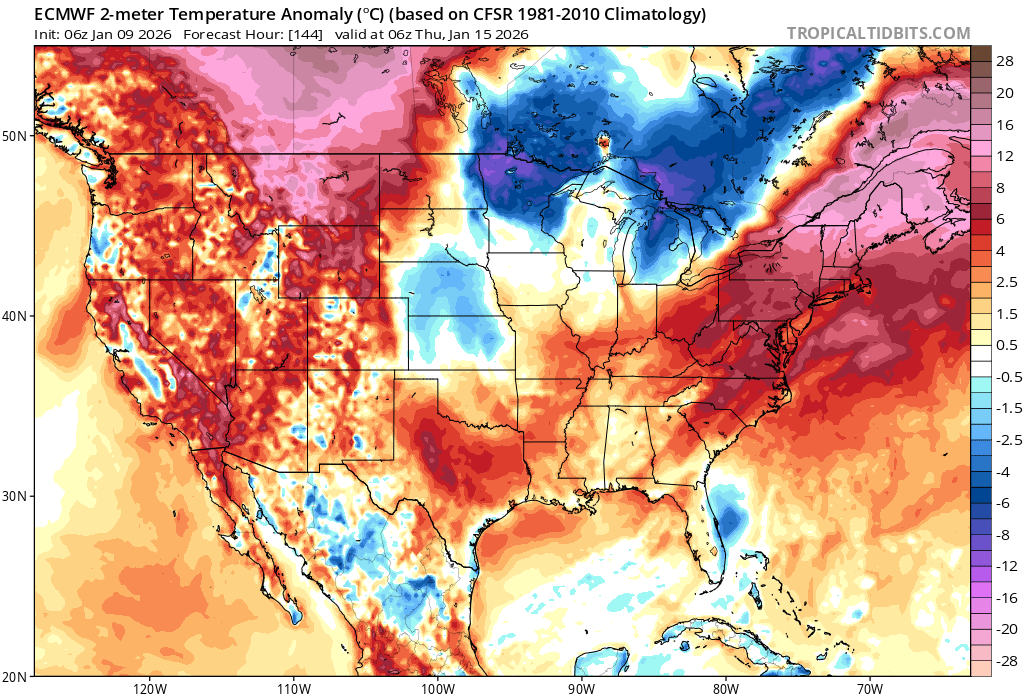
Warmup period so far SIte: High / low (dep) EWR: 1/6: 44 / 31 (+5) 1/7: 54 / 37 (+13) 1/8: 53 / 41 (+14) NYC: 1/6: 42 / 35 (+5) 1/7: 49 / 37 (+9) 1/8: 50 / 32 (+12)
-
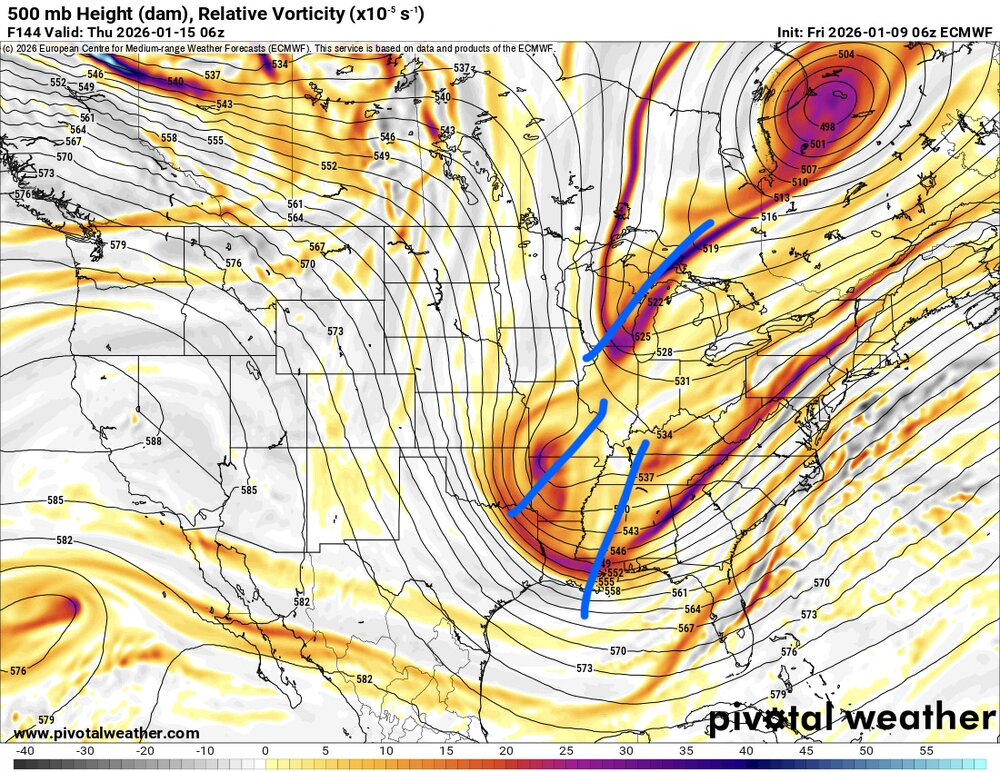
I think the thing that is peaking my interest the most are the 500mb maps. Go back and look at almost any major miller a we’ve had in the past. It looks almost identical.
-

January 2026 regional war/obs/disco thread
ineedsnow replied to Baroclinic Zone's topic in New England
driving around this morning and legit everywhere you look is postcard material.. all the trees are frosted and the sunrise was awesome.. -
January 2026 Short/Medium Range Thread
Holston_River_Rambler replied to John1122's topic in Tennessee Valley
Trend on the EPS is for more vorticity in the base of the trough: Would should be bale to have the EPS panels to go along with the GFS member panels covering the event by 18 or 0z tonight. -

January 2026 regional war/obs/disco thread
CoastalWx replied to Baroclinic Zone's topic in New England
Euro verbatim is another 36-48 hrs after that depiction. Airmass is much better then. -
Yea I agree. The late phase scenario by the gfs is always worrisome to see, but that model also has a very progressive bias. No phase is ever a given but when you drop the energy down to the oil rigs, I like our odds compared to normal. I think the second system has some serious legs. I feel like a close shave is coming for the first….the Euro bought brought a tear to my eye lol. I haven’t seen a good WNC special on a digital snow map in a while.
-
I tend to again at this lead time for sure. .
-
Records: Highs: EWR: 67 (1998) NYC: 64 (2008) LGA: 66 (2008) JFK: 65 (2008) Lows: EWR: 1 (1968) NYC: -1 (1968) LGA: 1 (1968) JFK: 0 (1968) cold week Historical: 1875 - The temperature at Cheyenne, WY, dipped to an all-time record cold reading of -38 degrees. (The Weather Channel) 1880: A rapidly deepening low-pressure system produced powerful winds along the Pacific Northwest coast. While wind measurements were limited, there were widespread reports of wind damage. 1888 - Severe cold gripped much of the western U.S. At Portland OR the Columbia River was frozen for two weeks, and in southern California temperatures dipped below freezing in some of the citrus growing areas. (David Ludlum) 1932 Pink snow fell in Durango, CO as dust from the Painted Desert mixed with a snowstorm. (Ref. Wilson Wx. History) 1934 Sleet and ice storm over southwest Minnesota. Hardest hit was Slayton, Tracy and Pipestone. The thickest ice was just east of Pipestone with ice measuring 6 to 8 inches in diameter. At Holland in Pipestone County three strands of #6 wire measured 4.5 inches in diameter and weighed 33 ounces per foot. The ice was described as: "Very peculiar in formation being practically round on three sides, the lower side being ragged projectiles like icicles: in other words pointed. The frost and ice were wet, not flaky like frost usually is. In handling this, it could be squeezed into a ball and did not crumble." (Ref. AccWeather Weather History) 1937: The maximum temperature for the date in Washington, DC is 76°F. (Ref. Washington Weather Records - KDCA) 1949: The most significant snowstorm to hit lower elevations of southern California started on this day and ended on the 11th. 14 inches fell in Woodland Hills, 8 inches in La Cañada and Catalina Island, at 2,100 feet, 6 inches at Altadena, 5 inches at Burbank, 4 inches at Pasadena, one inch at Laguna Beach and Long Beach. A trace fell at San Diego, the only time since 1882. Three feet piled up at Mt. Laguna, 18 inches fell at Cuyamaca, and one foot at Julian, CA. (Ref. Wilson Wx. History) 1950: A series of three major snowstorms with almost no break paralyzed much of Oregon. The snows were generally the heaviest in Oregon history. 224 inches of snow fell during the month at Timberline Lodge, OR. (Ref. AccWeather Weather History) 1954: The coldest temperature ever recorded in Greenland of -87° was reported at Northice. (Ref. Wilson Wx. History) 1970: The minimum temperature for the date is -4°F. in Washington, DC. (Ref. Washington Weather Records - KDCA) 1973: Heavy ice storm in Atlanta Ga. for several days 25 million in damage. (Ref. Wilson Wx. History) 1973: Heavy ice storm in Atlanta Ga. for several days 25 million in damage. (Ref. Wilson Wx. History) 1976 - Lake effect snow squalls buried the town of Adams NY under 68 inches of snow. (David Ludlum) 1977: St. Cloud, MN recorded their coldest temperature ever with a reading of -43F at 8 AM. Between January 3-19, the low temperatures there dropped to -15 °F or lower on fourteen of the seventeen days! (Ref. AccWeather Weather History) 1978: Richmond had a 51 °F daily temperature range on this date which was the greatest daily range on record for not only January but for all months. The maximum was 64 °F and the minimum was 13 °F on this date in 1978. (Ref. Richmond Weather Records) 1987 - A winter storm spread heavy snow from the Central Plains into the Great Lakes Region. Heavier totals included 9 inches at Sun City KS, 7 inches at Columbia MO, 11 inches at Terre Haute IN, and up to 10 inches in the southern suburbs of Chicago IL. (National Weather Summary) ( Storm Data) 1988 - A storm in the northeastern U.S. produced ten inches of snow at Boston MA, and 14 inches at Worcester MA. A winter storm in the northwestern U.S. produced a foot of snow in three hours at McCall ID. (National Weather Summary) (Storm Data) 1989 - Strong winds prevailed along the eastern slopes of the Rockies in Colorado. Winds gusted to 113 mph at the Air Force Academy near Colorado Springs, and reached 115 mph at Boulder. (National Weather Summary) (Storm Data) 1990 - A third storm in four days hit the Pacific Northwest. Winds in Oregon gusted above 100 mph at Netarts and at Oceanside. Up to 8.16 inches of rain was reported around Seaside OR, and the total of 4.53 inches of rain at Astoria OR was a record for the date. Twelve cities in the western U.S. reported record high temperatures for the date. The high of 70 degrees at Cedar City UT was a record for January. (National Weather Summary) (Storm Data) 1992: Minneapolis, MN had its first view of the sun in 350 hours or equaling 14.5 days. (Ref. Wilson Wx. History) 1993: 17.2 inches of snow fell in Topeka KS in twenty four hours. (Ref. AccWeather Weather History) 1996: Sub-freezing temperatures severely damaged vegetable crops with losses estimated over $2 million dollars in Hillsborough and Lee counties; with minor damage to the citrus crop in Pasco County, Florida. Several tropical fish farms lost over 50% of their harvest with the estimated loss at $5.5 million dollars. Locations across Florida and the East that reported record low temperatures for the date included: Elkins, WV: -8°, Islip, NY: 14°-Tied, Inverness, FL: 18°, Weekiwachee, FL: 24°, Avon Park, FL: 25°, Lakeland, FL: 26°, Mountain Lake, FL: 26° -Tied, Parrish, FL: 28°, Sarasota-Bradenton, FL: 28°, Tarpon Springs, FL: 28° -Tied, Venice, FL: 30° -Tied and Punta Gorda, FL: 31°. (Ref. Wilson Wx. History) 1997: A powerful Alberta Clipper and a deep Arctic High brought widespread and prolonged blizzard conditions, heavy drifting snow, and dangerous wind chills of -40 °F to -80 °F from the Missouri Valley to the upper Midwest. Across South Dakota, north winds were from 30 to 50 mph gusting to 60 mph. The clipper dropped from 2 to 7 inches of snowfall on top of an already solid 2 to 5 foot snowpack. As with previous storms, most roads again became blocked by huge snowdrifts stranding hundreds of motorists. Some people were trapped in their homes up to several days as snowdrifts buried their homes and blocked the roads with some people having to crawl out their windows. In Wilmot, SD a 12 foot drift covered the community home, where residents had to turn the lights on during the day. As a result of snow removal budget depletions and other storm damages, President Clinton declared all of South Dakota a disaster area. Snow plows from Iowa, Nebraska, and plows and manpower from the South Dakota National Guard helped to break through hundreds of roads. The snowdrifts in some places were packed so hard and were measured at 300 pounds per square inch. The total damage estimate for this January blizzard and for the previous January winter storm was $50 million dollars. (Ref. Wilson Wx. History) Comair Flight 3272 crashed into a field near Ida, OH during a major snowstorm. All twenty-nine people aboard died. The cause of the crash: ice built-up on the wings of the EMB-120 aircraft. (Ref. AccWeather Weather History) 2015: The halo picture below was taken by Texan Joshua Thomas in Red River, New Mexico.
-

January 2026 regional war/obs/disco thread
jbenedet replied to Baroclinic Zone's topic in New England
There’s red flags with that euro run. Mid levels look juicy but beneath you can see the BZ is not at all where we want it. we’re actually between two zones, one indicating it’s taking the surface reflection well ots whereas the other well to our west and indicating warm sector/ptype issues. I’m maintaining I do not like this one at all. It’s a lot further from where it needs to be for a significant snowstorm than the 6z euro mid level depiction is reflecting.

-
Went to bed after Ole Miss and Miami hoping I’d find some magic in here this morning. Man what a night of model runs!
-
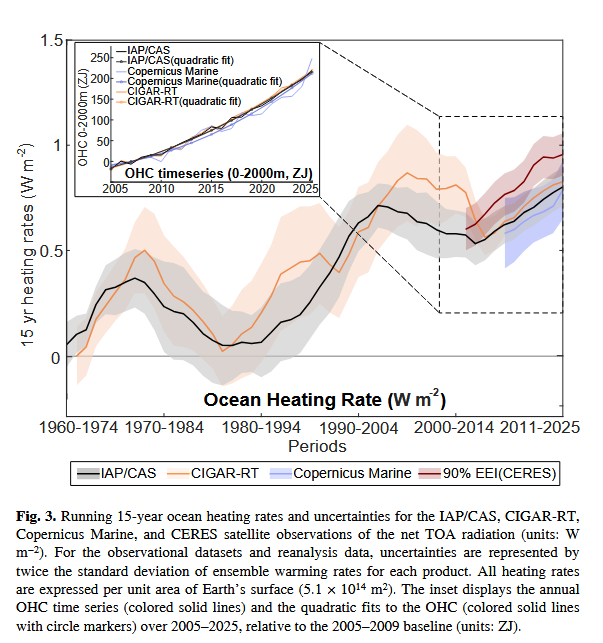
A chart from the technical paper shows that the rate of ocean warming is increasing. Note that data is from a number of sources including satellite net radiation measurements. https://link.springer.com/article/10.1007/s00376-026-5876-0
-

January 2026 regional war/obs/disco thread
Typhoon Tip replied to Baroclinic Zone's topic in New England
nah, too positively sloped overall. those wave spaces are negatively interfering with one another. it's not those that is the problem... it's big to small that's the issue. There's not enough s/w ridging rolling out ahead of the whole structure... The flow is angular but flat leaving the eastern sea-board. It's doing that because the flow was originally more ridged there, and then it got compressed... so the flow is fast/too fast, such that when that amplitude then arrives, it can differentiate the field and cause WAA to form which then creates the S/W ridging... this is complex to explain and most people don't get it. they just get angry and think your trolling but that's going anywhere very special wit that leading -
January 2026 Short/Medium Range Thread
Holston_River_Rambler replied to John1122's topic in Tennessee Valley
We finally have a potential system (the 15 January ish) in range of the 6z Euro and it has a little better shortwave further west: Personally I'd like that whole trough axis about 300 miles west, but still time to move around one way or another. -

January 2026 regional war/obs/disco thread
40/70 Benchmark replied to Baroclinic Zone's topic in New England
Well, I always include a map, so if that isn't clear enough for you...IDk. -
So a miserable March?? Was looking for a solid 6 seven weeks and then early Spring. Oh well.
-
January 2026 regional war/obs/disco thread
Ginx snewx replied to Baroclinic Zone's topic in New England
One can hope! dog logs and all. Maybe you can write an epic novel about a 6 to 10 inch snow. Look forward to spending an hour trying to decipher if there's an actual forecast in there without any if ands or buts. -
January 2026 regional war/obs/disco thread
Typhoon Tip replied to Baroclinic Zone's topic in New England
man these operational runs are all fucked up with wave spacing/interference schemes. The indexes nailed this period... well, so far - nothings verified yet. But the +PNA, however west biased or whatever is going to happen. Anyway, the best fit for the amplifying +PNA at mid month is actually the 24th phantom system on the GFS' 00z. But by then, the +PNA is in a state of decay - which is also not a certainty anyway. It's like we should be seeing a 24th type look on the 14-15-16 period but the field is mired down by wave space issues which is stopping that from happening. The 00z GFS was dubious with that 970mb micro cyclone. It's nice eye candy sitting there with category 2 hurricane winds and choke snow a stones through E of Logan like that, but whenever you see a system that is dimensional-challenged in the midst of a large/huge amplification like that it is always suspect and pretty much never happens. It's like the model physics are responding to the immense volatility of the total pattern, and then that triggers a systems not well coupled to the that larger field - otherwise...the system should be larger. Like the 20fukum4th! uh-nnoying. You can see the wave interference in the ens means of both the EPS and GEFs. There is a deep anomaly at the longitude of the Tenn. Valley on the 15th, and then while the ridge stays fixed in position out west, the nadir is suddenly repositioned back toward St Louise on the 17th. That's indicative of wave contention in the means. That's prooobably why they have been having issues getting more coherent with any cyclone signals. -
January 2026 regional war/obs/disco thread
dendrite replied to Baroclinic Zone's topic in New England
There’s a 3rd s/w that appears would phase in on that run…that GL one is potent and diving in quickly. Someone run the dgex off this so we can see what happens.