All Activity
- Past hour
-

Augdewst 2026: Summer's Last Stand
tamarack replied to Prismshine Productions's topic in New England
Some echoes passed overhead but nothing reached the ground. 1.83" this month so far, a bit AN. -

2026-2027 Record-breaking El Nino
mitchnick replied to Stormchaserchuck1's topic in Weather Forecasting and Discussion
Since I'm always optimistic as there's nothing to lose enjoying the hobby, I'll remain in the open instead of ducking for cover. Lol -
2026-2027 Record-breaking El Nino
40/70 Benchmark replied to Stormchaserchuck1's topic in Weather Forecasting and Discussion
It's coming lol I'm telling you, he's going to shred this optimism like a ninja with absolute surgical precision. -
2026-2027 Record-breaking El Nino
mitchnick replied to Stormchaserchuck1's topic in Weather Forecasting and Discussion
Leave him alone. He likes that corner of the room and the wall feels good on his head. -
2026-2027 Record-breaking El Nino
40/70 Benchmark replied to Stormchaserchuck1's topic in Weather Forecasting and Discussion
Larry is feeln' it- Dude needs a Bluewave intervention, and pronto He'll slap you across the face with a series of JMA VP images. -
WB's JB snow forecast: DC 15- 20 Slightly above normal
-

2026-2027 Record-breaking El Nino
GaWx replied to Stormchaserchuck1's topic in Weather Forecasting and Discussion
Not only have the last 5 Jamstec runs had cold and the coldest on the globe on land in the E US for winter, the 2023-4 winter forecast made in August was much warmer with it NN (see below). Also, this NN DJF forecast made in August of 2023 had been the coldest DJF made by Jamstec back to when the current records go back to, which is August of 2017! So, the following for 23-24 and today’s for 26-7 are the two coldest August runs for DJF: @bluewave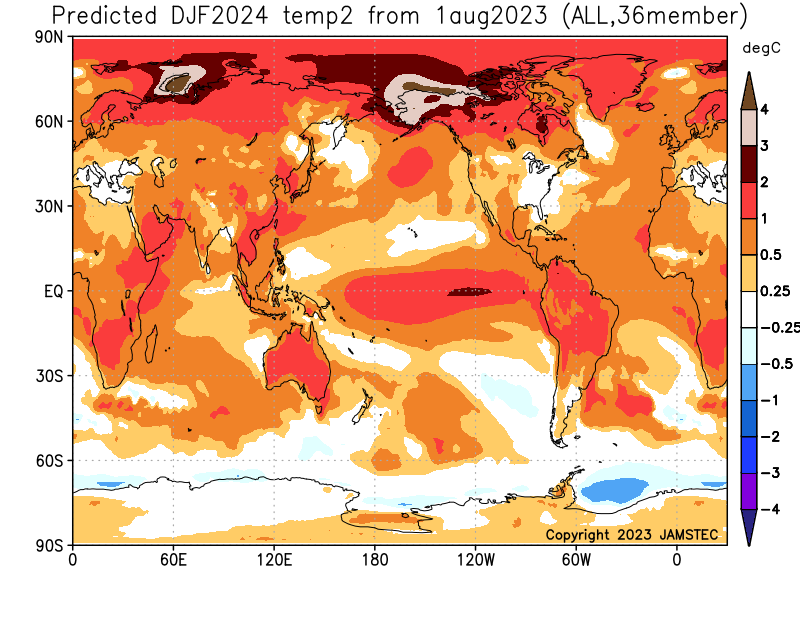
-

E PA/NJ/DE Summer 2026 Obs/Discussion
The Iceman replied to PhiEaglesfan712's topic in Philadelphia Region
Have gotten 0.0" this week. Back to drought it looks like. Can't ever remember a summer like this where we flip back and forth from weeks of dry broken up by flooding rains then back to weeks of dry. -
Congrats Brian. Nice lightshow to my south early this morning. Between a shower yesterday and a light shower as the storm passed to my south a big .17"!
-
2026-2027 Record-breaking El Nino
40/70 Benchmark replied to Stormchaserchuck1's topic in Weather Forecasting and Discussion
What I mean by exaggerated is with respect to the DJF mean pattern...it's probably going to be too cold in December, and while that DJF mean map may very well be representative of one month (February), it's highly likely to be overly reflected in the DJF mean on the model. -
.67" last night from the few rounds of storms. I was just south of the worst by 2 miles or so. Just a little wind but torrential rain and very loud thunder. @hudsonvalley21 was definitely in the brunt of the storm.
-
2026-2027 Record-breaking El Nino
GaWx replied to Stormchaserchuck1's topic in Weather Forecasting and Discussion
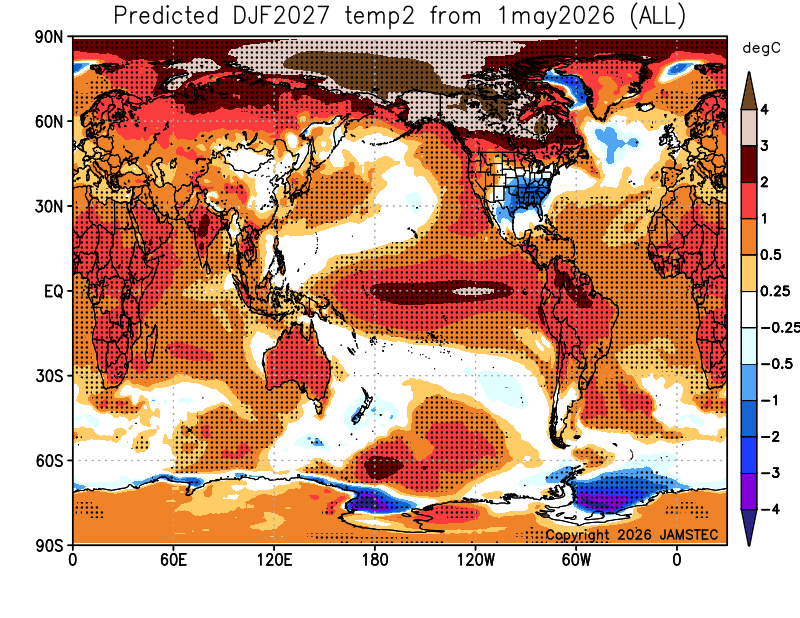
The cold dominating a large portion of the E US and it being the coldest land area on the entire globe goes all the way back to the first Jamstec run with DJF, April! April: May: June: July: Aug: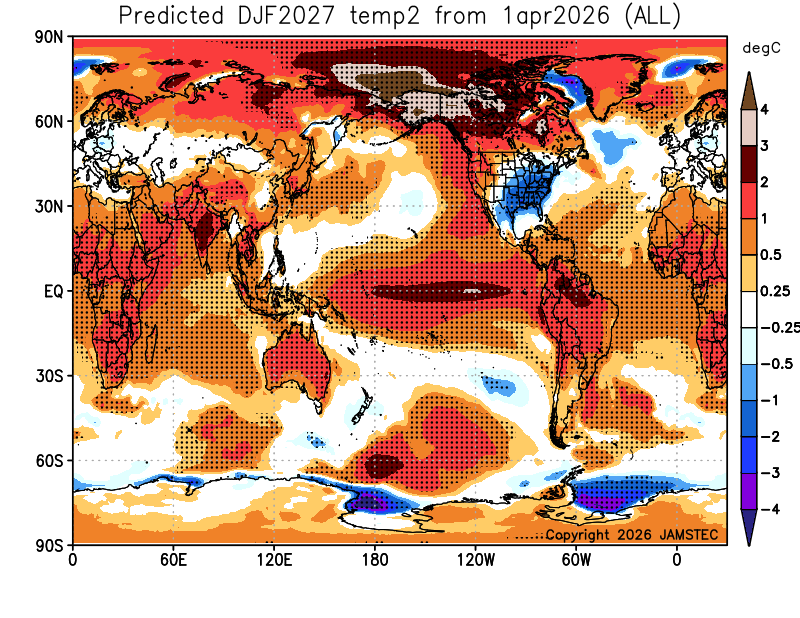
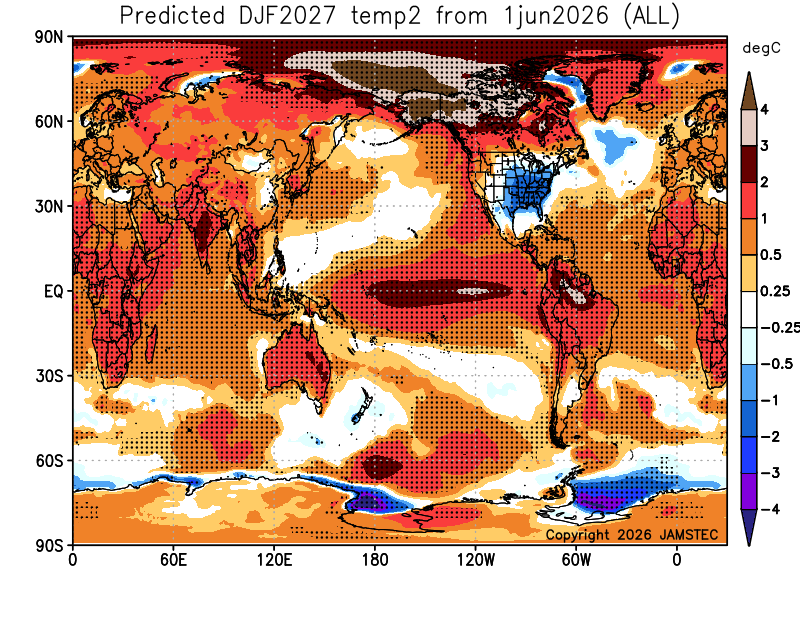
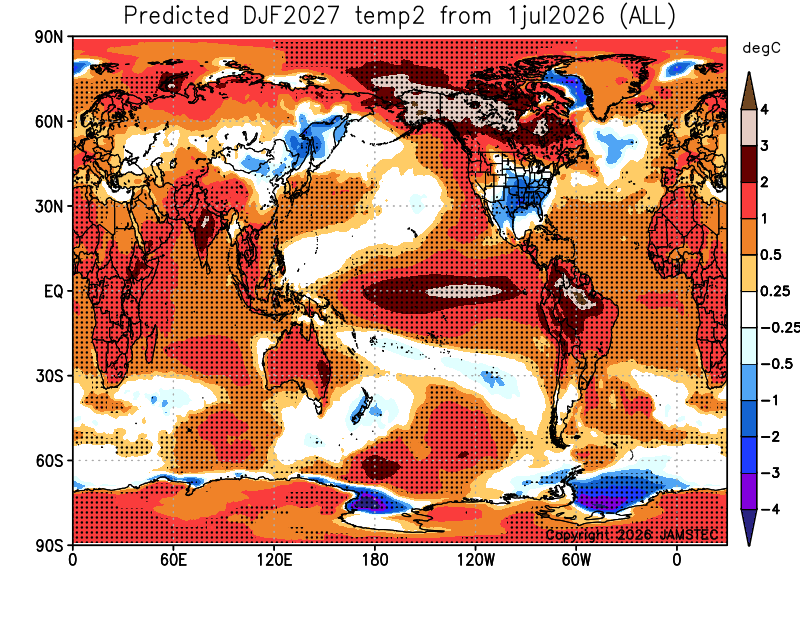
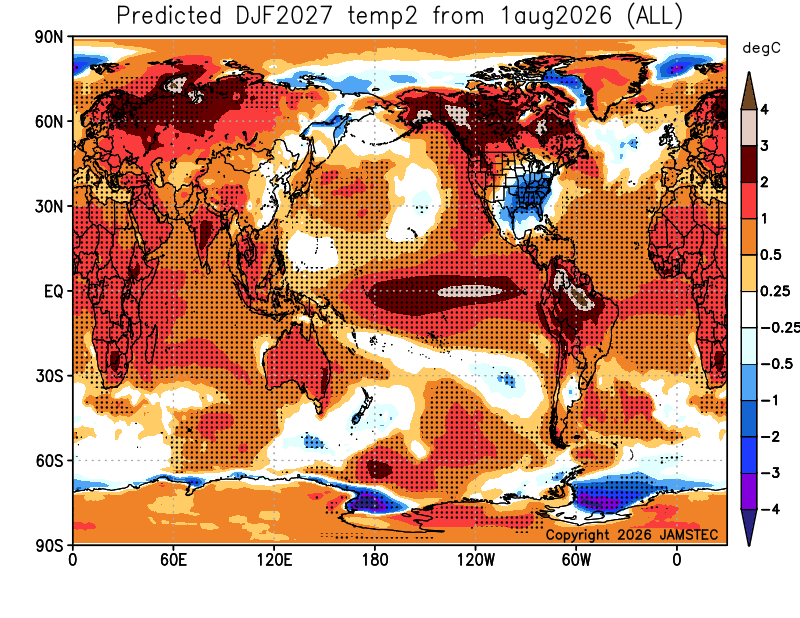
-
 http://trustpharmaindia.com/# Trust Pharma India
 -
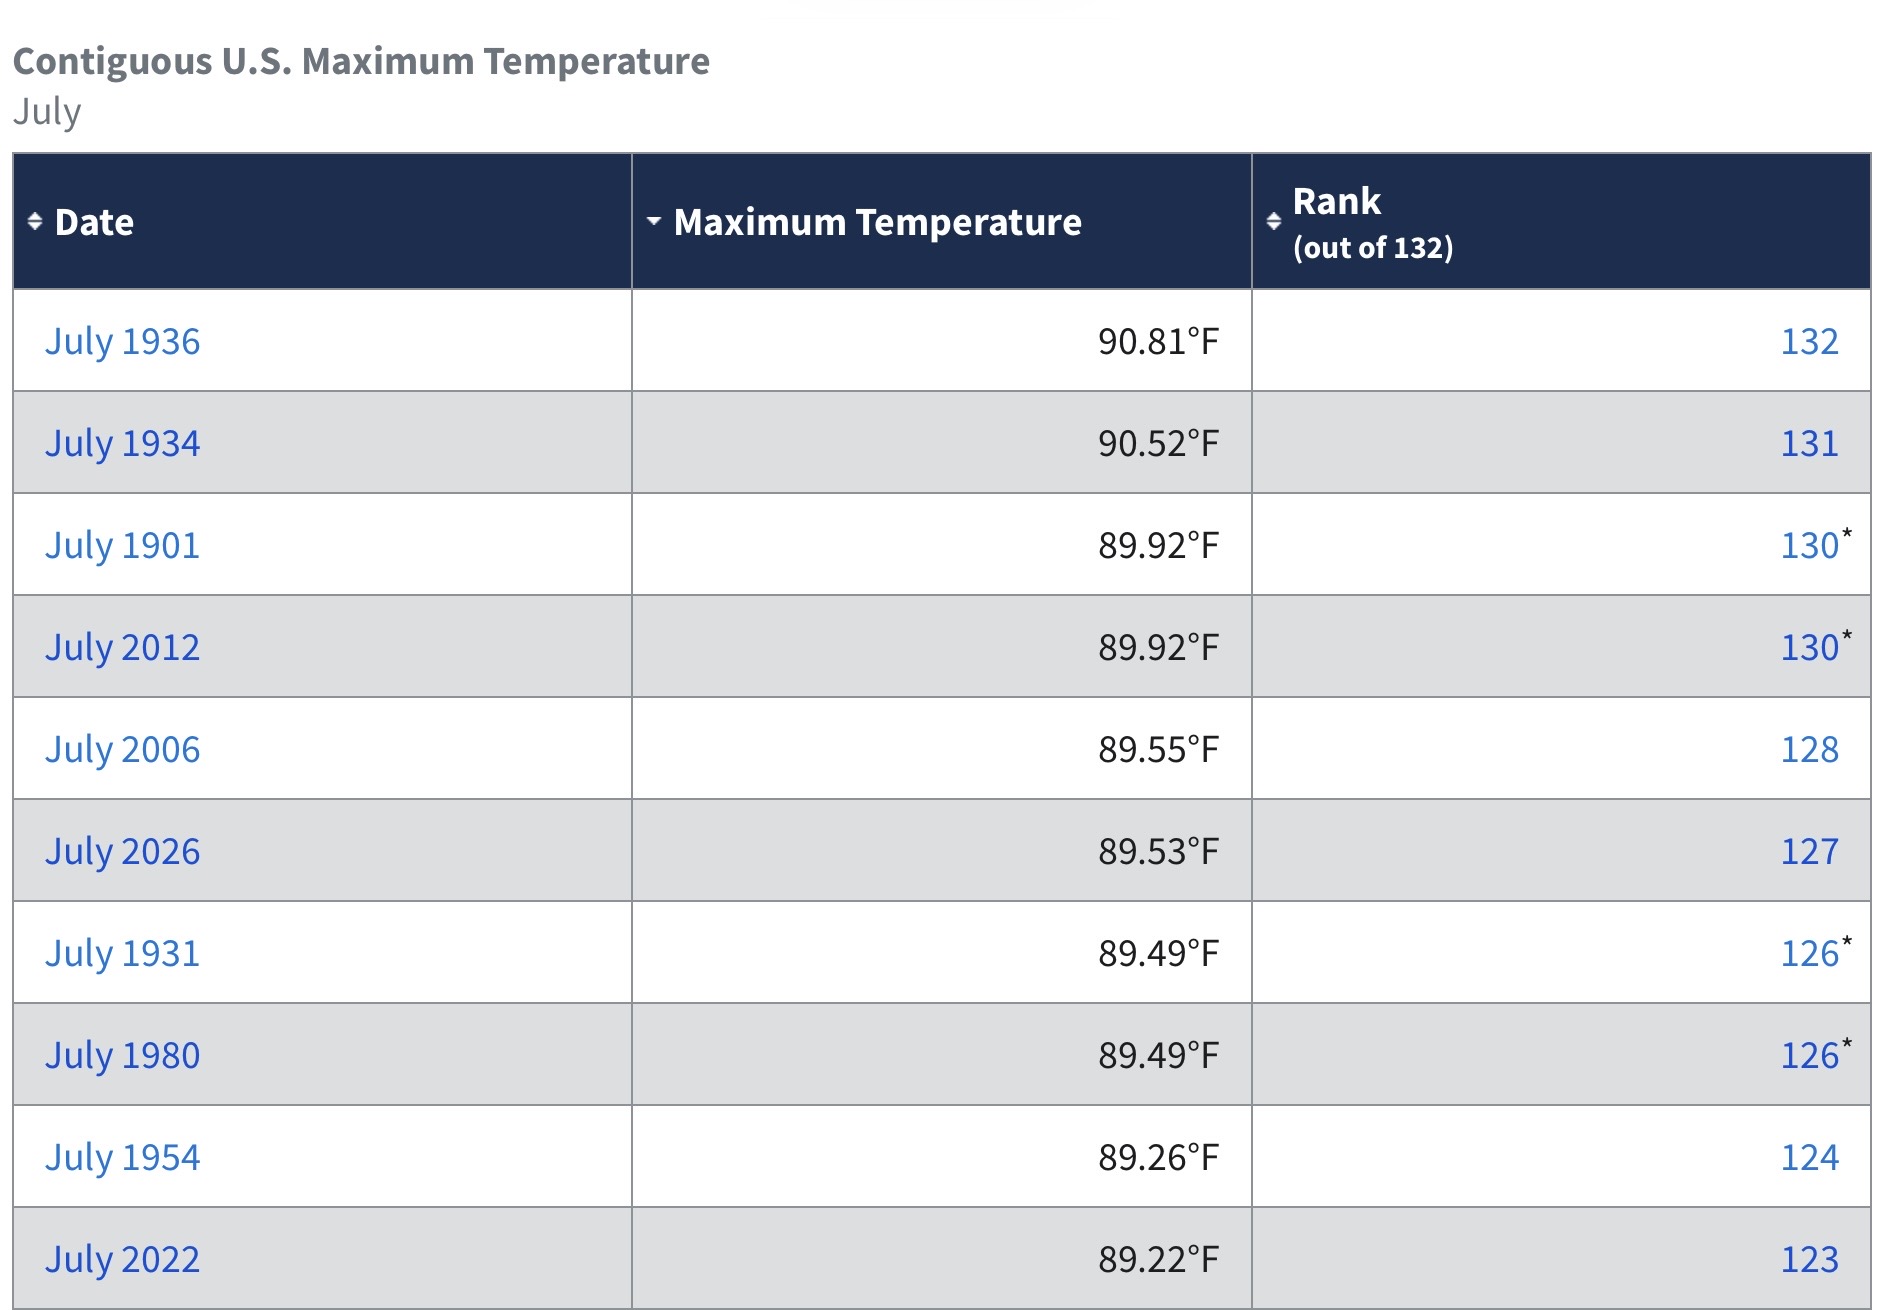
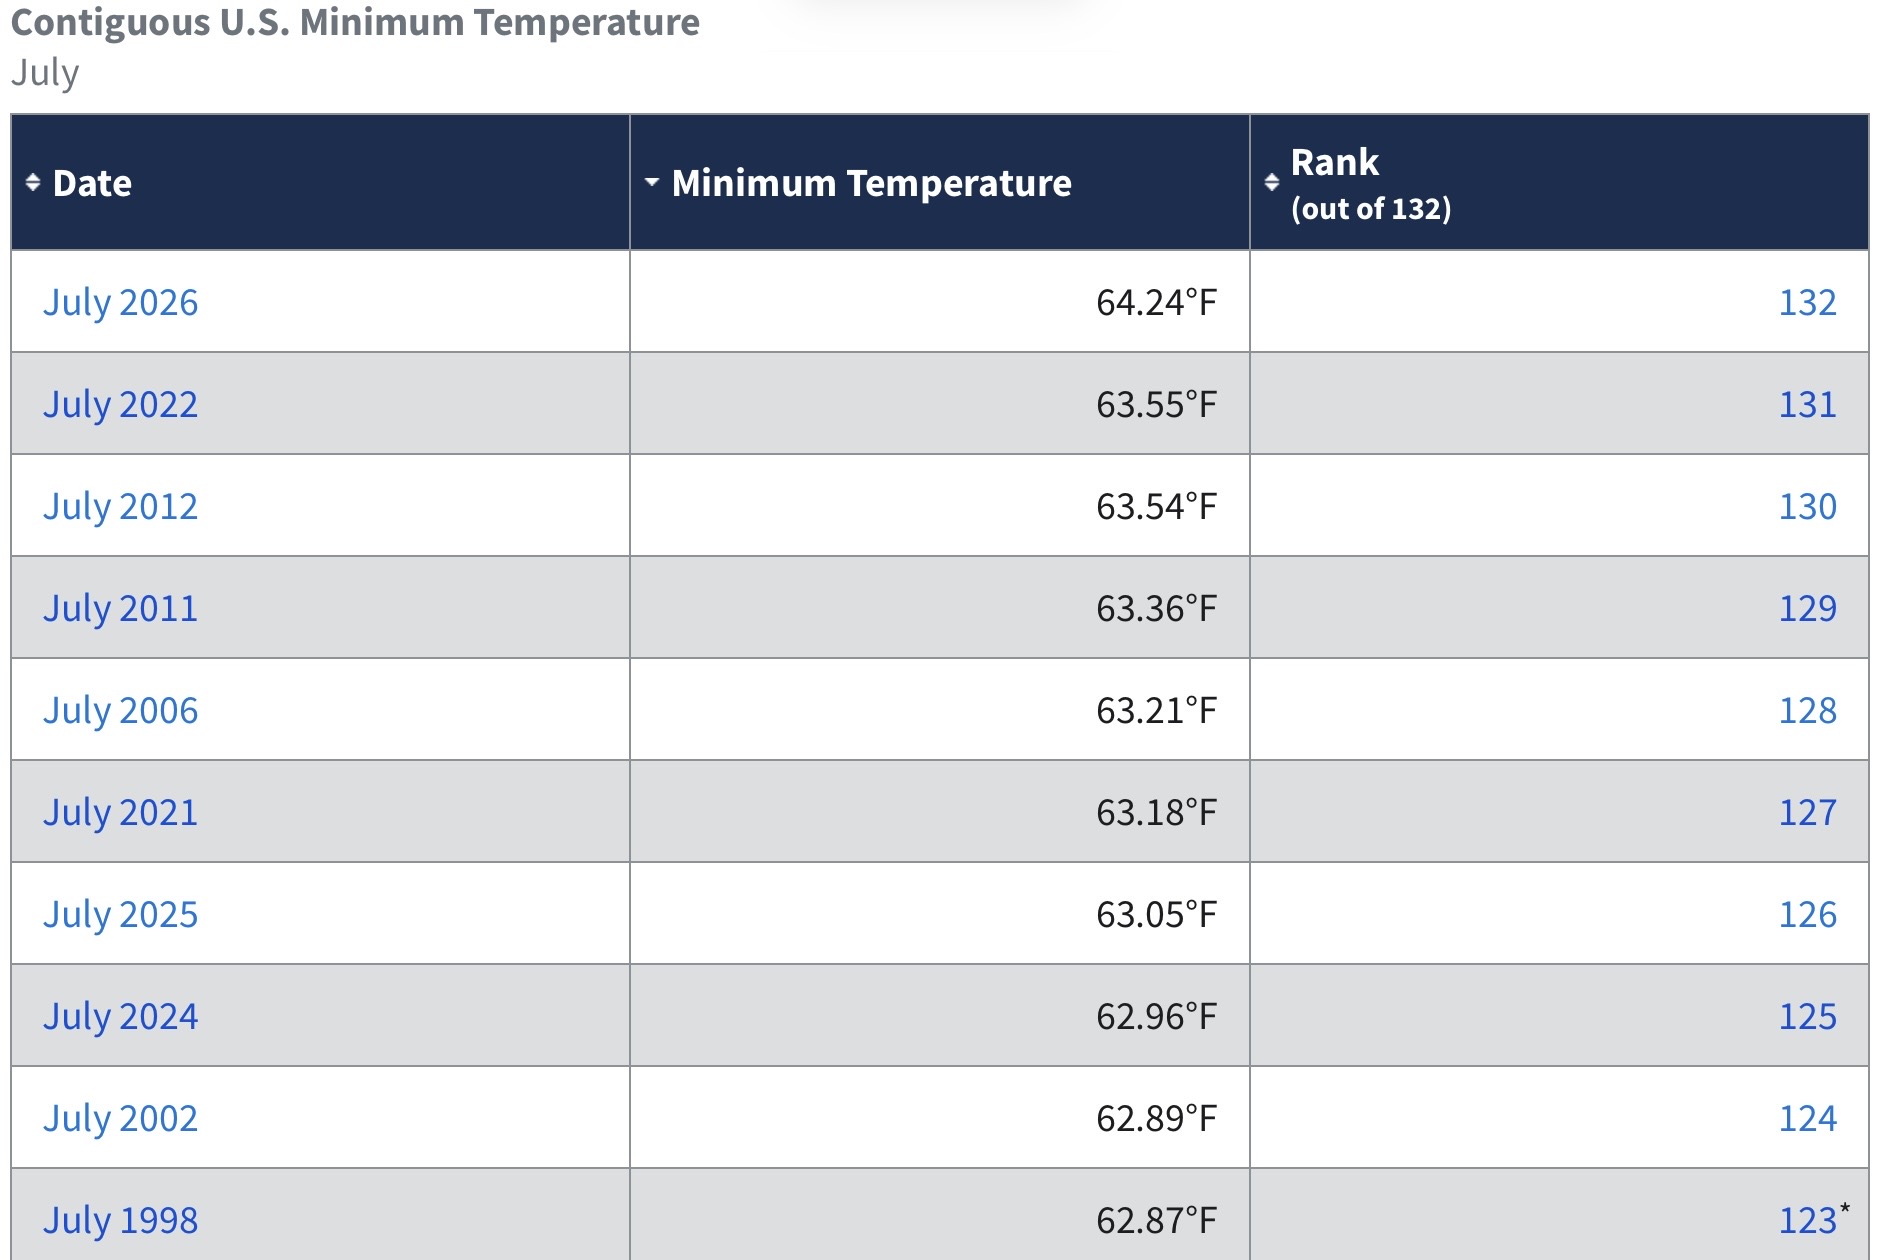
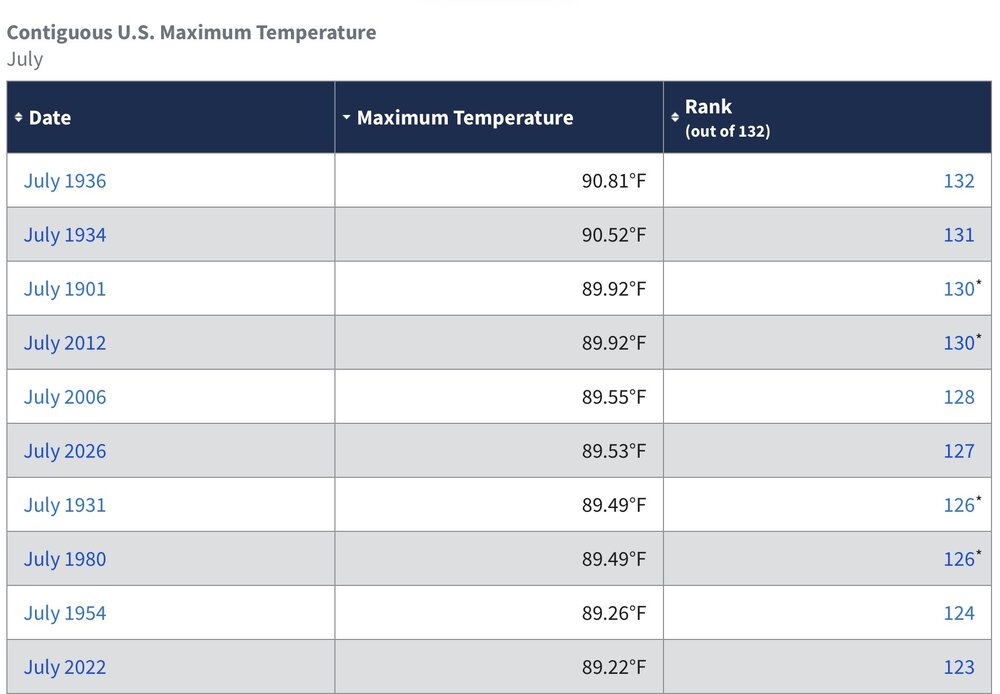
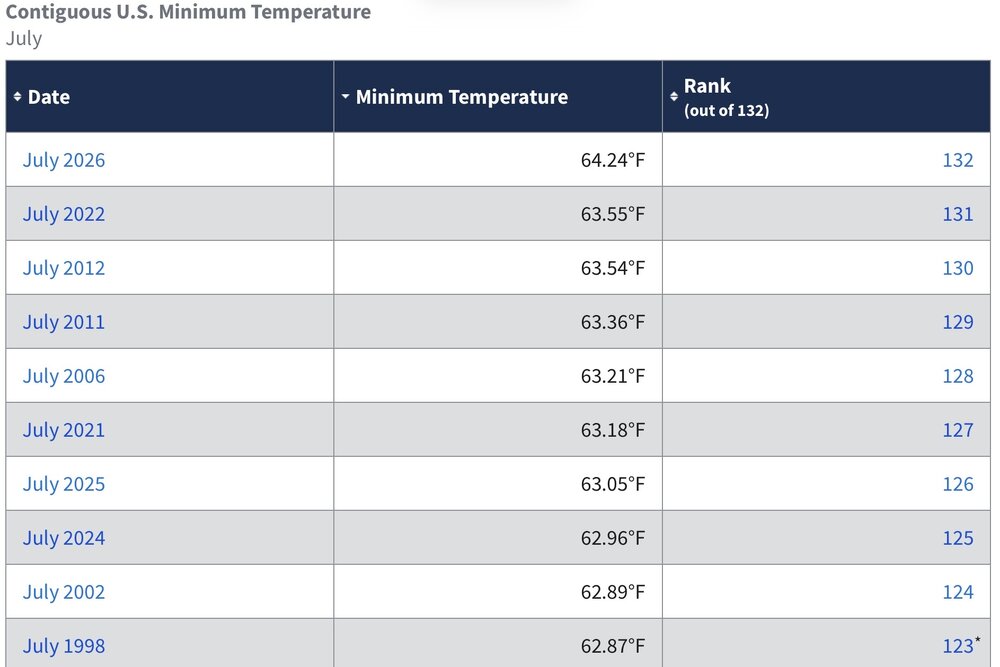
Breaking the July 1936 record was mostly a function of the much warmer minimum temperatures this year. This July was only the 6th warmest for maximum temperatures behind 1936. But it was the warmest July for minimum temperatures. So the average of the two put this year in 1st place. Much higher dewpoints these days due to the warmer overall global temperatures which holds more moisture. So the low temperatures can’t drop as low. Plus the record corn production adds to the dewpoints and warmer minimums in the areas which experienced the worst of the Dust Bowl in the Plains. https://www.mprnews.org/story/2026/07/27/one-of-the-muggiest-days-on-record-for-the-twin-cities The highest dew point ever observed in the Twin Cities remains 82 degrees, recorded on July 19, 2011. That event still stands as the local benchmark for tropical humidity. Across Minnesota, the state record is even more astonishing. In Moorhead, the dew point climbed to an incredible 88 degrees during the 2011 heat wave. That combination of extreme heat and moisture pushed the heat index above 130 degrees. Only a handful of years have ever produced 80-degree dew points in the Twin Cities: 1966 1983 1995 1999 2002 2005 2011 2026 With six more hours added to the record books today, 2026 has secured its place alongside some of Minnesota's most memorable humidity events. While air temperatures often get the headlines, dew point is what determines just how oppressive the air feels — and an 80-degree dew point is about as uncomfortable as it gets in the Upper Midwest.
-
2026-2027 Record-breaking El Nino
40/70 Benchmark replied to Stormchaserchuck1's topic in Weather Forecasting and Discussion
Wayyy too much optimism in this thread. We could use a Bluewave tutorial on how CC has engineered the failure of past auspicious seasonal runs by way of gargantuan ridges eating away the troughs like Pacman. -
Looks like Roundy has JB in his corner. That's a duo I wouldn't want to be forecasting against.
-
2026-2027 Record-breaking El Nino
40/70 Benchmark replied to Stormchaserchuck1's topic in Weather Forecasting and Discussion
We are def. due for a stretch like that. -
2026-2027 Record-breaking El Nino
40/70 Benchmark replied to Stormchaserchuck1's topic in Weather Forecasting and Discussion
Yea, I made that comparison the other day. I think it's valid, but exaggerated.. -
Heard a bunch of thunder and some lightning but no measurable rain here
- Today
-

Augdewst 2026: Summer's Last Stand
weatherwiz replied to Prismshine Productions's topic in New England
I know you weren't...just was verifying to see. Not too uncommon around these parts to see very short-lived TDS signatures so was curious if that could have been the case -
Augdewst 2026: Summer's Last Stand
OrangeCTWX replied to Prismshine Productions's topic in New England
I definitely wasn’t implying tornadic lol more just an isolated high level wind signature. -
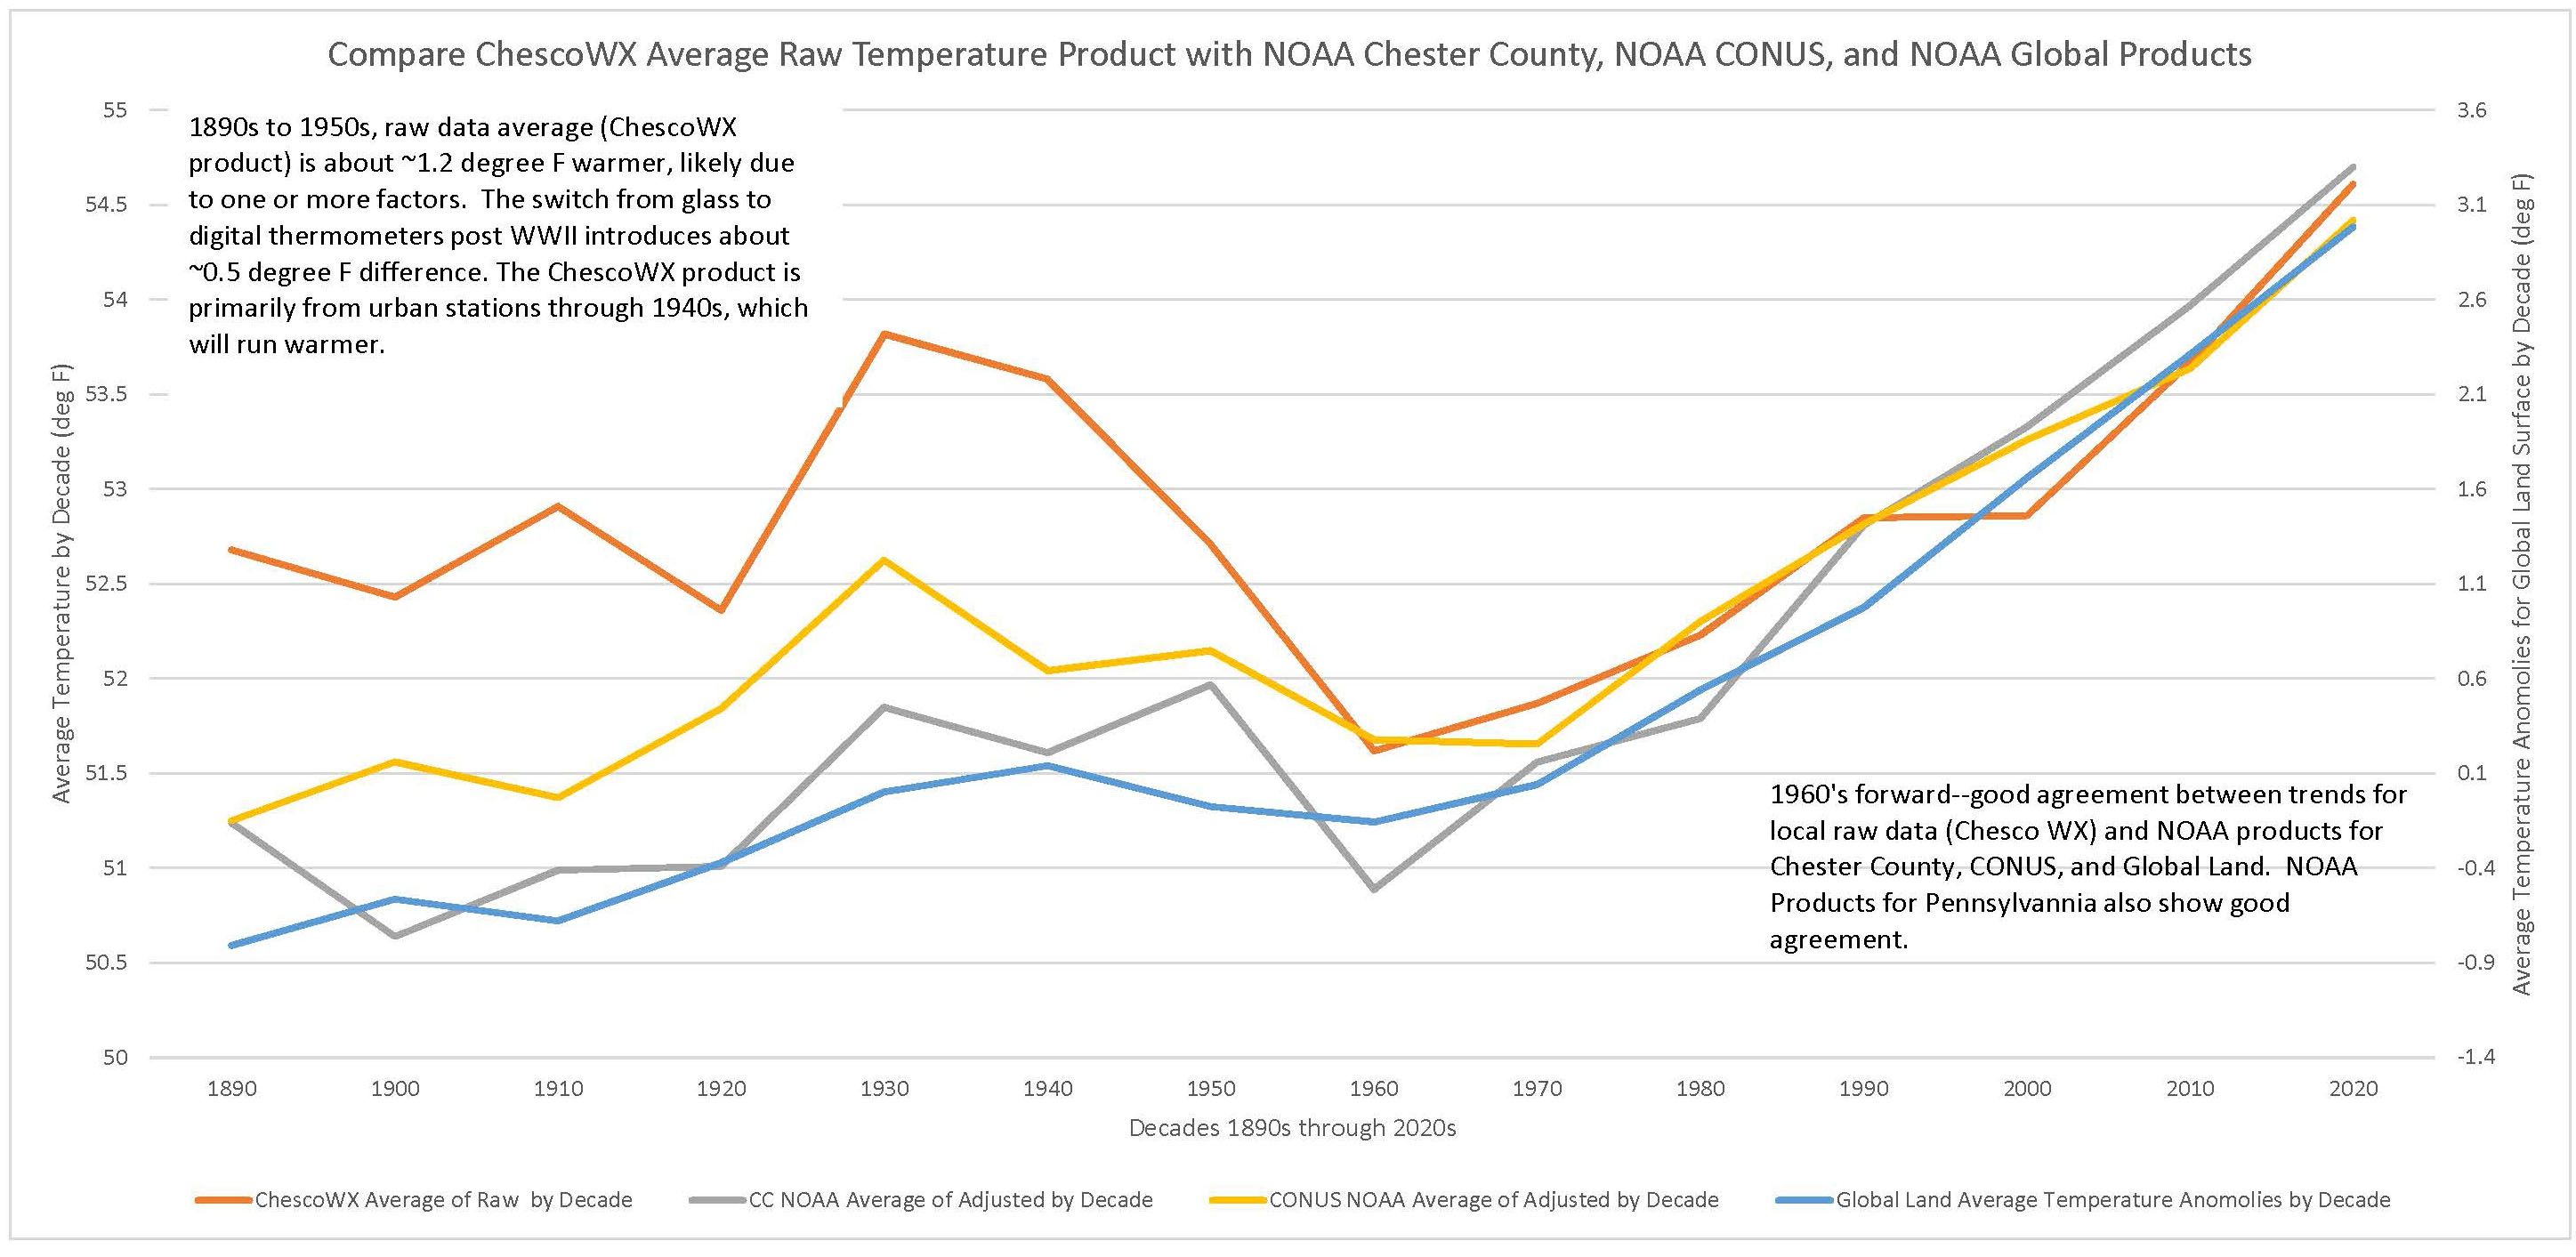
 Paul, you have made many claims in the last few comments. These look like strawmen to me, and I have summarized them below. To me, it appears you are making these comments to show that the accepted process of dealing with raw noisy data is flawed, and therefore that published climate trends are based on a flawed process. "86% of breakpoints are undocumented" → implies the algorithm should mostly find documented breaks. It's designed to catch undocumented ones — a high rate is expected, not damning. "Chester County's raw data shows no significant county-wide trend, so warming is manufactured by adjustment" → implies mainstream science predicts a clean, significant trend in every small local raw sample. Nobody claims that — a handful of stations in one county is noisy by nature, which is the whole reason homogenization exists. "The correction is a smooth ramp, not a step, so no single event explains it" → implies a legitimate correction must be one discrete jump. Many small breaks stacked over decades naturally produce a ramp-shaped cumulative correction. "Some stations (Coatesville 2W, Hopewell) got zero adjustment, proving selectivity" → implies adjustments should be applied roughly evenly everywhere. A detector that only flags real breaks and leaves clean stations alone is working correctly, not cherry-picking. "Highs are warming while lows are cooling — that's a contradiction" → implies day/night trends must move together. Diurnal-range divergence is a documented, separately-studied climate phenomenon, not a paradox. Yet, the Chester County raw data is in good agreement with published climate trends, more so when the urban makeup of the pre-1940 station group is taken into account. I suggest looking into the West Chester 2 NW records to document the rest of the breakpoint.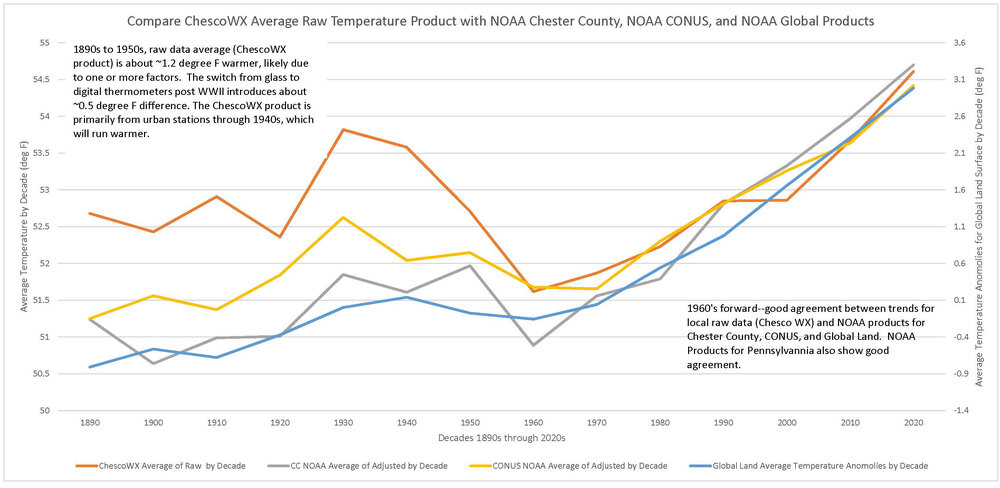
-
I saw the light and it was dark. As always …….
-
Augdewst 2026: Summer's Last Stand
weatherwiz replied to Prismshine Productions's topic in New England
Doesn't look like anything tornadic but certainly looks like a decent little wind signature between Orange and Milford -

Augdewst 2026: Summer's Last Stand
Damage In Tolland replied to Prismshine Productions's topic in New England
Looks like tree topper tor there