donsutherland1
-
Posts
23,763 -
Joined
Content Type
Profiles
Blogs
Forums
American Weather
Media Demo
Store
Gallery
Everything posted by donsutherland1
-
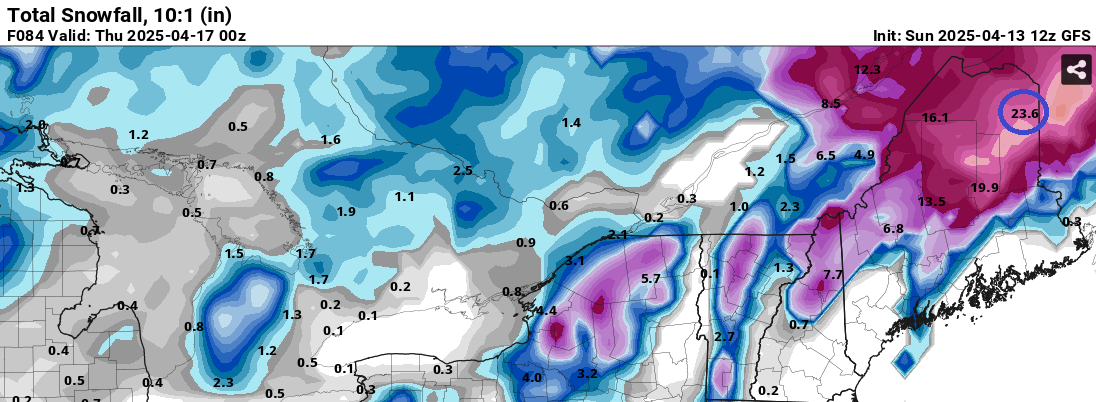
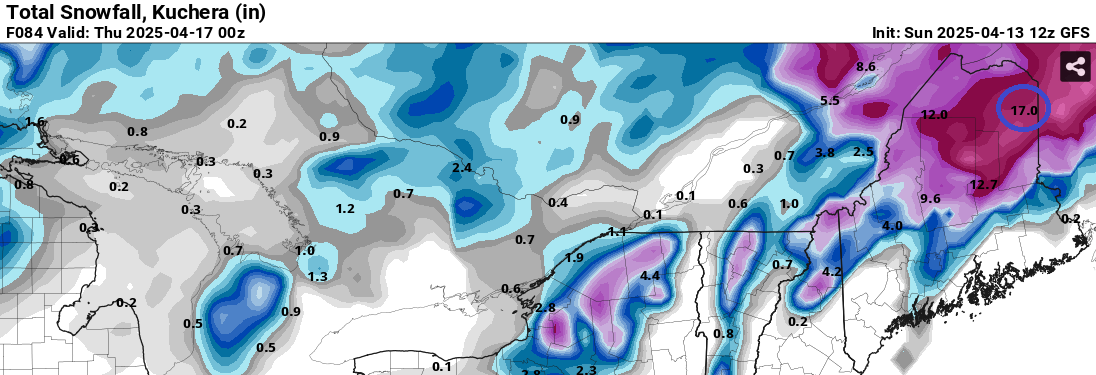
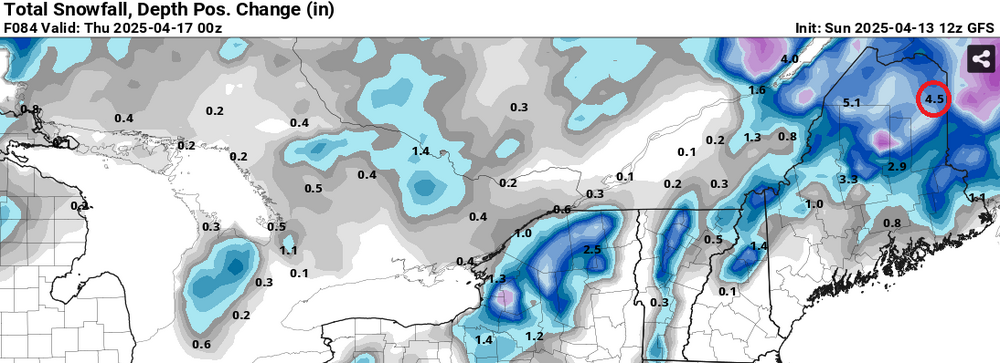
Since 4/13 18z, Caribou picked up 2.6" of snow. The next event of the two systems will bring very little snow and mainly rain/mixed precipitation. In contrast, the 4/13 18z GFS had shown the following amounts for snowfall during the period during which 2.6" fell: 10:1 ratio: 10.9"; Kuchera: 8.4"; and Snow Depth Change: 3.1".


-
Further illustration of the GFS's late-spring cold bias. 84-hour total snowfall forecasts for Caribou from 4/13 18z: Best guess, excluding today's snowfall prior to 18z (0.4"), one is probably dealing with a 1"-3" total snowfall for Caribou from the two waves of precipitation (tonight into tomorrow and then again Tuesday into Wednesday). Most of the time, readings will be above freezing.
-
Tomorrow and Tuesday will be somewhat warmer than normal before another surge of cooler air moves into the region by the middle of the week. Milder air will likely return to end the week. The ENSO Region 1+2 anomaly was +1.3°C and the Region 3.4 anomaly was -0.1°C for the week centered around April 2. For the past six weeks, the ENSO Region 1+2 anomaly has averaged +1.23°C and the ENSO Region 3.4 anomaly has averaged +0.17°C. Neutral ENSO conditions will likely continue through at least late spring. Early indications are that summer 2025 will be warmer than normal in the New York City and Philadelphia areas. The potential exists for a much warmer than normal summer (more than 1° above normal). The SOI was +4.69 today. The preliminary Arctic Oscillation (AO) was +2.029 today. Based on sensitivity analysis applied to the latest guidance, there is an implied 65% probability that New York City will have a cooler than normal April (1991-2020 normal). April will likely finish with a mean temperature near 52.6° (1.2° below normal).
-
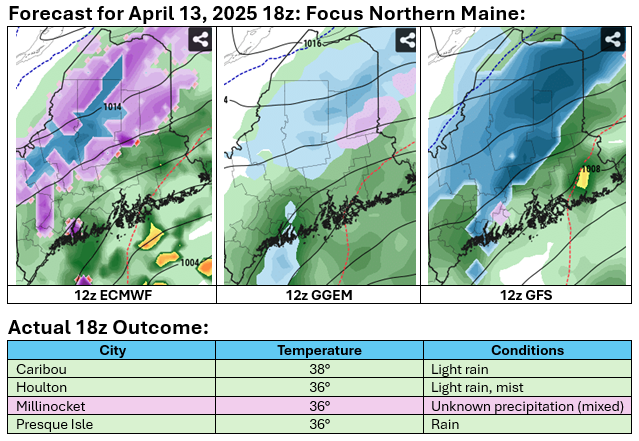
During late spring, the GFS often has a significant cold bias that feeds back leading to excessive snowfall forecasts. That bias is most pronounced in medium-range forecasts (>5 days), but can affect even very short-range ones. Below are 6-hour forecasts:
-
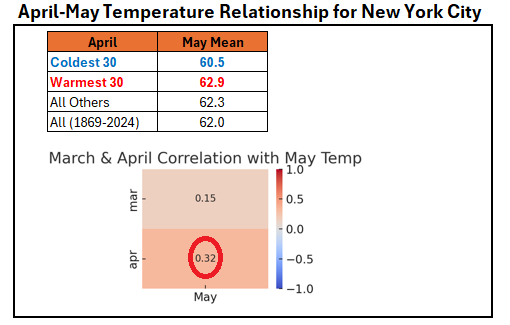
Looking ahead to May, April has a pretty strong correlation with May's temperatures (0.32 coefficient of determination). That relationship is more than twice as strong as that for March. However, that means that other variables explain 68% of May's temperatures. Therefore, the current cool start to April and possible cool monthly anomaly doesn't necessarily mean that May will wind up cooler than normal in the New York City area. So far, latest CFSv2 guidance is suggesting near normal to somewhat warmer than normal conditions for May. The ECMWF Monthly forecast run earlier this month showed a similar idea.
-
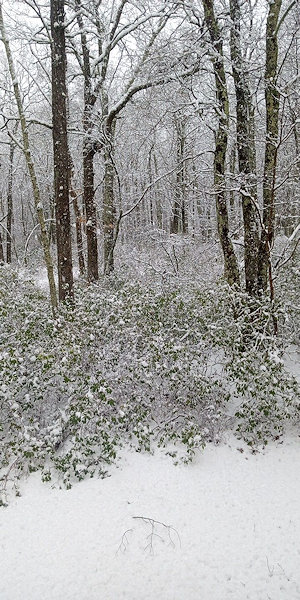
Photo from my sister in the Milford, PA area yesterday:
-
Yes, that was its latest measurable snowfall.
-
No. There is no record where NYC saw measurable snowfall with a low of 40 or above.
-
Full hourly information isn't available, but from the data that is available, it appears that that around 0.12" fell when the temperature was 39 and the wet bulb temperature was 38. That was April 1875. Snowfall amounts were: April 7: 0.5" April 13-14: 10.0" (April 13: 8.7"; April 14: 1.3" April 25: 3.0" Total Snowfall: 13.5"
-
The map is wrong for Brooklyn. No measurable snowfall was reported in the City on the PNS. Moreover, JFK is the closest reporting stating to Brooklyn and the low was 38°. New York City's greatest snowfall accumulation with a low of 38° or above was 0.5" on March 18, 1899. At that time, the City's urban footprint was much smaller than it is today. 393 NOUS41 KOKX 121800 PNSOKX CTZ005>012-NJZ002-004-006-103>108-NYZ067>075-078>081-176>179-130600- Public Information Statement National Weather Service New York NY 200 PM EDT Sat Apr 12 2025 ...SNOWFALL REPORTS... Location Amount Time/Date Provider ...Connecticut... ...Fairfield County... New Fairfield 1.2 in 0530 AM 04/12 Trained Spotter ...New Jersey... ...Bergen County... Teterboro Airport T in 0500 AM 04/12 ASOS ...Essex County... Caldwell Airport T in 0500 AM 04/12 ASOS ...New York... ...Orange County... Chester 3.5 in 0900 AM 04/12 Public Monroe 3.0 in 0810 AM 04/12 Trained Spotter 2 SSW Maybrook 2.6 in 0615 AM 04/12 Trained Spotter 2 E Highland Mills 2.5 in 0800 AM 04/12 Public 2 S Pine Bush 2.4 in 0705 AM 04/12 Public ...Queens County... NYC/La Guardia T in 0400 AM 04/12 Official NWS Obs &&
-
The first one included occurred during the pre-dawn hours where there was a trace of snow/sleet.
-
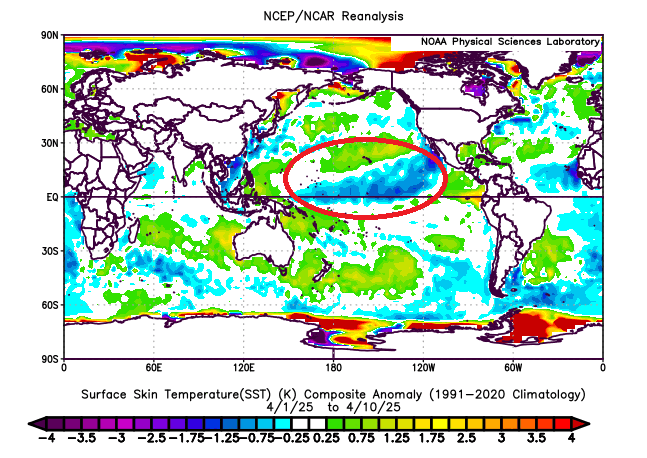
A combination of factors likely contributed including the fading La Niña, abnormal ocean SSTAs (especially a long area of cold SSTAs just north of the Equator).
-
No. A trace was recorded yesterday. Traces were also recorded on April 23, 2020; May 9, 2020; and April 21, 2021. Had it been measurable, it would have been the second latest in more than 50 years.
-
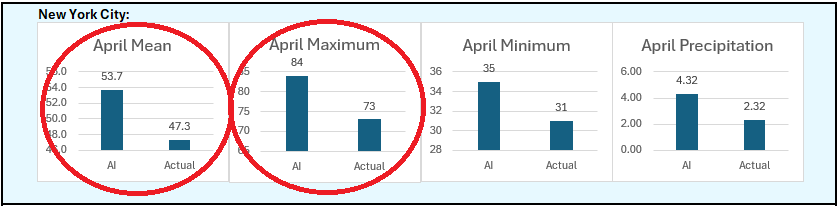
Early update on the AI idea for New York City (through April 12th): The monthly mean temperature and monthly maximum temperature are running well below the AI idea. But there are signs that the gaps could close during closing 10 days of the month, if the ECMWF weekly guidance is correct. From April 11th: From April 12th (latest):
-
Yes. None of the other local airports recorded any snow.
-
Clouds will break tomorrow with the temperature approaching but falling just short of seasonable levels. Monday and Tuesday will be somewhat awrmer than normal before another surge of cooler air moves into the region by the middle of next week. Milder air will likely return to end the week. The ENSO Region 1+2 anomaly was +1.3°C and the Region 3.4 anomaly was -0.1°C for the week centered around April 2. For the past six weeks, the ENSO Region 1+2 anomaly has averaged +1.23°C and the ENSO Region 3.4 anomaly has averaged +0.17°C. Neutral ENSO conditions will likely continue through at least late spring. Early indications are that summer 2025 will be warmer than normal in the New York City and Philadelphia areas. The potential exists for a much warmer than normal summer (more than 1° above normal). The SOI was +17.30 today. The preliminary Arctic Oscillation (AO) was +2.421 today. Based on sensitivity analysis applied to the latest guidance, there is an implied 68% probability that New York City will have a cooler than normal April (1991-2020 normal). April will likely finish with a mean temperature near 52.5° (1.2° below normal).
-
Depends where one is. If one is at White Plains and northward, there could be a coating. Within 10-20 miles of the City, some sleet might mix in, but there very likely won't be any accumulations. Both the 18z NAM and 18z GFS are very likely overdone.
-
A cold rain will develop this evening or early tonight and continue into tomorrow. A general 0.50"-1.50" of rain is likely. Temperatures will top out in the lower and middle 40s in New York City area tomorrow. Some sleet pellets are possible outside New York City. Across parts of Central New York State and central New England, wet snow is possible. An appreciable snowfall is possible in higher elevations. Where areas remain above freezing, snowfall amounts will be limited. The temperature could approach seasonable levels on Sunday and then briefly go above normal early next week. However, before the warmth could become established, another surge of cooler air will push into the region by the middle of next week. The ENSO Region 1+2 anomaly was +1.3°C and the Region 3.4 anomaly was -0.1°C for the week centered around April 2. For the past six weeks, the ENSO Region 1+2 anomaly has averaged +1.23°C and the ENSO Region 3.4 anomaly has averaged +0.17°C. Neutral ENSO conditions will likely continue through at least late spring. Early indications are that summer 2025 will be warmer than normal in the New York City and Philadelphia areas. The potential exists for a much warmer than normal summer (more than 1° above normal). The SOI was +25.81 today. The preliminary Arctic Oscillation (AO) was +2.151 today. Based on sensitivity analysis applied to the latest guidance, there is an implied 68% probability that New York City will have a cooler than normal April (1991-2020 normal). April will likely finish with a mean temperature near 52.5° (1.2° below normal).
-
The pattern led to a stalled front. Thunderstorms developed and trained along that front for days, producing extreme rainfall in parts of the Tennessee Valley.
-
Very beautiful. They'll get more tonight.
-
Northeastern Canada is running colder than normal. Some of that cold air is draining into the Northeast. The AO has less influence now, as wave lengths are shorter.
-
Tonight will be cloudy, breezy, and cool. Some showers are likely. A few distant northern and western suburbs could even see a little snow or sleet. The week will end on a chilly note. A steady rain will develop tomorrow and continue through Saturday. A general 0.50"-1.50" of rain is likely. Temperatures will top out in the 40s in New York City. The temperature could approach seasonable levels by the end of the weekend and then briefly go above normal early next week. However, before the warmth could become established, another surge of cooler air will push into the region by the middle of next week. The ENSO Region 1+2 anomaly was +1.3°C and the Region 3.4 anomaly was -0.1°C for the week centered around April 2. For the past six weeks, the ENSO Region 1+2 anomaly has averaged +1.23°C and the ENSO Region 3.4 anomaly has averaged +0.17°C. Neutral ENSO conditions will likely continue through at least late spring. Early indications are that summer 2025 will be warmer than normal in the New York City and Philadelphia areas. The potential exists for a much warmer than normal summer (more than 1° above normal). The SOI was -6.85 yesterday. The preliminary Arctic Oscillation (AO) was +1.061 today. Based on sensitivity analysis applied to the latest guidance, there is an implied 68% probability that New York City will have a cooler than normal April (1991-2020 normal). April will likely finish with a mean temperature near 52.6° (1.1° below normal).
-
1.0".
-
It will begin to turn somewhat milder starting tomorrow, but temperatures will remain below seasonal norms. Temperatures could approach seasonable levels by the end of the weekend and it could briefly turn milder than normal early next week. In addition, a moderate to perhaps significant rainfall is likely from Friday through Saturday. The ENSO Region 1+2 anomaly was +1.3°C and the Region 3.4 anomaly was -0.1°C for the week centered around April 2. For the past six weeks, the ENSO Region 1+2 anomaly has averaged +1.23°C and the ENSO Region 3.4 anomaly has averaged +0.17°C. Neutral ENSO conditions will likely continue through at least late spring. Early indications are that summer 2025 will be warmer than normal in the New York City and Philadelphia areas. The potential exists for a much warmer than normal summer (more than 1° above normal). The SOI was +3.32 yesterday. The preliminary Arctic Oscillation (AO) was -0.103 today. Based on sensitivity analysis applied to the latest guidance, there is an implied 63% probability that New York City will have a cooler than normal April (1991-2020 normal). April will likely finish with a mean temperature near 53.0° (0.7° below normal).
-
JFK reached 32; LGA fell to 33; and, NYC dropped to 31.