donsutherland1
-
Posts
24,192 -
Joined
Content Type
Profiles
Blogs
Forums
American Weather
Media Demo
Store
Gallery
Everything posted by donsutherland1
-
EPS guidance for NYC (January 13-15 period):
-
Morning thoughts… Light precipitation will end this morning. Clouds will give way to sunshine during the late morning or afternoon. High temperatures will reach the lower and middle 40s in most areas. Likely high temperatures around the region include: New York City (Central Park): 45° Newark: 47° Philadelphia: 47° Dry and mild weather will continue through midweek. Normals: New York City: 30-Year: 39.5°; 15-Year: 40.5° Newark: 30-Year: 40.0°; 15-Year: 41.2° Philadelphia: 30-Year: 41.4°; 15-Year: 42.3°
-
Statistically, a 50-degree December would be the equivalent of a 45.8-degree January (1991-2020 baseline) at Central Park. The December 2015 average would be the equivalent of a 46.6-degree January. The existing January record, which was set in 1932, is 43.2 degrees.
-
JFK: None LGA: 1998 and 2002 NYC: 1998
-
The 18z GFS showed about 1" of snow on Bufkit for LGA. The 18z NAM was lower. The National Blend of Models showed no accumulation. Overall, the idea of little or no accumulation seems reasonable. Thus, there is some potential for the first measurable snowfall of the season tomorrow in New York City, but such an outcome is not guaranteed.
-
Advancing cloud shield.
-
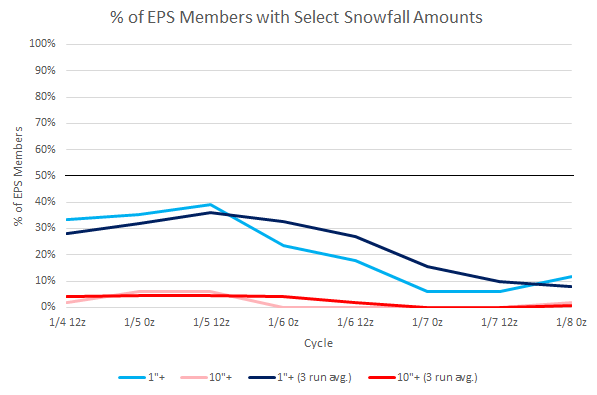
Clouds will increase overnight and light precipitation will overspread the region. Light precipitation will continue into tomorrow. New York City and coastal areas will see some light rain and snow. Little or no accumulation is likely. Interior sections could pick up a coating of snow. Mainly dry and mild weather will return following the precipitation. The once moderate support for snowfall during the January 13-15 period diminished sharply. Just 6% of 12z EPS members show 1" or more snow for New York City. 2022 became the 14th year during which New York City received no measurable snowfall through December 31st. During the 13 prior years, mean seasonal snowfall was 16.0" (median seasonal snowfall: 16.3"). Just 8% of those winters rallied to see 30" or more seasonal snowfall. 31% of those winters wound up with less than 10" of seasonal snowfall. Just under half (46%) had 20" or more seasonal snowfall. The lowest seasonal snowfall for those cases of 2.8" was recorded in 1972-1973. The highest seasonal snowfall for those cases was 32.8", which occurred during 2015-2016. The ENSO Region 1+2 anomaly was -0.3°C and the Region 3.4 anomaly was -0.7°C for the week centered around December 28. For the past six weeks, the ENSO Region 1+2 anomaly has averaged -0.48°C and the ENSO Region 3.4 anomaly has averaged -0.87°C. La Niña conditions will likely persist through mid-winter before fading to neutral conditions. The SOI was +22.15 today. The preliminary Arctic Oscillation (AO) was -1.264 today. On January 6 the MJO was in Phase 7 at an amplitude of 0.996 (RMM). The January 5-adjusted amplitude was 1.041 (RMM). Based on sensitivity analysis applied to the latest guidance, there is an implied 97% probability that New York City will have a warmer than normal January (1991-2020 normal). January will likely finish with a mean temperature near 40.5° (6.8° above normal).
-
Latest EPS ensembles concerning January 13-15:
-
That would easily smash the existing record. At Central Park, the record high monthly minimum temperature for January is 25°. That mark was set in 1937.
-
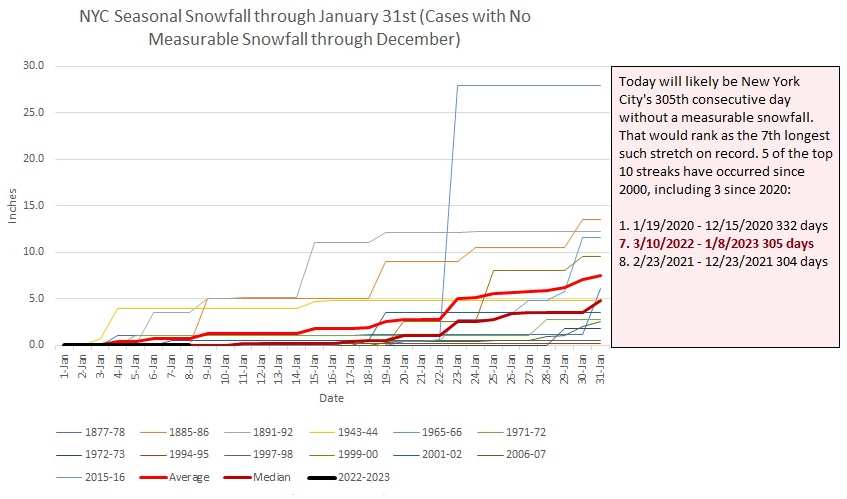
I would be very surprised if Central Park or JFK had no measurable snowfall this winter. I do think the threat of < 1" is a low probability scenario that can't be dismissed altogether. It's still not a likely one, as I see it, but we'll see how things go. Such an outcome almost happened during Winter 1997-1998 until 5" of snow fell at Central Park and 2.9" fell at JFK on March 22, 1998. That "near miss" with historic futility suggests that had things been just a little different, both locations would have had <1" seasonal snowfall. Maybe this will be the winter? I doubt it. It would probably take a near record warm January courtesy of the strong Pacific jet handing off the baton to a canonical La Niña February followed by a mild March and April to bring about that sorry outcome.
-
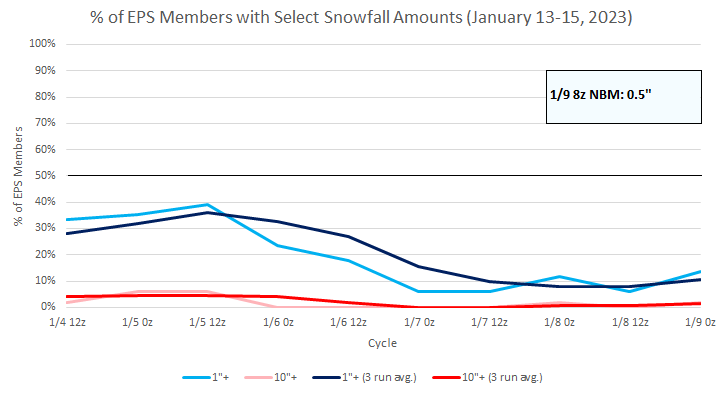
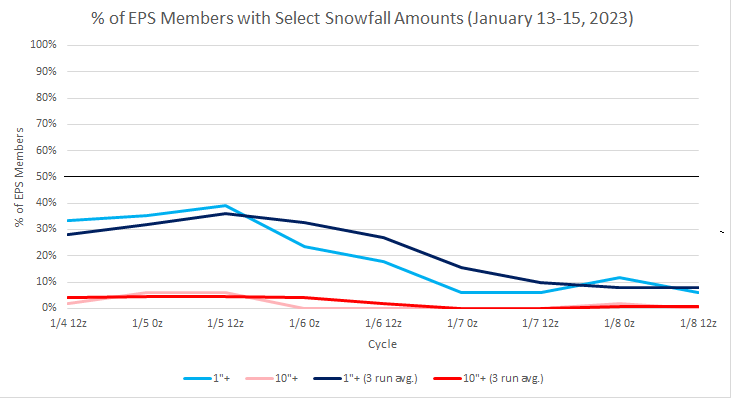
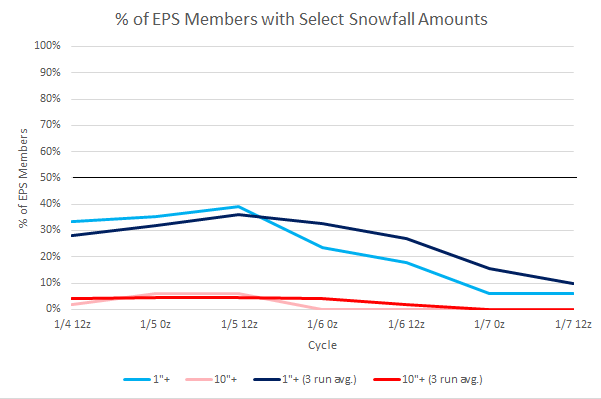
If one looked at Social Media even a few days ago, there was a lot of chatter about a big East Coast snowstorm for the January 13-15 period. Some years--1996 and 2016--were tossed out there, too. Such extreme events are rare. They should not be referenced except carefully. Potential events should not be benchmarked against them without strong and consistent evidence that supports such claims. Exaggerated speculation about potential events damages credibility and misinforms the public. In response to such chatter, I posted EPS ensemble trends to illustrate where things actually stood In fact, as the graph shows: 1. The risk for 1" or more snowfall was moderate at best for New York City. There were no cycles where even half the ensemble members showed 1" or more snow. 2. The risk of 10" or more snow was low (always under 10%). 3. There was no evidence-based case to tie the potential event to either the 1996 or 2016 mega-blizzards. Responding to such chatter, I concluded in a lengthy post on Thursday: ...one can cautiously conclude that January 13-15 offers a window of opportunity to break the measurable snow drought. If things go really well, there might be a small chance of a big snowfall. Much can still change given the timeframe involved. There remain no guarantees. Chatter about big amounts on Twitter or Instagram or Facebook (with or without the posting of long-range snow maps) is pure speculation, as it goes far beyond the bounds of objectivity, regardless of the author. As Dr. Marshall Shepherd put it in a recent tweet in response to a 240-hour ECMWF map, "Snow storm forecasts based on 1 model run 10 days out is fantasy land so please be wary of stuff like this when you see it..." Shepherd's advice should be taken seriously.
-
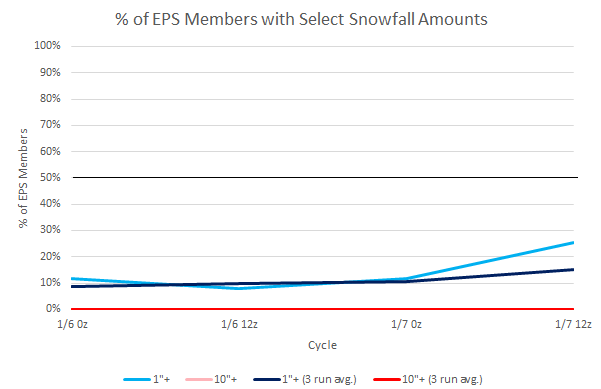
The latest ensemble idea concerning the January 13-15 system. Ensemble support for 1" or more for tonight into tomorrow, which had briefly risen to 25% on the EPS, has fallen sharply overnight. High resolution models will provide better insight at this point. For NYC itself, little or no accumulation appears likely given the warm surface and above freezing readings expected. A slushy coating is possible in the nearby suburbs.
-
Sadly, that’s very likely the case.
-
Yet another day will very likely pass without New York City seeing a measurable snowfall at Central Park.
-
Morning thoughts… It will be partly sunny with near to somewhat warmer than normal temperatures. High temperatures will reach the lower 40s in most areas. Likely high temperatures around the region include: New York City (Central Park): 41° Newark: 43° Philadelphia: 44° A weak system will bring a period of light rain and snow to the region late tonight into tomorrow. Little or no accumulation is likely in New York City. Interior sections could pick up a coating. Normals: New York City: 30-Year: 39.6°; 15-Year: 40.6° Newark: 30-Year: 40.1°; 15-Year: 41.3° Philadelphia: 30-Year: 41.5°; 15-Year: 42.4°
-
Yes. That’s correct.
-
Harrisburg had 42.6". Atlantic City, Baltimore, Philadelphia, Richmond and Washington, DC did not have 40" of snow.
-
The EPS ensembles for January 8-9, 2023 in New York City:
-
The 1966 blizzard occurred later. Norfolk's seasonal snowfall during 1965-1966 was 14.7". 41.9" fell at Norfolk during winter 1979-1980. The biggest snowfalls occurred during February 6-7, 1980 (12.4") and March 1-2, 1980 (13.7").
-
2001-02 was much warmer than 1972-73.
-
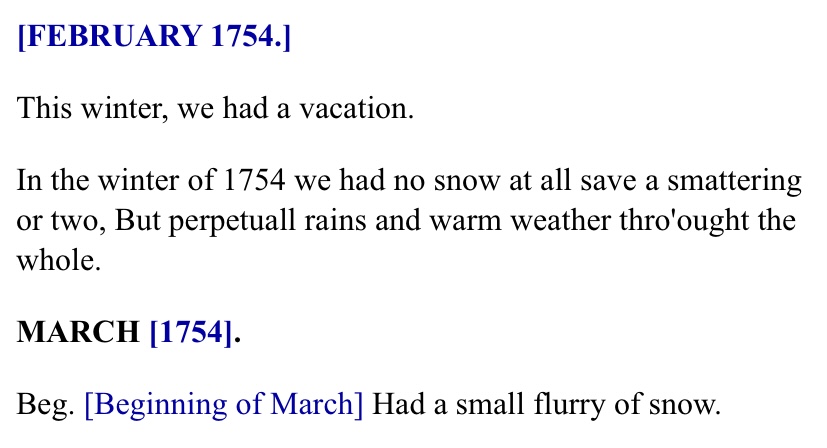
Right now, a "small flurry of snow" would be a welcome respite from the ongoing snow drought.
-
The probability of a measurable snowfall during the January 13-15 period has fallen sharply today. At this point, such an outcome appears unlikely. Things could still change somewhat given the timeframe involved.
-
The second warmest opening week of January is concluding in New York City, Newark, and Philadelphia. Even as somewhat cooler weather now prevails, no Arctic shots appear likely for the foreseeable future. The second week of January will be cooler, but a cold outcome is unlikely. The once moderate support for snowfall during the January 13-15 period diminished sharply. Just 6% of 12z EPS members show 1" or more snow for New York City. Prior to then, there remains a low probability of measurable snowfall tomorrow night into Monday. 2022 became the 14th year during which New York City received no measurable snowfall through December 31st. During the 13 prior years, mean seasonal snowfall was 16.0" (median seasonal snowfall: 16.3"). Just 8% of those winters rallied to see 30" or more seasonal snowfall. 31% of those winters wound up with less than 10" of seasonal snowfall. Just under half (46%) had 20" or more seasonal snowfall. The lowest seasonal snowfall for those cases of 2.8" was recorded in 1972-1973. The highest seasonal snowfall for those cases was 32.8", which occurred during 2015-2016. The ENSO Region 1+2 anomaly was -0.3°C and the Region 3.4 anomaly was -0.7°C for the week centered around December 28. For the past six weeks, the ENSO Region 1+2 anomaly has averaged -0.48°C and the ENSO Region 3.4 anomaly has averaged -0.87°C. La Niña conditions will likely persist through mid-winter before fading to neutral conditions. The SOI was +24.93 today. The preliminary Arctic Oscillation (AO) was -1.499 today. On January 5 the MJO was in Phase 7 at an amplitude of 1.041 (RMM). The January 4-adjusted amplitude was 1.102 (RMM). Based on sensitivity analysis applied to the latest guidance, there is an implied 96% probability that New York City will have a warmer than normal January (1991-2020 normal). January will likely finish with a mean temperature near 40.5° (6.8° above normal).
-
Of course, there were some bleak winters during the 18th century, too. From John Adams’ diary:
-
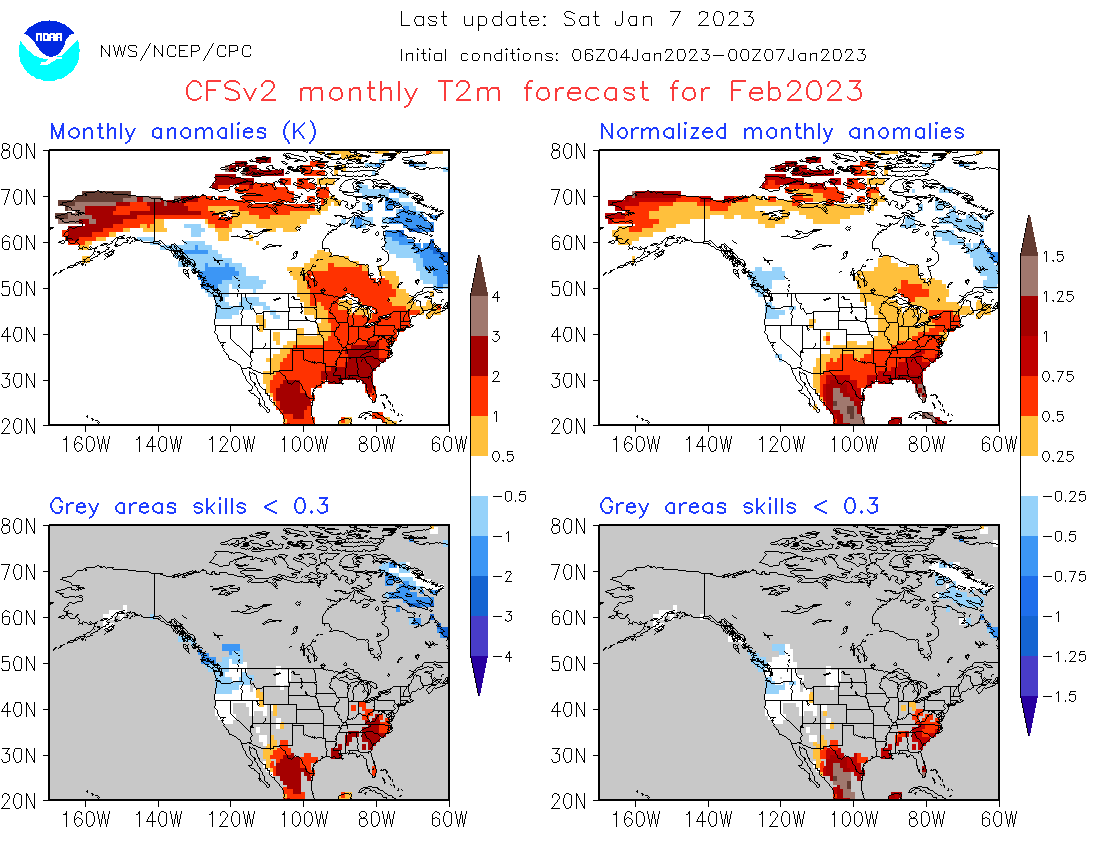
The actual CFSv2 forecast is for a warmer than normal February. Of course, at this range, skill is very low.