

donsutherland1
-
Posts
24,192 -
Joined
Content Type
Profiles
Blogs
Forums
American Weather
Media Demo
Store
Gallery
Everything posted by donsutherland1
-
Morning thoughts… Today will be mostly sunny and very cold. High temperatures will reach the upper 20s in most areas. Likely high temperatures around the region include: New York City (Central Park): 27° Newark: 29° Philadelphia: 29° A slow but steady warming trend will continue tomorrow. Normals: New York City: 30-Year: 41.9°; 15-Year: 42.8° Newark: 30-Year: 42.4°; 15-Year: 43.5° Philadelphia: 30-Year: 43.7°; 15-Year: 44.7°
-
Despite bright sunshine, temperatures were locked in the teens all day across the region. The core of the coldest air is now slowly departing. Tomorrow will be fair but continued very cold before steady moderation commences early next week. The first week of January will likely see much above normal temperatures across the region. The ENSO Region 1+2 anomaly was -0.1°C and the Region 3.4 anomaly was -0.9°C for the week centered around December 14. For the past six weeks, the ENSO Region 1+2 anomaly has averaged -0.95°C and the ENSO Region 3.4 anomaly has averaged -0.92°C. La Niña conditions will likely persist through mid-winter. The SOI was +25.33 today. The preliminary Arctic Oscillation (AO) was -3.611 today. On December 22 the MJO was in Phase 4 at an amplitude of 1.789 (RMM). The December 21-adjusted amplitude was 1.357 (RMM). Based on sensitivity analysis applied to the latest guidance, there is an implied 88% probability that New York City will have a colder than normal December (1991-2020 normal). December will likely finish with a mean temperature near 37.6° (1.5° below normal).
-
December 22nd - 23rd Cutter Discussion and Observations
donsutherland1 replied to NJwx85's topic in New York City Metro
February 11, 1908. High: 48; Low: -12 -
Historic Christmas Lake Effect Blizzard
donsutherland1 replied to BuffaloWeather's topic in Upstate New York/Pennsylvania
I'm sorry to hear of this tragedy, especially during the holiday season. -
December 22nd - 23rd Cutter Discussion and Observations
donsutherland1 replied to NJwx85's topic in New York City Metro
No. MPO once had a 60-degree range. -
December 22nd - 23rd Cutter Discussion and Observations
donsutherland1 replied to NJwx85's topic in New York City Metro
Some of yesterday’s records: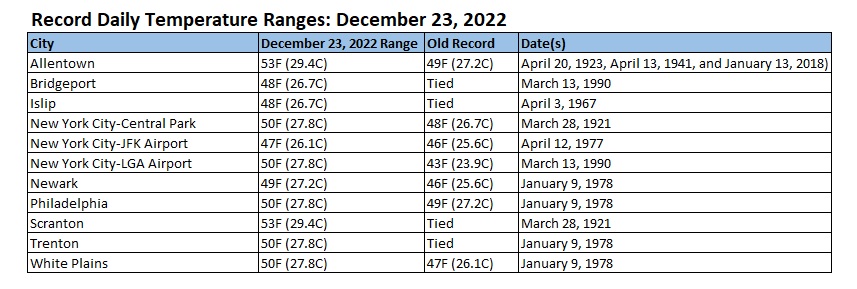
-
December 22nd - 23rd Cutter Discussion and Observations
donsutherland1 replied to NJwx85's topic in New York City Metro
Philadelphia also had a 50-degree range yesterday. -
Historic Christmas Lake Effect Blizzard
donsutherland1 replied to BuffaloWeather's topic in Upstate New York/Pennsylvania
The 72.0" through December 23rd is the 4th highest figure through that date. Only 1945, 1976, and 2000 had more. Both 1976 and 2000 had a lot more snow during the remainder of winter. -
Morning thoughts… Following yesterday’s historic drop in temperatures, today will be mostly sunny and very cold. High temperatures will reach the upper teens and lower 20s. Likely high temperatures around the region include: New York City (Central Park): 19° Newark: 21° Philadelphia: 21° Despite sunshine, it will again be very cold tomorrow. Normals: New York City: 30-Year: 42.1°; 15-Year: 43.0° Newark: 30-Year: 42.6°; 15-Year: 43.7° Philadelphia: 30-Year: 43.9°; 15-Year: 44.9° The last time New York City had a high temperature in the teens was January 31, 2019 when the high was 16°. The last time New York City had a high in the teens in December was December 28, 2017 when the temperature topped out at 17°.
-
That was likely the final figure.
-
December 22nd - 23rd Cutter Discussion and Observations
donsutherland1 replied to NJwx85's topic in New York City Metro
The December 23, 2022 low temperature in New York City was 8F (-13.3C). The temperature fell 50F (27.8C) from the day's high. That was the largest daily range on record. The prior mark of 48F (26.7C) was set on March 28, 1921. Records go back to 1869.- 426 replies
-
- 13
-

-

-
At 11 pm EST, the temperature in Philadelphia was 9F (-12.8C). The temperature has now fallen 50F (27.8C) from the day's high. That sets a new record for largest daily range. The old record was 49F (27.2C), which was set on January 9, 1978.
-
December 22nd - 23rd Cutter Discussion and Observations
donsutherland1 replied to NJwx85's topic in New York City Metro
At 11 pm EST, the temperature in New York City was 9F (-12.8C). The temperature has now fallen 49F (27.2C) from the day's high. That is the largest daily range on record. Records go back to 1869 with 56,165 days (including today) for which daily range data is available. -
At 10 pm EST, the temperature in Philadelphia was 11F (-11.7C). The temperature has now fallen 48F (26.7C) from the day's high. That is the second largest daily range on record.
-
December 22nd - 23rd Cutter Discussion and Observations
donsutherland1 replied to NJwx85's topic in New York City Metro
NYC is now at a daily range of 48 degrees. -
At 9 pm EST, the temperature in Philadelphia was 12F (-11.1C). The temperature has now fallen 47F (26.1C). That is tied with January 6, 2014 for the second largest daily range on record.
-
December 22nd - 23rd Cutter Discussion and Observations
donsutherland1 replied to NJwx85's topic in New York City Metro
At 9 pm EST, the temperature in New York City was 10F (-12.2C). The temperature has now fallen 48F (26.7C). That ties the record that was set on March 28, 1921 for the largest daily range. Records go back to 1869. -
December 22nd - 23rd Cutter Discussion and Observations
donsutherland1 replied to NJwx85's topic in New York City Metro
It will be tough, but we have a realistic shot at it. -
At 8 pm EST, the temperature in Philadelphia was 14F (-10.0C). The temperature has now fallen 45F (25.0C). That is only the 4th day on record on which there was a daily range of 45F (25.0C) or greater.
-
December 22nd - 23rd Cutter Discussion and Observations
donsutherland1 replied to NJwx85's topic in New York City Metro
At 8 pm EST, the temperature in New York City was 14F (-10.0C). The temperature has now fallen 44F (23.3C). That is only the 3rd day on record on which there was a daily range of 44F (24.4C) or greater and tied with April 25, 1915 for the 2nd largest daily range on record. -
December 22nd - 23rd Cutter Discussion and Observations
donsutherland1 replied to NJwx85's topic in New York City Metro
Yes. The record is 48 degrees. -
December 22nd - 23rd Cutter Discussion and Observations
donsutherland1 replied to NJwx85's topic in New York City Metro
New York City had a temperature of 18 at 6 pm EST. The high was 58. This is just the 19th day with a 40-degree or above daily range (0.03% of days in the climate record). The last 40-degree range occurred on December 22, 1998 when the mercury fell from 63F to 22F. -
High winds are continuing to blast frigid air into the region. At Central Park, the temperature has tumbled from an early high of 58° to 21° at 5 pm. The 37° range is among the top 0.09% of observations since recordkeeping began in 1869. Temperatures will bottom out in the lower teens in New York City tonight. There remains a modest chance (approximately 25%) that the mercury could reach the single digits in Central Park. Numerous locations outside New York City will likely see single-digit lows. Tomorrow will see the mercury struggle to reach 20° in New York City. Sunday will be fair and continued very cold before slow moderation commences early next week. The first week of January will likely see much above normal temperatures. The ENSO Region 1+2 anomaly was -0.1°C and the Region 3.4 anomaly was -0.9°C for the week centered around December 14. For the past six weeks, the ENSO Region 1+2 anomaly has averaged -0.95°C and the ENSO Region 3.4 anomaly has averaged -0.92°C. La Niña conditions will likely persist through mid-winter. The SOI was +50.96 today. That broke the daily record of +44.34 from 2003. It was also the second consecutive +50 reading. Only February 16-17, 2011 and April 1-2, 2011 had two consecutive days on which the SOI was +50 or above. The preliminary Arctic Oscillation (AO) was -3.323 today. On December 21 the MJO was in Phase 4 at an amplitude of 1.354 (RMM). The December 20-adjusted amplitude was 0.792 (RMM). Based on sensitivity analysis applied to the latest guidance, there is an implied 86% probability that New York City will have a colder than normal December (1991-2020 normal). December will likely finish with a mean temperature near 37.4° (1.7° below normal).
-
December 22nd - 23rd Cutter Discussion and Observations
donsutherland1 replied to NJwx85's topic in New York City Metro
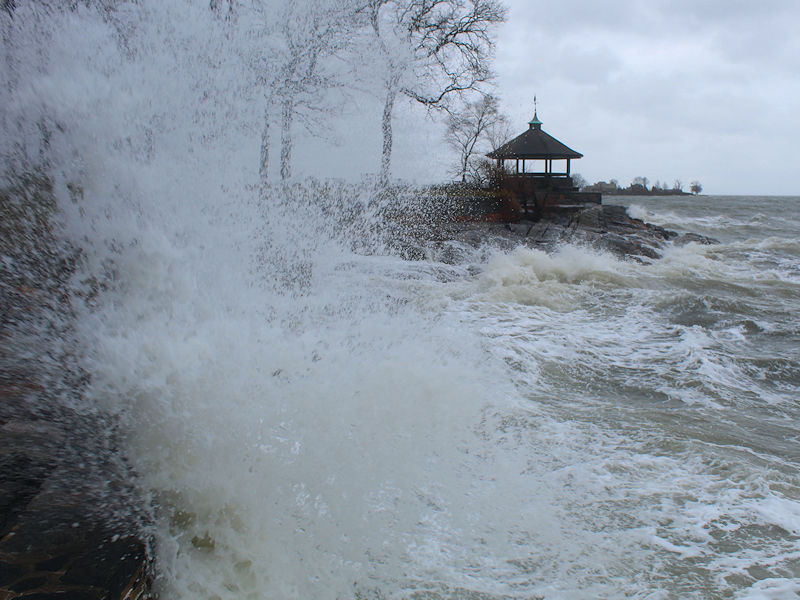
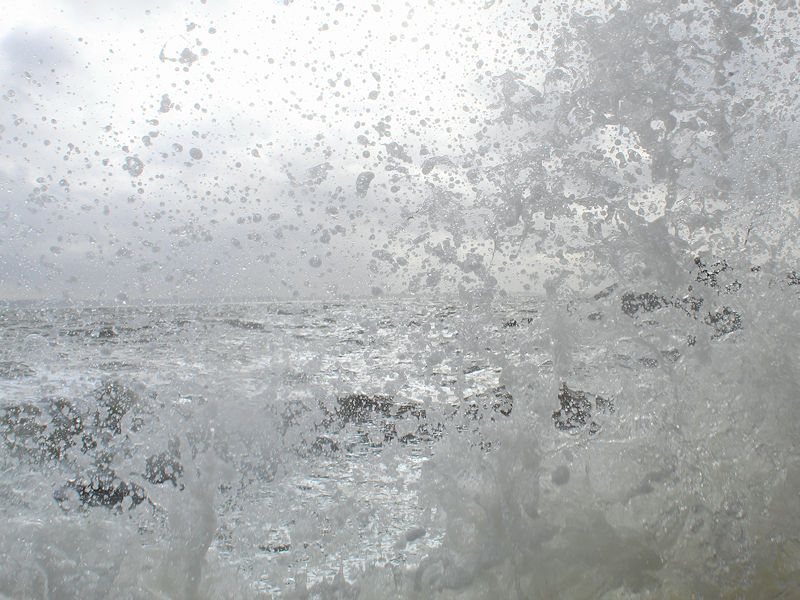
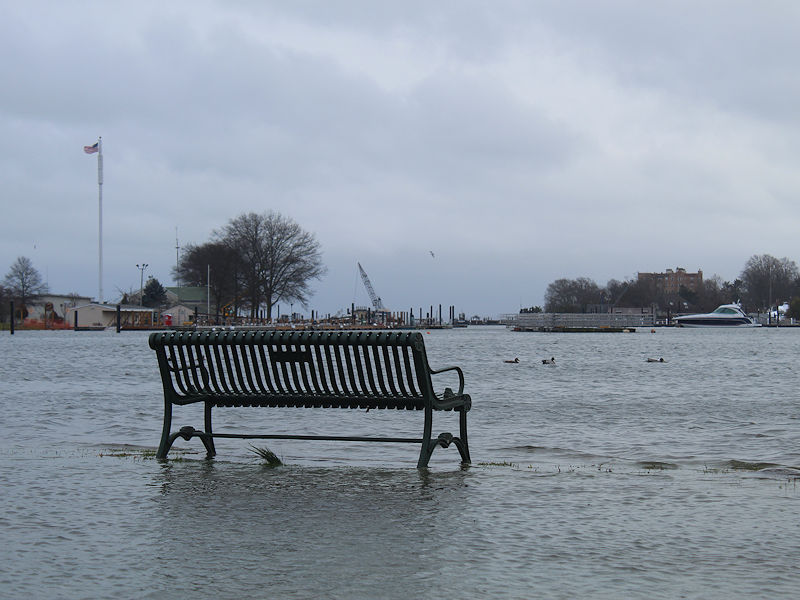
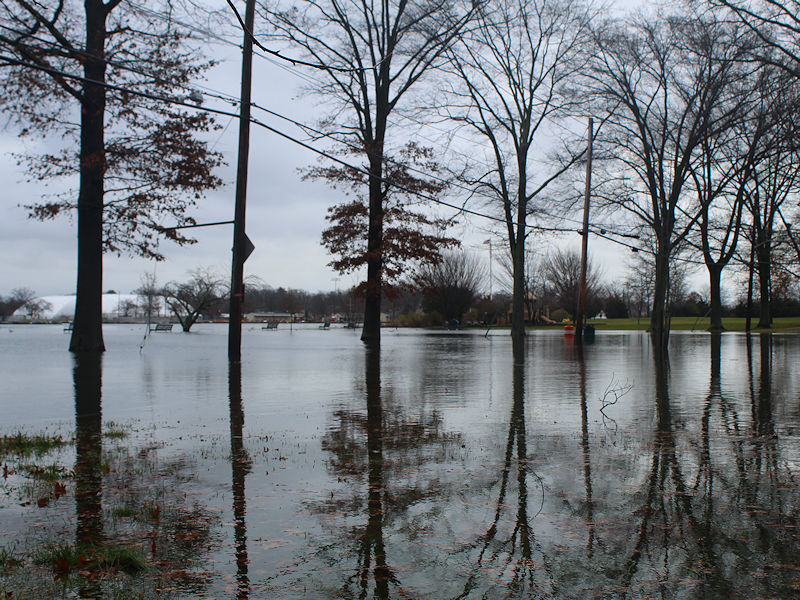
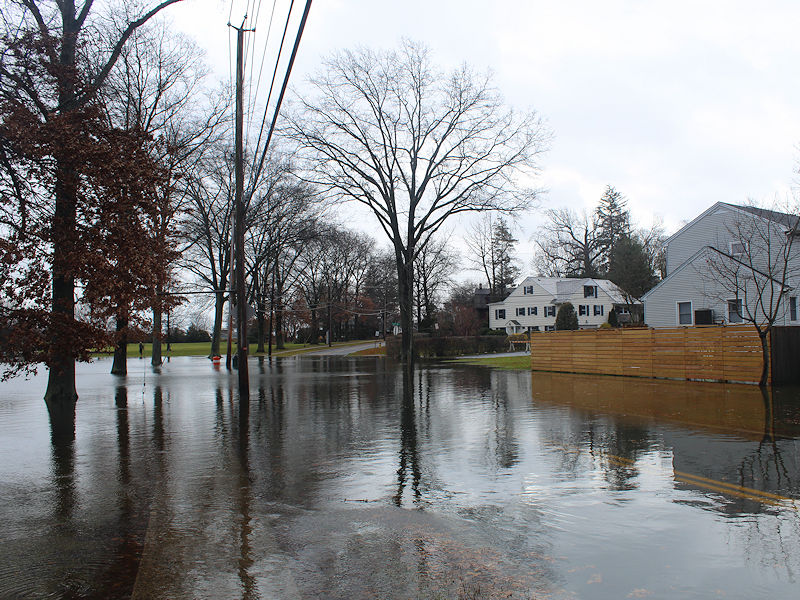
Some scenes from today along the Long Island Sound, including coastal flooding.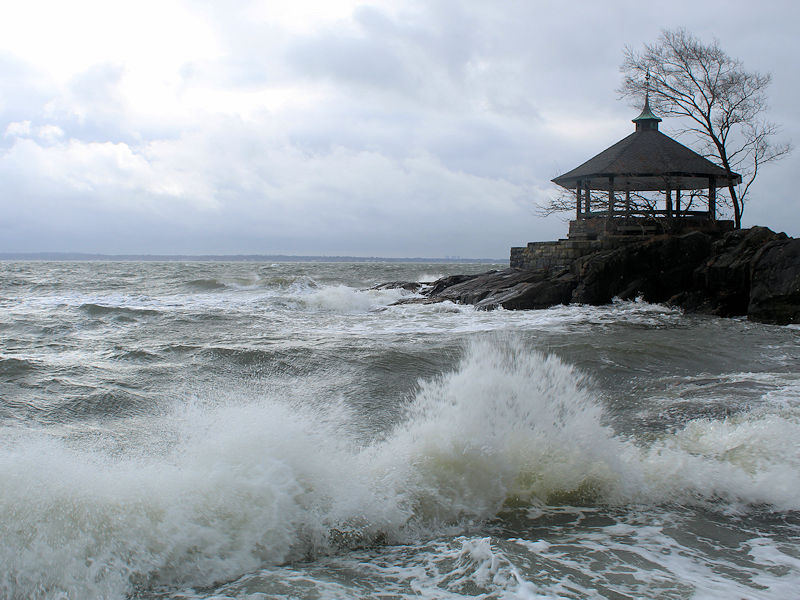
-
Historic Christmas Lake Effect Blizzard
donsutherland1 replied to BuffaloWeather's topic in Upstate New York/Pennsylvania
Perhaps it is. Nevertheless, very heavy snow is falling.
