

donsutherland1
-
Posts
24,192 -
Joined
Content Type
Profiles
Blogs
Forums
American Weather
Media Demo
Store
Gallery
Everything posted by donsutherland1
-
Tune in starting at 4:30 pm to find out.
-
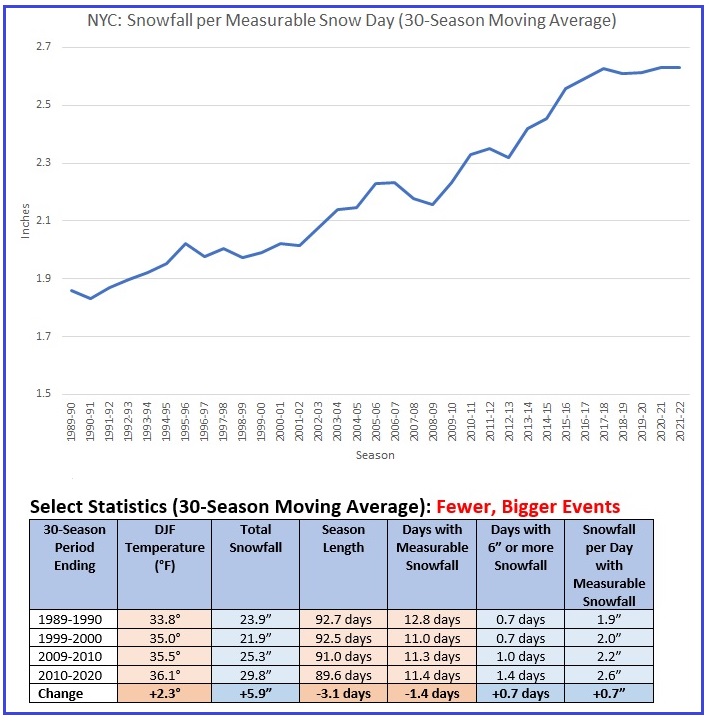
Some winter trends for New York City: Rising winter temperatures, rising seasonal snowfall, fewer but bigger events.
-
Morning thoughts… Today will be rainy and mild. High temperatures will reach the middle and upper 50s in most of the region. Some locations could reach 60°. Likely high temperatures around the region include: New York City (Central Park): 57° Newark: 59° Philadelphia: 59° Cooler air will return for tomorrow and Monday. A sustained cold pattern could develop around mid-month. Normals: New York City: 30-Year: 48.0°; 15-Year: 48.4° Newark: 30-Year: 48.6°; 15-Year: 49.1° Philadelphia: 30-Year: 49.6°; 15-Year: 50.3°
-
The PNA was +0.289 on 1/6 and +0.447 on 1/7.
-
-
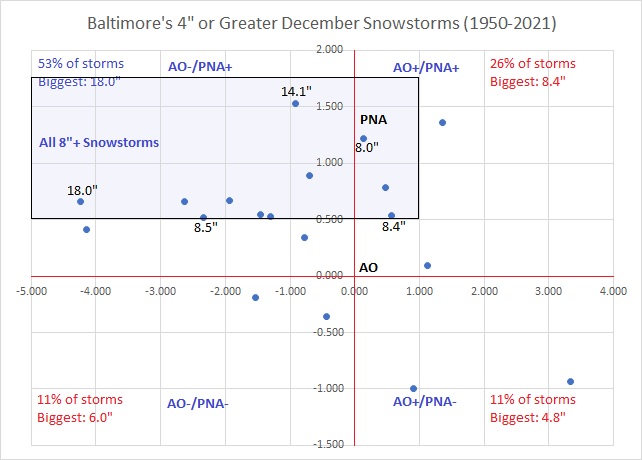
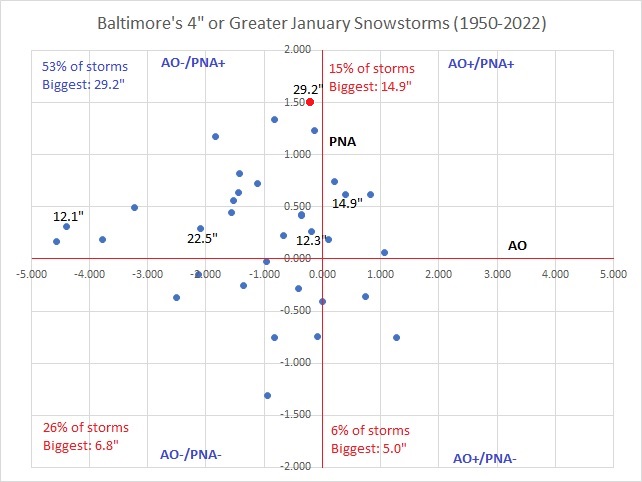
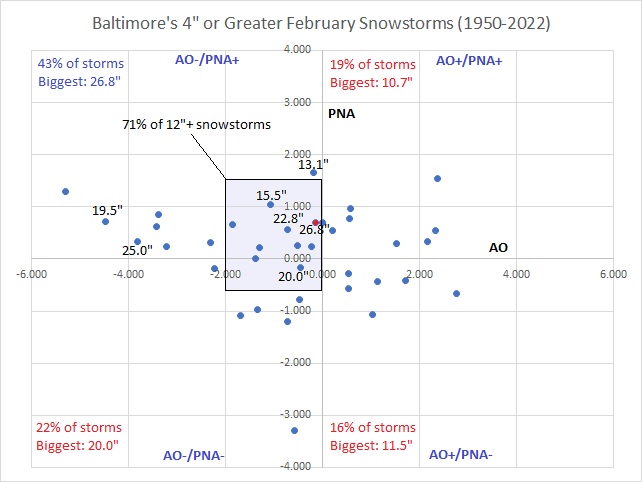
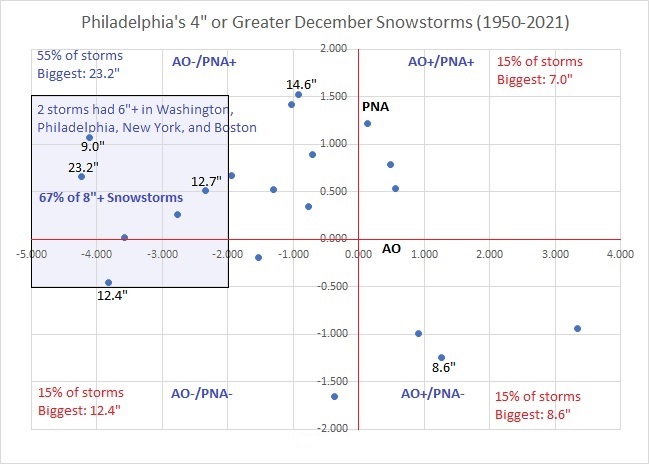
For ease of reference, I've included the AO/PNA charts for 4"+ snowstorms for Baltimore for December, January, and February here.
-
I will do so. Hopefully, sometime this evening or tomorrow.
-
A system will then bring warmer conditions and rain tomorrow before colder air returns to the region. Rain will likely overspread the region tomorrow morning. Most of the region will likely see 0.25"-0.50" of rain. With the development of an EPO-/AO-/PNA- pattern, colder air intrusions could become more frequent after the first week of December. The potential for snowfall could also begin to increase especially near or just after mid-month. The latest guidance suggests that the AO could fall to -3.000 or below during the second week of December. Since 1950, there were 24 cases that saw the AO reach -3.000 or below during December. Mean snowfall for those cases was 6.2" (Median: 6.0"). 50% of such cases saw December wind up with 6.0" or more snow (25% saw 10.0" or more). In contrast, during all other December cases, mean December snowfall was 3.5" (Median: 2.5"). In those cases, 21% of years saw December snowfall of 6.0" or more while 8% saw 10.0" or more snowfall. The ENSO Region 1+2 anomaly was -1.7°C and the Region 3.4 anomaly was -0.8°C for the week centered around November 23. For the past six weeks, the ENSO Region 1+2 anomaly has averaged -1.57°C and the ENSO Region 3.4 anomaly has averaged -0.92°C. La Niña conditions will likely persist through mid-winter. The SOI was +15.31 today. The preliminary Arctic Oscillation (AO) was -1.351 today. On November 30 the MJO was in Phase 8 at an amplitude of 0.954 (RMM). The November 29-adjusted amplitude was 1.223 (RMM).
-
Strong blocking patterns can take time to evolve where ridging and warmth in the East gives way to colder conditions and snowfall. November-December 2010 provides a good illustration:
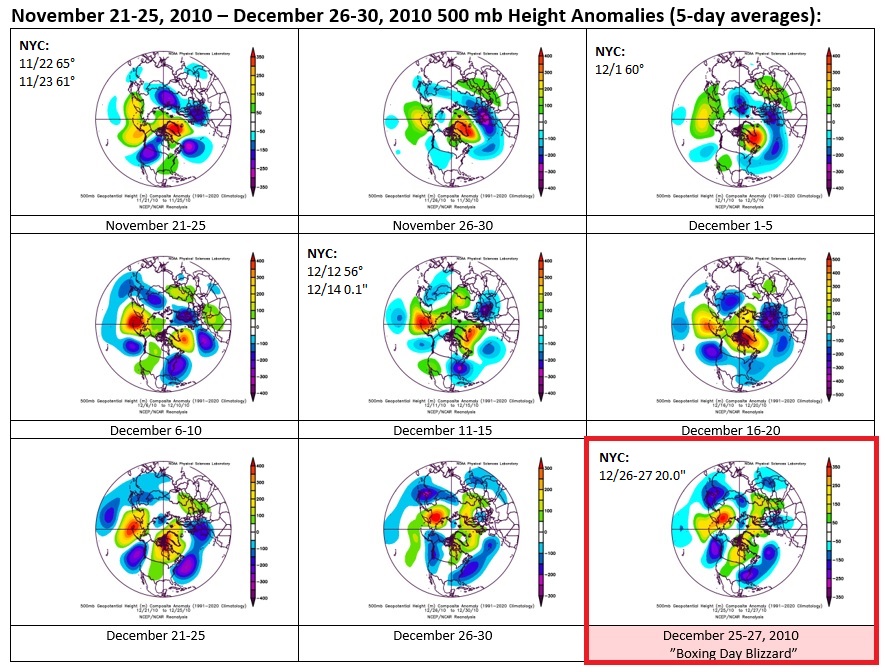
-
That’s only December.
-
Farther north is less dependent on the PNA, as it can benefit from Miller B storms that phase or rapidly develop too late to benefit most of the Mid-Atlantic region.
-
I’ve added to the Mid-Atlantic subforum.
- 852 replies
-
- 1
-

-
- hurricane
- tropical storm
- (and 1 more)
-
For reference:

-
For Washington or Baltimore?
-
For reference:
- 852 replies
-
- 5
-

-
-
- hurricane
- tropical storm
- (and 1 more)
-
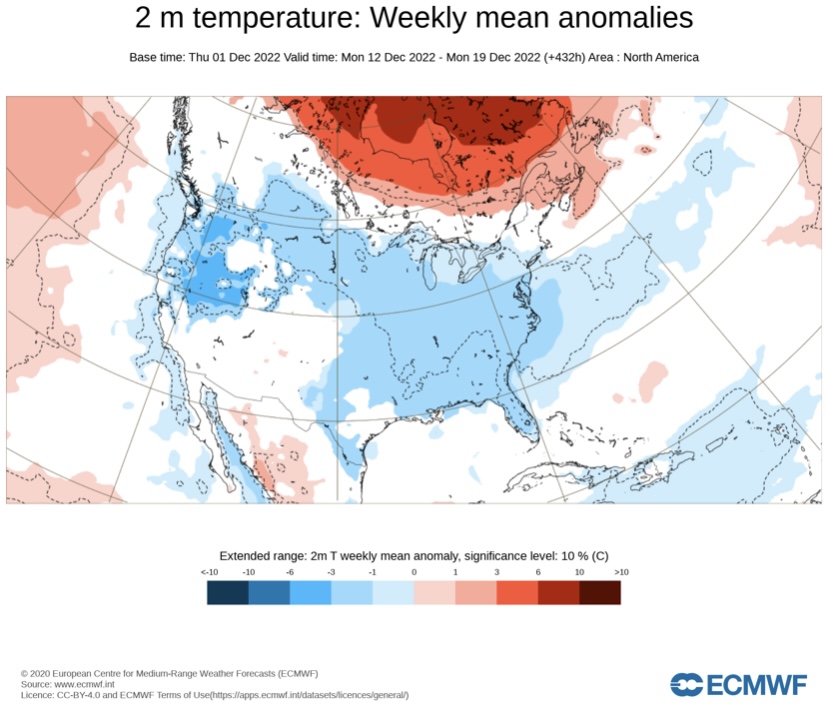
EPS temperature anomalies for December 12-19. The following week (lower skill) is also colder than normal in much of the East with near normal precipitation. No severe Arctic cold is currently indicated on the weeklies.
-
Morning thoughts… It will be partly sunny and cooler. High temperatures will reach the middle and upper 40s in most of the region. Likely high temperatures around the region include: New York City (Central Park): 45° Newark: 47° Philadelphia: 48° Tomorrow will see some rain, along with noticeably milder temperatures. Normals: New York City: 30-Year: 48.4°; 15-Year: 48.7° Newark: 30-Year: 48.9°; 15-Year: 49.4° Philadelphia: 30-Year: 50.0°; 15-Year: 50.6°
-
Have a happy birthday.
-
Tomorrow will be fair but cold. A system will then bring warmer conditions and rain for tomorrow night and Saturday before colder air returns to the region. With the development of an EPO-/AO-/PNA- pattern, colder air intrusions could become more frequent after the first week of December. The potential for snowfall could also begin to increase. The latest guidance suggests that the AO could fall to -3.000 or below during the second week of December. Since 1950, there were 24 cases that saw the AO reach -3.000 or below during December. Mean snowfall for those cases was 6.2" (Median: 6.0"). 50% of such cases saw December wind up with 6.0" or more snow (25% saw 10.0" or more). In contrast, during all other December cases, mean December snowfall was 3.5" (Median: 2.5"). In those cases, 21% of years saw December snowfall of 6.0" or more while 8% saw 10.0" or more snowfall. The ENSO Region 1+2 anomaly was -1.7°C and the Region 3.4 anomaly was -0.8°C for the week centered around November 23. For the past six weeks, the ENSO Region 1+2 anomaly has averaged -1.57°C and the ENSO Region 3.4 anomaly has averaged -0.92°C. La Niña conditions will likely persist through mid-winter. The SOI was +16.81 today. The preliminary Arctic Oscillation (AO) was -0.741 today. On November 29 the MJO was in Phase 8 at an amplitude of 1.228 (RMM). The November 28-adjusted amplitude was 1.590 (RMM).
-
Snowstorm near Christmas anytime would be nice.
-
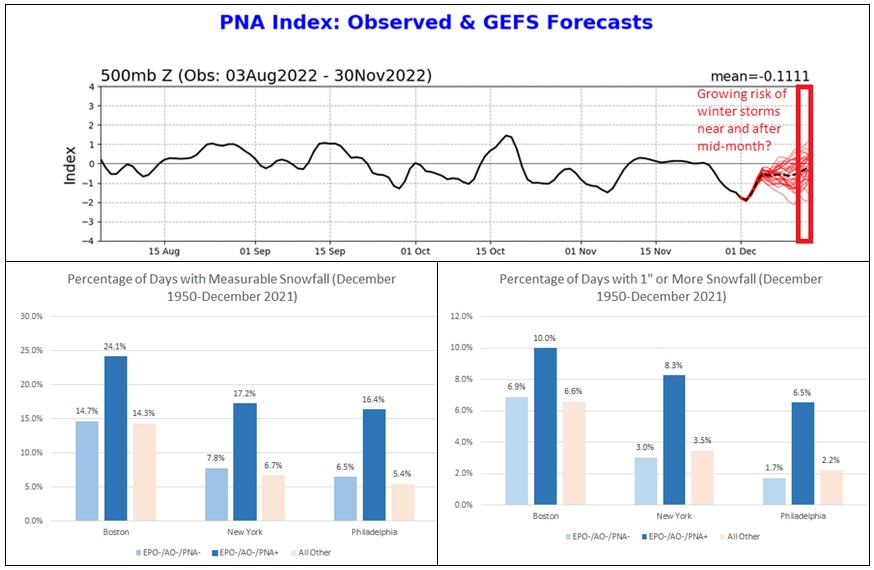
An EPO-/AO-/PNA- pattern is forecast to develop. The transition to sustained cold could occur during the second week of December. Afterward, as mid-month approaches, the PNA is forecast to rise toward neutral levels. The rise in the PNA could coincide with an increase in potential snowfalls. Below is the PNA forecast and statistics for the percentage of days with measurable snowfall and 1" or more snowfall under EPO-/AO-/PNA-, EPO-/AO-/PNA+ and all other patterns for December (1950-2021).
-
Morning thoughts… It will be partly to mostly sunny, blustery, and cooler. High temperatures will reach the lower and middle 40s in most of the region. Likely high temperatures around the region include: New York City (Central Park): 44° Newark: 46° Philadelphia: 44° Tomorrow will be fair and continued cool. Normals: New York City: 30-Year: 48.7°; 15-Year: 49.0° Newark: 30-Year: 49.3°; 15-Year: 49.8° Philadelphia: 30-Year: 50.3°; 15-Year: 50.9°
-
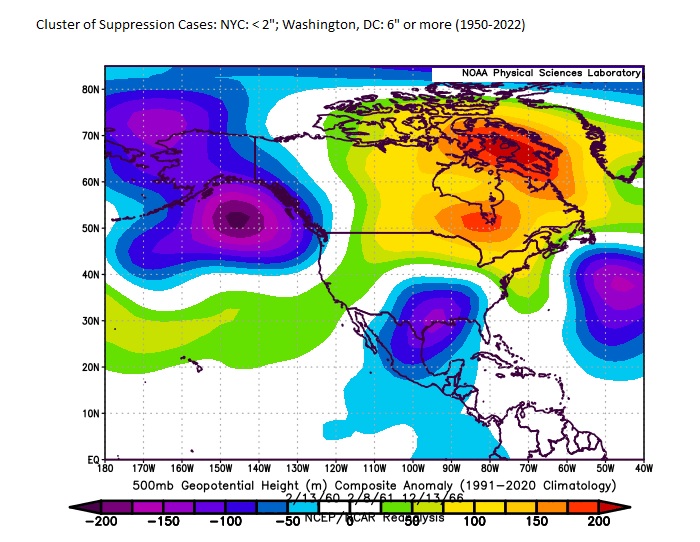
Below is a common cluster of suppression cases where significant snowfall reached Washington, DC, but snowfall in New York City was less than 2". The block was expansive into the CONUS. Right now, that isn't the forecast pattern evolution.
-
Congratulations. Nice article and photo.
-
New York City had a monthly mean temperature of 50.9° in November. That was 2.9° above normal. December could start mild overall. With the development of an EPO-/AO-/PNA- pattern, colder air intrusions could become more frequent after the first week of December. The potential for snowfall could also begin to increase. The latest guidance suggests that the AO could fall to -3.000 or below during the second week of December. Since 1950, there were 24 cases that saw the AO reach -3.000 or below during December. Mean snowfall for those cases was 6.2" (Median: 6.0"). 50% of such cases saw December wind up with 6.0" or more snow (25% saw 10.0" or more). In contrast, during all other December cases, mean December snowfall was 3.5" (Median: 2.5"). In those cases, 21% of years saw December snowfall of 6.0" or more while 8% saw 10.0" or more snowfall. The ENSO Region 1+2 anomaly was -1.7°C and the Region 3.4 anomaly was -0.8°C for the week centered around November 23. For the past six weeks, the ENSO Region 1+2 anomaly has averaged -1.57°C and the ENSO Region 3.4 anomaly has averaged -0.92°C. La Niña conditions will likely persist through mid-winter. The SOI was +27.80 today. The preliminary Arctic Oscillation (AO) was -1.836 today. On November 28 the MJO was in Phase 7 at an amplitude of 1.594 (RMM). The November 27-adjusted amplitude was 1.744 (RMM).
