donsutherland1
-
Posts
24,192 -
Joined
Content Type
Profiles
Blogs
Forums
American Weather
Media Demo
Store
Gallery
Everything posted by donsutherland1
-
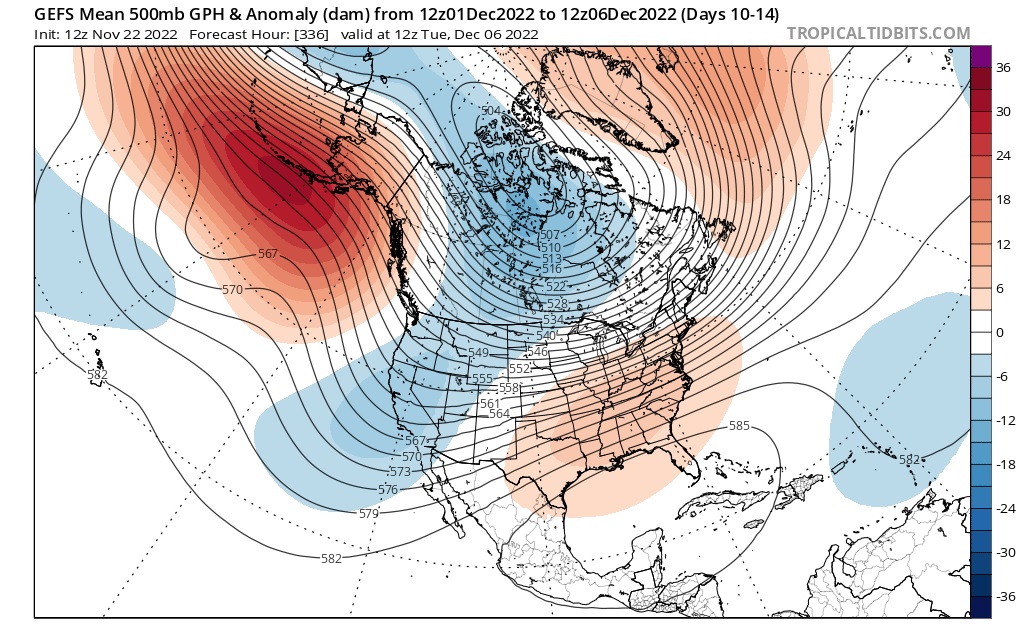
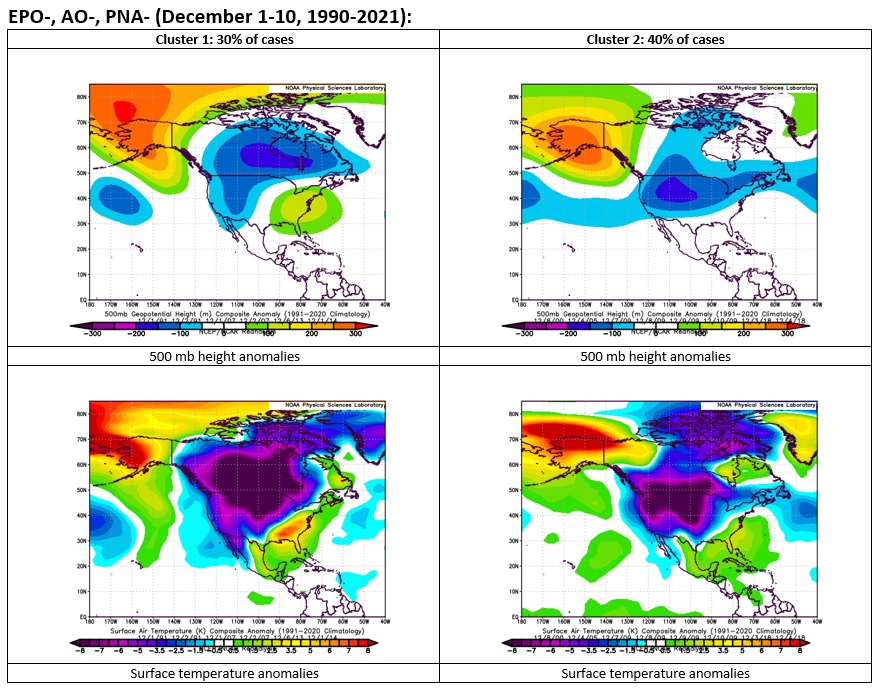
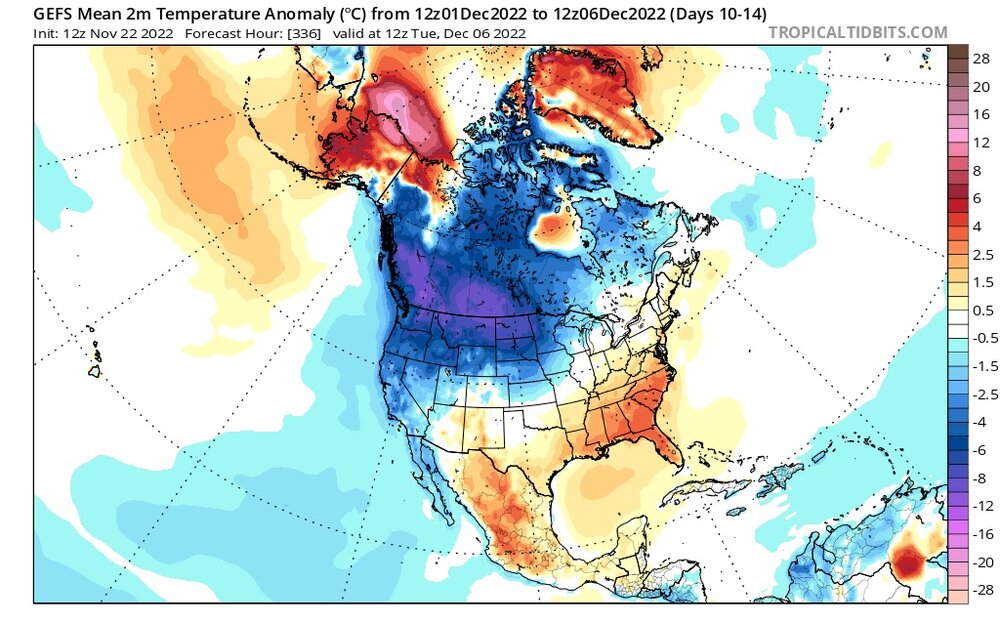
The latest teleconnections forecast suggests that the first 10 days of December could see an EPO-/AO-/PNA- pattern. During the December 1-10, 1990-2021 period, there were two major clusters of 500 mb outcomes that accounted for 70% of all such cases. The November 22, 2022 12z run of the GEFS suggests an outcome similar to Cluster 1 during the Day 10-14 period with the cold anomalies somewhat farther to the west than shown on the composite. What's noteworthy is that in both of the most common clusters of outcomes, there was expansive cold in Canada and parts of North America. Should such cold be present, there could be some potential for snowfall during the first half of December as the cold possibly tries to press eastward. All of the cases in Cluster 1 saw one or more snowfalls during the first half of December. In sum, there's some potential for wintry weather in the extended range. Of course, the forecast state of the teleconnections is subject to uncertainty at such extended timeframes.

-
Milder air moved back into the region today. High temperatures rose into the lower 50s in many areas including: Atlantic City: 55° Islip: 51° New York City: 51° Newark: 53° Philadelphia: 54° Tomorrow will see temperatures again top out in the 50s. The weekend could see some rainfall, along with continued mild readings. Overall, temperatures will generally be near to above normal through the remainder of November. The ENSO Region 1+2 anomaly was -1.3°C and the Region 3.4 anomaly was -0.8°C for the week centered around November 16. For the past six weeks, the ENSO Region 1+2 anomaly has averaged -1.62°C and the ENSO Region 3.4 anomaly has averaged -0.92°C. La Niña conditions will likely persist into the winter. The SOI was -6.62 today. The preliminary Arctic Oscillation (AO) was +0.154 today. On November 20 the MJO was in Phase 5 at an amplitude of 1.105 (RMM). The November 19-adjusted amplitude was 0.995 (RMM). Based on sensitivity analysis applied to the latest guidance, there is an implied 91% probability that New York City will have a warmer than normal November (1991-2020 normal). November will likely finish with a mean temperature near 49.9° (1.9° above normal).
-
Upstate/Eastern New York-Into Winter!
donsutherland1 replied to BuffaloWeather's topic in Upstate New York/Pennsylvania
Thanks for this information. -
Upstate/Eastern New York-Into Winter!
donsutherland1 replied to BuffaloWeather's topic in Upstate New York/Pennsylvania
On November 19, 2022, Buffalo picked up 21.5" daily snowfall during a 4-day lake effect snowstorm that deposited 36.6" of snow. The average highest daily snowfall during the snow season has been increasing in recent years.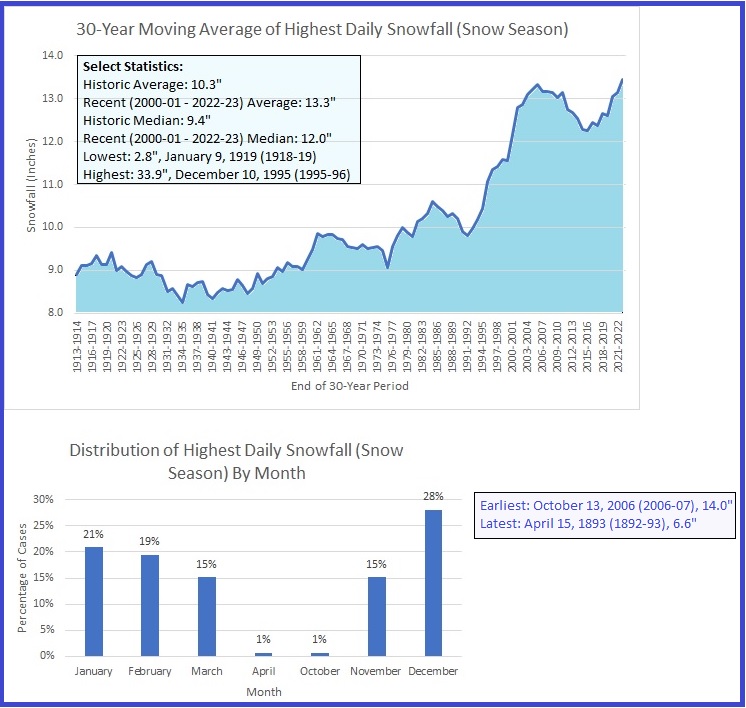
-
Yes. Most days will have highs of 50 or above for the remainder of November.
-
Morning thoughts… Today will be mostly sunny and noticeably milder. High temperatures will reach the upper 40s and lower 50s in most of the region. Likely high temperatures around the region include: New York City (Central Park): 50° Newark: 52° Philadelphia: 53° The remainder of November will be generally warmer than normal. Normals: New York City: 30-Year: 51.8°; 15-Year: 51.9° Newark: 30-Year: 52.5°; 15-Year: 52.8° Philadelphia: 30-Year: 53.5°; 15-Year: 53.7°
-
Historic Lake Effect Event?! 11/17-11/21
donsutherland1 replied to BuffaloWeather's topic in Upstate New York/Pennsylvania
Many thanks. I will look forward to adding them. -
Milder air will be moving into the region starting tomorrow. From midweek through the end of the month, temperatures will likely be generally above normal. A moderate to significant rainfall is likely in coastal sections from Friday into Saturday. The ENSO Region 1+2 anomaly was -1.3°C and the Region 3.4 anomaly was -0.8°C for the week centered around November 16. For the past six weeks, the ENSO Region 1+2 anomaly has averaged -1.62°C and the ENSO Region 3.4 anomaly has averaged -0.92°C. La Niña conditions will likely persist into the winter. The SOI was +0.95 today. The preliminary Arctic Oscillation (AO) was +0.442 today. On November 19 the MJO was in Phase 5 at an amplitude of 0.999 (RMM). The November 18-adjusted amplitude was 1.016 (RMM). Based on sensitivity analysis applied to the latest guidance, there is an implied 90% probability that New York City will have a warmer than normal November (1991-2020 normal). November will likely finish with a mean temperature near 49.8° (1.8° above normal).
-
This morning, all of the NYC stations are in the 20s.
-
Morning thoughts… After a very cold start, it will be partly sunny, breezy, and cold. High temperatures will reach the upper 30s and lower 40s in most of the region. Likely high temperatures around the region include: New York City (Central Park): 40° Newark: 43° Philadelphia: 44° Temperatures will begin to moderate tomorrow. Normals: New York City: 30-Year: 52.1°; 15-Year: 52.2° Newark: 30-Year: 52.9°; 15-Year: 53.1° Philadelphia: 30-Year: 53.8°; 15-Year: 54.0°
-
The record warm start to November all but sealed the overall monthly anomaly.
-
Historic Lake Effect Event?! 11/17-11/21
donsutherland1 replied to BuffaloWeather's topic in Upstate New York/Pennsylvania
http://wintercenter.homestead.com/photoindex.html I hope to have an SSL link soon. -
Historic Lake Effect Event?! 11/17-11/21
donsutherland1 replied to BuffaloWeather's topic in Upstate New York/Pennsylvania
BuffaloWeather has generously contributed photos from a number of LES storms. -
Historic Lake Effect Event?! 11/17-11/21
donsutherland1 replied to BuffaloWeather's topic in Upstate New York/Pennsylvania
Roger, The December 1976- January 1977 period was notable for the number of snowy days, total amount of snowfall, and sustained cold that led the snow to pile up. Select Statistics: December 1976: 60.7" January 1977: 68.3" Total: 129.0" 10" or more daily snowfall: December 2, 1976: 16.6" (18th biggest daily snowfall on record) December 23, 1976: 12.6" January 10, 1977: 13.2" Days with snowfall: 59 (95%) Days with measurable snowfall: 54 (87%) Mean temperature for the period: 17.9° Average high temperature for the period: 24.8° Average low temperature for the period: 11.0° Days with high temperatures of 32° or below: 49 (79%) Days with low temperatures below 0°: 6 (10%) Highest maximum temperature: 46°, December 19-20, 1976 Lowest maximum temperature: 4°, January 17, 1977 Highest minimum temperature: 29°, December 17, 1976 Lowest minimum temperature: -7°, January 29, 1977 -
After some additional intense lake effect snows last night and, continuing snowfall along Lake Ontario today, storm total snowfall amounts include: Athol Springs: 76.0" Buffalo: 36.9" Derby: 81.4" Hamburg: 77.3" Orchard Park (1 NE): 80.0" Watertown: 61.0" Buffalo picked up 21.5" of snow yesterday. That was only its 6th daily snowfall of 20" or more on record since recordkeeping began in 1884. All such snowfalls have occurred since 1995. In addition 45% of Buffalo's top 20 daily snowfalls--including 15% this year--have occurred since 2000. Tomorrow will be fair and unseasonably cold. However, by midweek, it will be turning milder. A moderate to significant rainfall is likely in coastal sections from Friday into Saturday. The ENSO Region 1+2 anomaly was -1.4°C and the Region 3.4 anomaly was -1.0°C for the week centered around November 9. For the past six weeks, the ENSO Region 1+2 anomaly has averaged -1.67°C and the ENSO Region 3.4 anomaly has averaged -0.93°C. La Niña conditions will likely persist into the winter. The SOI was +2.92 today. The preliminary Arctic Oscillation (AO) was +0.735 today. On November 18 the MJO was in Phase 5 at an amplitude of 1.024 (RMM). The November 17-adjusted amplitude was 0.818 (RMM). Based on sensitivity analysis applied to the latest guidance, there is an implied 85% probability that New York City will have a warmer than normal November (1991-2020 normal). November will likely finish with a mean temperature near 49.7° (1.7° above normal).
-
Historic Lake Effect Event?! 11/17-11/21
donsutherland1 replied to BuffaloWeather's topic in Upstate New York/Pennsylvania
A disproportionate share of big daily snowfalls have occurred in recent decades. Here are Buffalo's 20 biggest daily snowfalls.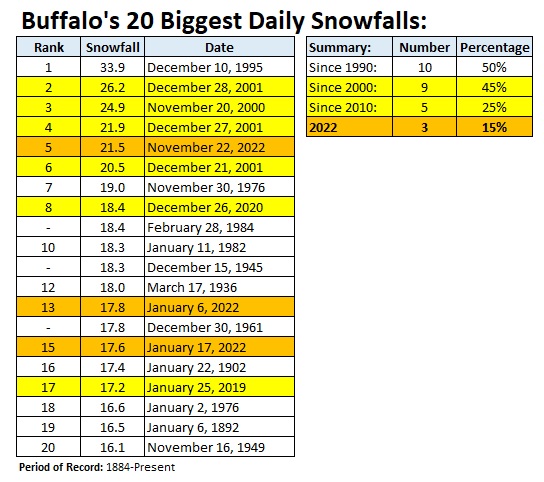
-
Historic Lake Effect Event?! 11/17-11/21
donsutherland1 replied to BuffaloWeather's topic in Upstate New York/Pennsylvania
Buffalo picked up 21.5” of snow yesterday. That was only its 6th day with daily snowfall of 20” or more & its earliest on record. Snowfall records go back to 1884.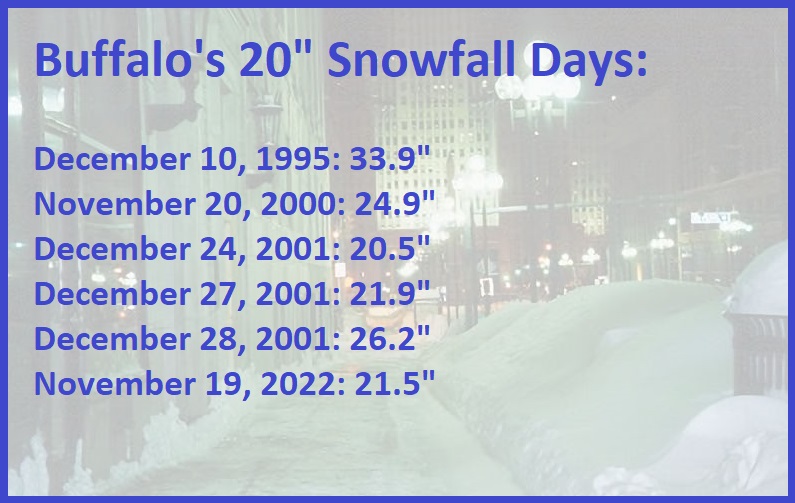
-
Morning thoughts… It will be mostly sunny, breezy, and cold. A few areas could see a snow flurry. High temperatures will reach the upper 30s in most of the region. Likely high temperatures around the region include: New York City (Central Park): 38° Newark: 40° Philadelphia: 38° Colder than normal temperatures will continue until the middle of the week. Normals: New York City: 30-Year: 52.5°; 15-Year: 52.6° Newark: 30-Year: 53.2°; 15-Year: 53.5° Philadelphia: 30-Year: 54.2°; 15-Year: 54.4°
-
No. This is a big but not biggest LES event.
-
Historic Lake Effect Event?! 11/17-11/21
donsutherland1 replied to BuffaloWeather's topic in Upstate New York/Pennsylvania
1/8 mile visibility at Greater Buffalo International Airport. -
At least three locations have now seen six feet of snow in western New York State: Orchard Park: 77.0" Hamburg: 73.7" Natural Bridge (3 SW): 72.3" Parts of the area could see another 4"-8" of snow overnight into tomorrow. From New York City to Philadelphia, tranquil weather will continue. However, the season's coldest air so far will pour into the region by the end of the weekend. Afterward, generally colder than normal weather will continue through at least early next week before it turns briefly milder. The ENSO Region 1+2 anomaly was -1.4°C and the Region 3.4 anomaly was -1.0°C for the week centered around November 9. For the past six weeks, the ENSO Region 1+2 anomaly has averaged -1.67°C and the ENSO Region 3.4 anomaly has averaged -0.93°C. La Niña conditions will likely persist into the winter. The SOI was +9.67 today. The preliminary Arctic Oscillation (AO) was +0.181 today. On November 17 the MJO was in Phase 5 at an amplitude of 0.819 (RMM). The November 16-adjusted amplitude was 0.695 (RMM). Based on sensitivity analysis applied to the latest guidance, there is an implied 79% probability that New York City will have a warmer than normal November (1991-2020 normal). November will likely finish with a mean temperature near 49.5° (1.5° above normal).
-
Despite brilliant sunshine, the temperature reached only the lower 40s in the New York City area.
-
Historic Lake Effect Event?! 11/17-11/21
donsutherland1 replied to BuffaloWeather's topic in Upstate New York/Pennsylvania
I agree. Orchard Park reported 77.0”. Your figures are not an outlier. They are well in line with what’s been reported. You should report them to the NWS if you haven’t already done so. -
3 SW Natural Bridge is now at 70.9”
-
It is also the lowest figure on record for November.