

donsutherland1
-
Posts
24,192 -
Joined
Content Type
Profiles
Blogs
Forums
American Weather
Media Demo
Store
Gallery
Everything posted by donsutherland1
-
Morning thoughts… It will be variably cloudy, very warm, and humid today. Some showers are possible. High temperatures will reach the middle and upper 70s in most of the region. Likely high temperatures around the region include: New York City (Central Park): 75° Newark: 77° Philadelphia: 79° Unseasonably warm weather will continue through tomorrow. Normals: New York City: 30-Year: 57.2°; 15-Year: 57.3° Newark: 30-Year: 58.4°; 15-Year: 58.7° Philadelphia: 30-Year: 59.4°; 15-Year: 59.3°
-
It was. This will almost certainly be the warmest first week of November in much of the region.
-
Today was another exceptionally warm November day. Readings soared into the middle and upper 70s across the region. The warmth extended across northern New England into Canada. Records included: Allentown: 75° (tied record set in 1935 and tied in 1994) Albany: 76° (old record: 75°, 1994) Atlantic City: 76° (tied record set in 1961 and tied in 2003) Bangor: 73° (old record: 71°, 1938) Bridgeport: 73° (old record: 72°, 1961) Buffalo: 79° (old record: 76°, 1948) Burlington: 74° (old record: 72°, 1938) Caribou: 73° (old record: 67°, 1982) Concord: 78° (old record: 75°, 1994) Hartford: 78° (old record: 76°, 1994) Islip: 74° (old record: 70°, 1975, 2005, and 2015) Manchester, NH: 79° (old record: 75°, 2015) ***New November Record*** Montreal: 74° (old record: 66°, 1988) ***New November Record*** New Haven: 74° (old record: 72°, 1961 and 1975) New York City-LGA: 75° (old record: 74°, 2005) Newark: 79° (old record: 77°, 1959) Portland: 75° (old record: 71°, 1994) Providence: 75° (tied record set in 1994) Quebec City: 72° (old record: 63°, 2008) Rivière-du-Loup, QC: 68° (old record: 58°, 2008) Saguenay, QC: 70° (old record: 67°, 2008) Rochester: 77° (old record: 75°, 2015) Syracuse: 77° (old record: 73°, 2015) White Plains: 75° (old record: 73°, 2005) Caribou recorded its first ever 70° November temperature in 2020. Today, it recorded its second ever November temperature. Saint-Anicet, Quebec set a provincial November record high reading of 78°. Tonight, one will turn back the clocks one hour. In terms of weather, one will turn the calendar back to mid-September. Temperatures will again reach the middle 70s across many parts of the region tomorrow. On Monday, a few places could approach or reach 80°. Afterward, it will become briefly cooler before temperatures rebound to much above normal levels. Noticeably cooler air will likely arrive by next weekend. Beyond mid-month, there are some emerging signals that Atlantic blocking could try to develop. Since 1869, there have been just 7 prior years with a November 1-7 average temperature of 60.0° or above in New York City: 1938, 1961, 1974, 1975, 1994, 2003, and 2015. All of those cases saw a warmer to much warmer than normal November with a mean monthly temperature of 50.3° (lowest: 48.2°, 1974; highest: 52.8°, 2015). On a standardized basis, 6/7 (86%) cases were 0.5 sigma or more above the 30-year moving average (implied 49.4° average for the most recent 30-year period) and 4/7 (57%) were 1.0 sigma or more above the 30-year moving average (implied 51.0° average for the most recent 30-year moving average). There was no clear seasonal snowfall outcome following such a warm start to November. Four cases saw less than 20" of seasonal snowfall (1961-1962, 1974-1975, 1975-1976, and 1994-1995); three cases saw more than 30" of seasonal snowfall (1938-1939, 2003-2004, and 2015-2016). The lowest seasonal snowfall occurred in 1994-95 when 11.8" fell. The highest amount was 42.6" in 2003-2004. The ENSO Region 1+2 anomaly was -1.8°C and the Region 3.4 anomaly was -1.0°C for the week centered around October 26. For the past six weeks, the ENSO Region 1+2 anomaly has averaged -1.58°C and the ENSO Region 3.4 anomaly has averaged -0.85°C. La Niña conditions will likely persist into the winter. The SOI was -8.40 today. The preliminary Arctic Oscillation (AO) was +1.662 today. On November 3 the MJO was in Phase 7 at an amplitude of 1.790 (RMM). The November 2-adjusted amplitude was 1.837 (RMM).
-
And, LGA , too.
-
With abundant sunshine, temperatures rose to near record and record levels in the New York City area and its suburbs.
-
Several potential record high-tying or breaking minimum temperatures were recorded this morning. Islip: 60° (Record: 56°, 1988) New York City-JFK: 60° (Record: 60°, 1961 and 1984) New York City-LGA: 63° (Record: 61°, 1961) New York City-NYC: 64° (Record: 63°, 1938) Newark: 61° (Record: 61°, 1938 and 1961)
-
Morning thoughts… Morning clouds will give way to partly sunny and very warm conditions. High temperatures will reach the lower and middle 70s in most of the region. Likely high temperatures around the region include: New York City (Central Park): 73° Newark: 76° Philadelphia: 78° Unseasonably warm weather will continue through the weekend. Normals: New York City: 30-Year: 57.6°; 15-Year: 57.6° Newark: 30-Year: 58.7°; 15-Year: 59.1° Philadelphia: 30-Year: 59.8°; 15-Year: 59.7°
-
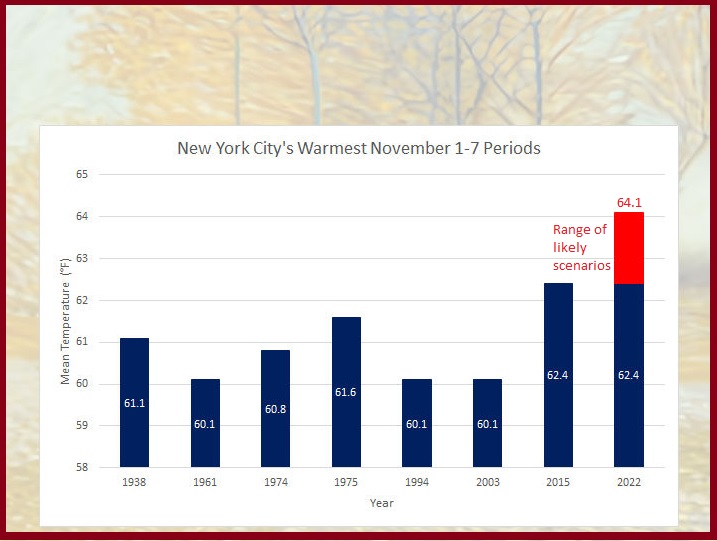
Through this evening, the first week of November has a mean temperature of 61.5° in New York City's Central Park. The record of 62.4° was set during 2015. That record will likely be surpassed this year. At present, it appears that the first week of November will wind up with a mean temperature ranging from 62.4° to 64.1° (central estimate near 63.2°).
-
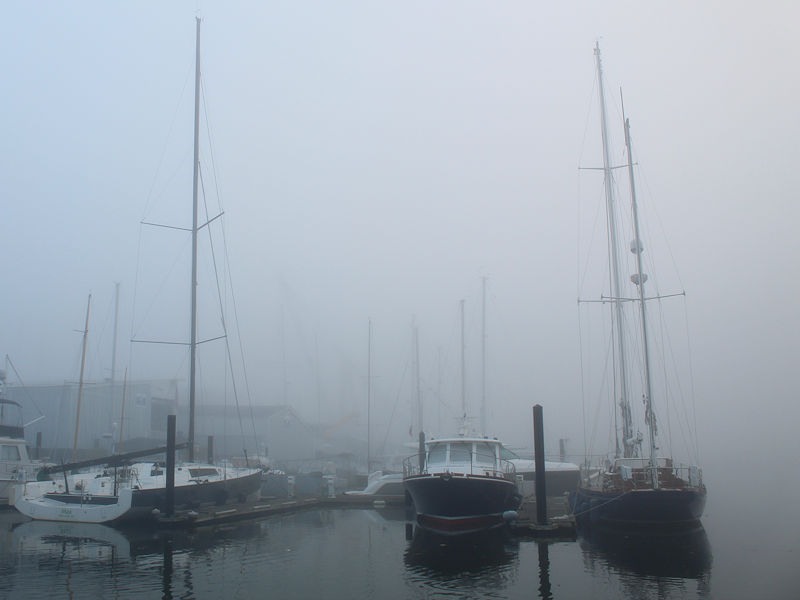
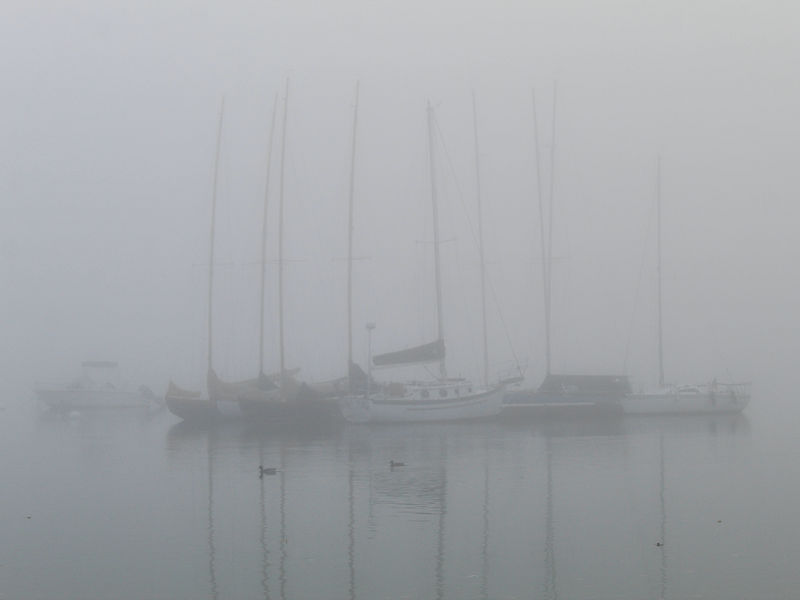
Thick fog cloaked the coastal landscape during the early morning hours. Afterward, the sun burned away the fog and sent the mercury soaring into the upper 60s and lower 70s. High temperatures included: Albany: 71° Allentown: 71° Atlantic City: 74° Baltimore: 72° Boston: 72° Bridgeport: 67° Concord: 73° Hartford: 73° Islip: 72° New York City-JFK: 68° New York City-LGA: 71° New York City-NYC: 70° Newark: 73° Philadelphia: 73° Portland: 69° Poughkeepsie: 72° Providence: 72° Rochester: 73° Syracuse: 74° Washington, DC: 75° The November 1-7 average temperatures for select locations through November 4th 5 pm, along with the November 1-7 records are: Bridgeport: 57.8° (Record: 58.1°, 1975) Islip: 58.4° (Record: 58.1°, 1977 and 2015) New York City-JFK: 59.8° (Record: 60.9°, 2015) New York City-LGA: 62.4° (Record: 62.9°, 2015) New York City-NYC: 61.5° (Record: 62.4°, 2015) Newark: 62.0° (Record: 61.3°, 2015) Philadelphia: 61.1° (Record: 62.5°,1974) Across western New York, northern New England, Ontario and Quebec, some record high temperatures were set. Records included: Buffalo: 74° (old record: 73°, 1938 and 2015) Caribou: 67° (old record: 66°, 1982) Montreal: 68° (old record: 65°, 1956) Ottawa: 69° (old record: 66°, 1938) Quebec City: 61° (old record: 56°, 2015) Saguenay, QC: 67° (old record: 58°, 1997) Toronto: 69° (old record: 68°, 1987) More warmth lies ahead. The warmth will peak during the weekend into Monday. Afterward, it could become cooler. However, no exceptionally cold weather appears likely in the East through at least the first 10-14 days of November. Since 1869, there have been just 7 prior years with a November 1-7 average temperature of 60.0° or above in New York City: 1938, 1961, 1974, 1975, 1994, 2003, and 2015. All of those cases saw a warmer to much warmer than normal November with a mean monthly temperature of 50.3° (lowest: 48.2°, 1974; highest: 52.8°, 2015). On a standardized basis, 6/7 (86%) cases were 0.5 sigma or more above the 30-year moving average (implied 49.4° average for the most recent 30-year period) and 4/7 (57%) were 1.0 sigma or more above the 30-year moving average (implied 51.0° average for the most recent 30-year moving average). There was no clear seasonal snowfall outcome following such a warm start to November. Four cases saw less than 20" of seasonal snowfall (1961-1962, 1974-1975, 1975-1976, and 1994-1995); three cases saw more than 30" of seasonal snowfall (1938-1939, 2003-2004, and 2015-2016). The lowest seasonal snowfall occurred in 1994-95 when 11.8" fell. The highest amount was 42.6" in 2003-2004. The ENSO Region 1+2 anomaly was -1.8°C and the Region 3.4 anomaly was -1.0°C for the week centered around October 26. For the past six weeks, the ENSO Region 1+2 anomaly has averaged -1.58°C and the ENSO Region 3.4 anomaly has averaged -0.85°C. La Niña conditions will likely persist into the winter. The SOI was -2.36 today. The preliminary Arctic Oscillation (AO) was +1.041 today. On November 2 the MJO was in Phase 7 at an amplitude of 1.715 (RMM). The November 1-adjusted amplitude was 1.769 (RMM).
-
At noon, temperatures in the NYC area range from 58 at LaGuardia Airport to 69 at Islip.
-
Ahead of another very warm November day, parts of the New York City region saw thick fog develop during the morning hours.

-
Morning thoughts… Morning fog will burn off and today will be partly to mostly sunny and very warm. High temperatures will reach the upper 60s and lower 70s in most of the region. Likely high temperatures around the region include: New York City (Central Park): 69° Newark: 72° Philadelphia: 74° Unseasonably warm weather will continue through the weekend. Normals: New York City: 30-Year: 57.9°; 15-Year: 58.0° Newark: 30-Year: 59.1°; 15-Year: 59.4° Philadelphia: 30-Year: 60.1°; 15-Year: 60.1°
-
Today was likely the coolest day the region will see during the first week of November. Nevertheless, temperatures remained well above seasonal norms. The November 1-7 average temperatures for select locations (through November 3 5 pm) are: Bridgeport: 58.3° (Record: 58.1°, 1975) Islip: 58.3° (Record: 58.1°, 1977 and 2015) New York City-JFK: 60.5° (Record: 60.9°, 2015) New York City-LGA: 62.5° (Record: 62.9°, 2015) New York City-NYC: 61.5° (Record: 62.4°, 2015) Newark: 62.3° (Record: 61.3°, 2015) Philadelphia: 61.8° (Record: 62.5°,1974) More warmth lies ahead. The warmth could peak during the weekend. Afterward, it could become cooler. However, no exceptionally cold weather appears likely in the East through at least the first 10-14 days of November. Since 1869, there have been just 7 prior years with a November 1-7 average temperature of 60.0° or above in New York City: 1938, 1961, 1974, 1975, 1994, 2003, and 2015. All of those cases saw a warmer to much warmer than normal November with a mean monthly temperature of 50.3° (lowest: 48.2°, 1974; highest: 52.8°, 2015). On a standardized basis, 6/7 (86%) cases were 0.5 sigma or more above the 30-year moving average (implied 49.4° average for the most recent 30-year period) and 4/7 (57%) were 1.0 sigma or more above the 30-year moving average (implied 51.0° average for the most recent 30-year moving average). There was no clear seasonal snowfall outcome following such a warm start to November. Four cases saw less than 20" of seasonal snowfall (1961-1962, 1974-1975, 1975-1976, and 1994-1995); three cases saw more than 30" of seasonal snowfall (1938-1939, 2003-2004, and 2015-2016). The lowest seasonal snowfall occurred in 1994-95 when 11.8" fell. The highest amount was 42.6" in 2003-2004. The ENSO Region 1+2 anomaly was -1.8°C and the Region 3.4 anomaly was -1.0°C for the week centered around October 26. For the past six weeks, the ENSO Region 1+2 anomaly has averaged -1.58°C and the ENSO Region 3.4 anomaly has averaged -0.85°C. La Niña conditions will likely persist into the winter. The SOI was +4.20 today. The preliminary Arctic Oscillation (AO) was +0.870 today. On November 1 the MJO was in Phase 7 at an amplitude of 1.835 (RMM). The October 31-adjusted amplitude was 1.666 (RMM).
-
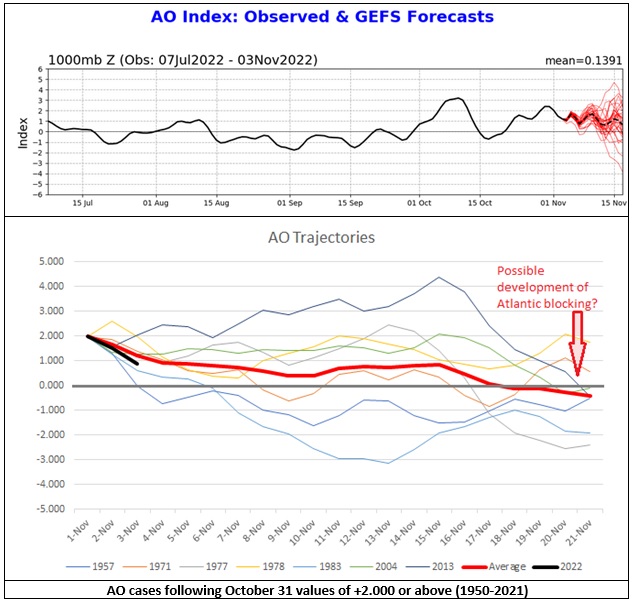
The latest guidance reaffirms that the region will see among its warmest to perhaps warmest opening week of November. After the warmth peaks on Sunday/Monday, there could be another bump up in temperatures later next week before readings head toward more seasonable levels. Meanwhile, frigid air will move into and cover much of western Canada and parts of the western United States starting this weekend. The question concerns whether that colder air will push into the East producing a meaningful period of below normal readings or whether only pieces of the cold will occasionally move into the East followed by a rebound in temperatures. Whether Atlantic blocking develops could be crucial. With lengthening wave lengths, AO-/NAO- patterns can produce sustained cold. At present, the AO is forecast to remain positive through mid-month. However, if one looks at statistical outcomes following past cases of a strong polar vortex to conclude October (AO +2.000 or above), there has been a tendency for blocking to develop in late November. If Atlantic blocking develops, a colder regime could begin to develop for the last week of the month. As perhaps a hint, the week 3-4 CFSv2 forecasts have turned cooler from those of yesterday--not cold, but cooler. The ECWMF weeklies that come out today could provide further insight. Given limitations of extended forecasting timeframes, any long-term blocking is considered only a possibility at present, as it has developed in past cases when late October polar vortexes weakened. Overall, even if colder weather develops, the month will wind up warmer than normal overall. Should the blocking fail to develop, overall monthly temperatures could challenge record warm values.
-
Morning thoughts… Today will be partly to mostly sunny and warm. High temperatures will reach the middle and upper 60s in most of the region. Likely high temperatures around the region include: New York City (Central Park): 66° Newark: 69° Philadelphia: 70° Unseasonably warm weather will continue through the weekend. Normals: New York City: 30-Year: 58.2°; 15-Year: 58.3° Newark: 30-Year: 59.5°; 15-Year: 59.8° Philadelphia: 30-Year: 60.1°; 15-Year: 60.4°
-
Much of the region saw the temperature top out at or above 70° today. High temperatures included: Boston: 69° Bridgeport: 72° Hartford: 72° Islip: 71° New Haven: 73° New York City-JFK: 72° New York City-LGA: 71° New York City-NYC: 70° Newark: 73° Philadelphia: 71° Providence: 70° Poughkeepsie: 70° White Plains: 72° Down South, Miami reached 90° for the second time this month. 2022 is the first time Miami has seen more than one 90° temperature in November. The old record of 1 day was set in 1941 and tied in 2002 and 2019. More warmth lies ahead. The warmth could peak during the weekend. Afterward, it could become cooler. However, no exceptionally cold weather appears likely in the East through at least the first 10-14 days of November. The first week of November will likely see a mean temperature of 60.0° or above in New York City. Since 1869, there have been just 7 prior years with such warmth during the first week of November: 1938, 1961, 1974, 1975, 1994, 2003, and 2015. All of those cases saw a warmer to much warmer than normal November with a mean monthly temperature of 50.3° (lowest: 48.2°, 1974; highest: 52.8°, 2015). On a standardized basis, 6/7 (86%) cases were 0.5 sigma or more above the 30-year moving average (implied 49.4° average for the most recent 30-year period) and 4/7 (57%) were 1.0 sigma or more above the 30-year moving average (implied 51.0° average for the most recent 30-year moving average). There was no clear seasonal snowfall outcome following such a warm start to November. Four cases saw less than 20" of seasonal snowfall (1961-1962, 1974-1975, 1975-1976, and 1994-1995); three cases saw more than 30" of seasonal snowfall (1938-1939, 2003-2004, and 2015-2016). The lowest seasonal snowfall occurred in 1994-95 when 11.8" fell. The highest amount was 42.6" in 2003-2004. The ENSO Region 1+2 anomaly was -1.8°C and the Region 3.4 anomaly was -1.0°C for the week centered around October 26. For the past six weeks, the ENSO Region 1+2 anomaly has averaged -1.58°C and the ENSO Region 3.4 anomaly has averaged -0.85°C. La Niña conditions will likely persist into the winter. The SOI was +2.99 today. The preliminary Arctic Oscillation (AO) was +1.499 today. On October 31 the MJO was in Phase 7 at an amplitude of 1.666 (RMM). The October 30-adjusted amplitude was 1.516 (RMM).
-
Locations reaching or exceeding 70° through 2 pm include: Atlantic City: 70° Bridgeport: 72° Farmingdale: 70° Islip: 70° New Haven: 72° New York City-JFK: 71° New York City-LGA: 70° Newark: 71° Philadelphia: 70° Providence: 70° White Plains: 70° Separately, Miami reached 90° for the second time this month. That surpasses the November record of 1 day, which was set in 1941 and tied in 2002 and 2019.
-
Temperatures likely won't reach the highest levels attained in 1993, but the first week to 10 days of the month will be among the warmest such periods on record in November.
-
Temperatures at noon were running well above average. Many parts of the region remain on track to reach or exceed 70°. Temperatures included: Albany: 62° Allentown: 64° Boston: 66° Bridgeport: 68° Islip: 66° New Haven: 69° New York City-JFK: 68° New York City-LGA: 66° New York City-NYC: 64° Newark: 68° Philadelphia: 67° Poughkeepsie: 64°
-
Morning thoughts… Today will be partly to mostly sunny and warm. High temperatures will reach the upper 60s and lower 70s in most of the region. Likely high temperatures around the region include: New York City (Central Park): 68° Newark: 70° Philadelphia: 70° Unseasonably warm weather will continue through the week. Normals: New York City: 30-Year: 58.6°; 15-Year: 58.7° Newark: 30-Year: 59.8°; 15-Year: 60.2° Philadelphia: 30-Year: 60.5°; 15-Year: 60.8°
-
What will be among the warmest first weeks of November on record in many parts of the Northeast began with high temperatures topping out in the 60s in New England and 70s in parts of the Middle Atlantic region. Highs ranged from 61° in Caribou to 74° in Philadelphia. Tomorrow will be another unseasonably warm day. Readings will again reach the upper 60s to lower 70s across the region. The warmth could peak during the weekend. Afterward, it could become cooler, but no exceptionally cold weather appears likely in the East through at least the first 10-14 days of November. In contrast, a frigid air mass will likely overspread British Columbia and spill into Alberta this weekend and early next week. Vancouver could experience an early-season snowfall early next week. But with the Arctic Oscillation likely to remain positive though the first half of November, the East will see only glancing blows from colder air masses. The potential exists for the first week to see a mean temperature of 60.0° or above in New York City. Since 1869, there have been just 7 prior years with such warmth during the first week of November: 1938, 1961, 1974, 1975, 1994, 2003, and 2015. All of those cases saw a warmer to much warmer than normal November with a mean monthly temperature of 50.3° (lowest: 48.2°, 1974; highest: 52.8°, 2015). On a standardized basis, 6/7 (86%) cases were 0.5 sigma or more above the 30-year moving average (implied 49.4° average for the most recent 30-year period) and 4/7 (57%) were 1.0 sigma or more above the 30-year moving average (implied 51.0° average for the most recent 30-year moving average). There was no clear seasonal snowfall outcome following such a warm start to November. Four cases saw less than 20" of seasonal snowfall (1961-1962, 1974-1975, 1975-1976, and 1994-1995); three cases saw more than 30" of seasonal snowfall (1938-1939, 2003-2004, and 2015-2016). The lowest seasonal snowfall occurred in 1994-95 when 11.8" fell. The highest amount was 42.6" in 2003-2004. The ENSO Region 1+2 anomaly was -1.8°C and the Region 3.4 anomaly was -1.0°C for the week centered around October 26. For the past six weeks, the ENSO Region 1+2 anomaly has averaged -1.58°C and the ENSO Region 3.4 anomaly has averaged -0.85°C. La Niña conditions will likely persist into the winter. The SOI was +19.91 today. The preliminary Arctic Oscillation (AO) was +1.994 today. On October 30 the MJO was in Phase 7 at an amplitude of 1.516 (RMM). The October 29-adjusted amplitude was 1.436 (RMM).
-
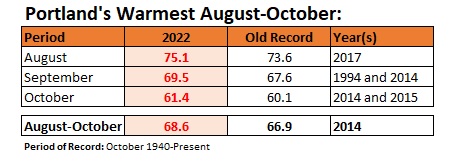
With its warmest October now in the books, Portland has set warm monthly records for 3 consecutive months. That is now in the past. Exceptionally cold air looks to move into western Canada this weekend. Some of the guidance shows measurable snow in Vancouver for Monday and Tuesday.
-
Morning thoughts… Today will be mostly cloudy and warm. A shower is possible during the morning. Clouds could break during the afternoon. High temperatures will reach the middle and upper 60s in most of the region. Likely high temperatures around the region include: New York City (Central Park): 66° Newark: 68° Philadelphia: 70° Unseasonably warm weather will continue through the week. Normals: New York City: 30-Year: 58.9°; 15-Year: 59.0° Newark: 30-Year: 60.2°; 15-Year: 60.6° Philadelphia: 30-Year: 61.2°; 15-Year: 61.2°
-
October is now concluding. New York City's Central Park had a mean monthly temperature of 56.8°, which was 1.1° below normal. A warmer than normal November appears likely. Some showers are likely overnight. Tomorrow will be variably cloudy and warm. Some additional showers are possible. The first week of November will likely be much warmer than normal. Many parts of the region could see among their 10 warmest November 1-7 periods on record. The potential exists for the first week to see a mean temperature of 60.0° or above in New York City. Since 1869, there have been just 7 prior years with such warmth during the first week of November: 1938, 1961, 1974, 1975, 1994, 2003, and 2015. All of those cases saw a warmer to much warmer than normal November with a mean monthly temperature of 50.3° (lowest: 48.2°, 1974; highest: 52.8°, 2015). On a standardized basis, 6/7 (86%) cases were 0.5 sigma or more above the 30-year moving average (implied 49.4° average for the most recent 30-year period) and 4/7 (57%) were 1.0 sigma or more above the 30-year moving average (implied 51.0° average for the most recent 30-year moving average). There was no clear seasonal snowfall outcome following such a warm start to November. Four cases saw less than 20" of seasonal snowfall (1961-1962, 1974-1975, 1975-1976, and 1994-1995); three cases saw more than 30" of seasonal snowfall (1938-1939, 2003-2004, and 2015-2016). The lowest seasonal snowfall occurred in 1994-95 when 11.8" fell. The highest amount was 42.6" in 2003-2004. The ENSO Region 1+2 anomaly was -1.8°C and the Region 3.4 anomaly was -1.0°C for the week centered around October 26. For the past six weeks, the ENSO Region 1+2 anomaly has averaged -1.58°C and the ENSO Region 3.4 anomaly has averaged -0.85°C. La Niña conditions will likely persist into the winter. The SOI was +26.75 today. The old record of +23.04 was set in 2003. The preliminary Arctic Oscillation (AO) was +2.587 today. On October 29 the MJO was in Phase 6 at an amplitude of 1.404 (RMM). The October 28-adjusted amplitude was 1.312 (RMM).
-
DCA _ NYC _ BOS __ ORD _ ATL _ IAH __ DEN _ PHX _ SEA 2.9 3.0 3.1 4.7 2.6 2.9 2.5 0.1 -0.8

