

donsutherland1
-
Posts
24,192 -
Joined
Content Type
Profiles
Blogs
Forums
American Weather
Media Demo
Store
Gallery
Everything posted by donsutherland1
-
Morning thoughts… It will be partly to mostly sunny and very cool today. High temperatures will reach the upper 40s and perhaps lower 50s in most of the region. Likely high temperatures around the region include: New York City (Central Park): 46° Newark: 49° Philadelphia: 48° Colder than normal temperatures will last through the week. Normals: New York City: 30-Year: 54.5°; 15-Year: 54.6° Newark: 30-Year: 55.5°; 15-Year: 55.7° Philadelphia: 30-Year: 56.4°; 15-Year: 56.4°
-
Overnight, a much colder air mass began moving into the region. Now, a prolonged period of below normal temperatures lies ahead. Minimum temperatures will dip into the 30s for the first time this season tomorrow morning at LaGuardia Airport (will be the 5th latest first occurrence) and Central Park (will be the 2nd latest first occurrence). Highs will recover to no higher than the upper 40s and perhaps lower 50s through the week. In addition, a storm will likely bring a cold rain to the region Tuesday night into Wednesday. A few interior sections could briefly see some frozen precipitation. An accumulating snowfall is likely across parts of upstate New York and northern New England. Beyond mid-month, Atlantic blocking could develop. Early indications suggest that the blocking won't be strong (with the AO staying mainly above -1.000). Its duration remains uncertain. The ENSO Region 1+2 anomaly was -1.8°C and the Region 3.4 anomaly was -1.1°C for the week centered around November 2. For the past six weeks, the ENSO Region 1+2 anomaly has averaged -1.71°C and the ENSO Region 3.4 anomaly has averaged -0.90°C. La Niña conditions will likely persist into the winter. The SOI was -7.89 today. The preliminary Arctic Oscillation (AO) was +0.406 today. On November 11 the MJO was in Phase 1 at an amplitude of 0.721 (RMM). The November 10-adjusted amplitude was 0.857 (RMM). Based on sensitivity analysis applied to the latest guidance, there is an implied 70% probability that New York City will have a warmer than normal November (1991-2020 normal). November will likely finish with a mean temperature near 49.8° (1.8° above normal).
-
Morning thoughts… Early rain will give way to breaking clouds. It will become partly sunny and much cooler today. High temperatures will reach the lower 50s in most of the region. Likely high temperatures around the region include: New York City (Central Park): 53° Newark: 53° Philadelphia: 53° Colder than normal temperatures will last through the week. Normals: New York City: 30-Year: 54.9°; 15-Year: 54.9° Newark: 30-Year: 55.8°; 15-Year: 56.0° Philadelphia: 30-Year: 56.8°; 15-Year: 56.8°
-
Big changes are now evolving in the hemispheric weather pattern. A historic EPO block is forecast to develop. During November 15-16, the EPO is forecast to reach its lowest values on record. The extreme EPO block will set the stage for an extended period of colder than normal temperatures bringing an abrupt end to the exceptional warmth that has prevailed through the first 12 days of the month. The remnants of Hurricane Nicole tracked well to the north and west of the region today. Nicole's remnants swept unusually warm air northward producing near record and record warmth. Record high temperatures included: Albany: 71° (old record: 68°, 1909) Atlantic City: 72° (tied record set in 1964) Bangor: 68° (old record: 66°, 2012 and 2020) Binghamton: 66° (old record: 65°, 1964) Boston: 76° (tied record set in 1909) Bridgeport: 72° (old record: 67°, 2021) Burlington: 71° (old record: 70°, 2012) Houlton: 67° (old record: 63°, 2020) Islip: 72° (old record: 67°, 2014) Manchester: 74° (old record: 66°, 2012 and 2020) Nantucket: 69° (old record: 68°, 2014) New Haven: 75° (old record: 68°, 2021) New York City-JFK: 72° (old record: 66°, 2014 and 2021) New York City-LGA: 69° (tied record set in 2020 and tied in 2021) Newark: 74° (tied record set in 1938) Poughkeepsie: 72° (old record: 69°, 1964) Portland: 73° (old record: 66°, 1909) Westfield: 68° (old record: 65°, 2012 and 2014) Westhampton: 73° (old record: 66°, 2012) White Plains: 68° (old record: 65°, 2021) Wilmington, DE: 72° (teid record set in 1992) Following today's near record and record warmth in much of the area, numerous locations tied or extended their records for most 70° days in November. Records include: Albany: 4 days (tied record set in 1931 and tied in 2020) Atlantic City: 7 days (tied record set in 1953 and tied in 2020) Boston: 6 days (tied record set in 1927 and tied in 1990 and 2020) Bridgeport: 5 days (old record: 4 days, 1975) Caribou: 2 days (old record: 1 day, 2020) Hartford: 8 days (old record: 7 days, 1975 and 2020) Islip: 6 days (old record: 4 days, 1975) Manchester, NH: 7 days (tied record set in 2020) Nantucket: 3 days (old record: 2 days, 1971 and 1975) New Haven: 6 days (old record: 4 days, 1975) New York City-JFK: 6 days (old record: 5 days, 1975) Newark: 9 days (old record: 7 days, 1975 and 2020) Philadelphia: 10 days (old record: 9 days, 1975) Portland: 3 days (tied record set in 1953 and tied in 2020) Poughkeepsie: 7 days (old record: 6 days, 1975 and 2020) Providence: 7 days (old record: 6 days, 2020) Westfield, MA: 7 days (tied record set in 2020) Some daily rainfall records were set, as well. Locations included: Bangor: 1.15" (old record: 1.06", 1947) Caribou: 1.71" (old record: 1.20", 1946) November's "summer fling" is now coming to a decisive end. Much colder air will pour into the region tonight. Minimum temperatures will dip into the 30s for the first time this season tomorrow night or Monday morning at LaGuardia Airport (will be the 5th latest first occurrence) and Central Park (will tie 1946 as the 2nd latest first occurrence). Highs will recover to no higher than the upper 40s and perhaps lower 50s through next week. In addition, a storm could bring a cold rain to the region Tuesday night into Wednesday. Some interior sections could see some frozen precipitation. An accumulating snowfall is likely across parts of upstate New York and northern New England. Beyond mid-month, Atlantic blocking could try to develop. Early indications suggest that the blocking won't be strong. Its duration, should it develop, remains uncertain. The ENSO Region 1+2 anomaly was -1.8°C and the Region 3.4 anomaly was -1.1°C for the week centered around November 2. For the past six weeks, the ENSO Region 1+2 anomaly has averaged -1.71°C and the ENSO Region 3.4 anomaly has averaged -0.90°C. La Niña conditions will likely persist into the winter. The SOI was +4.51 today. The preliminary Arctic Oscillation (AO) was +1.409 today. On November 10 the MJO was in Phase 1 at an amplitude of 0.861 (RMM). The November 9-adjusted amplitude was 0.961 (RMM). Based on sensitivity analysis applied to the latest guidance, there is an implied 74% probability that New York City will have a warmer than normal November (1991-2020 normal). November will likely finish with a mean temperature near 50.0° (2.0° above normal).
-
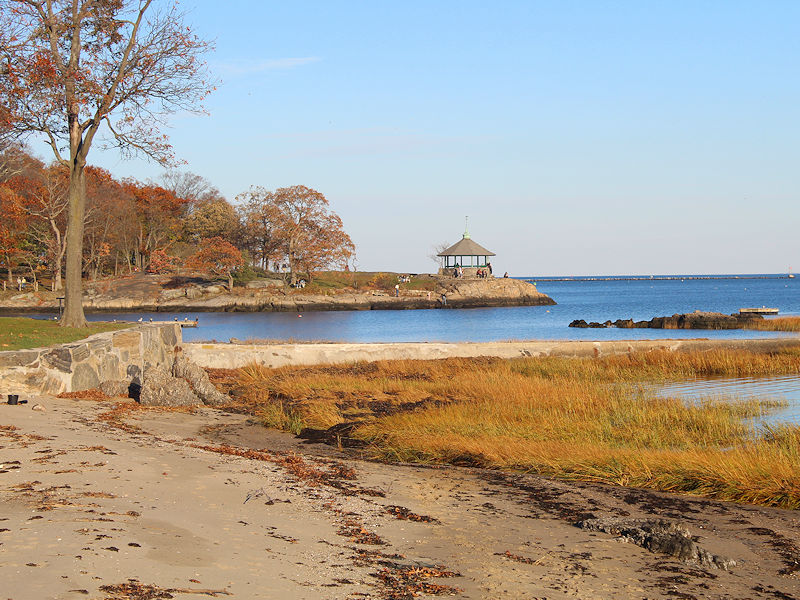
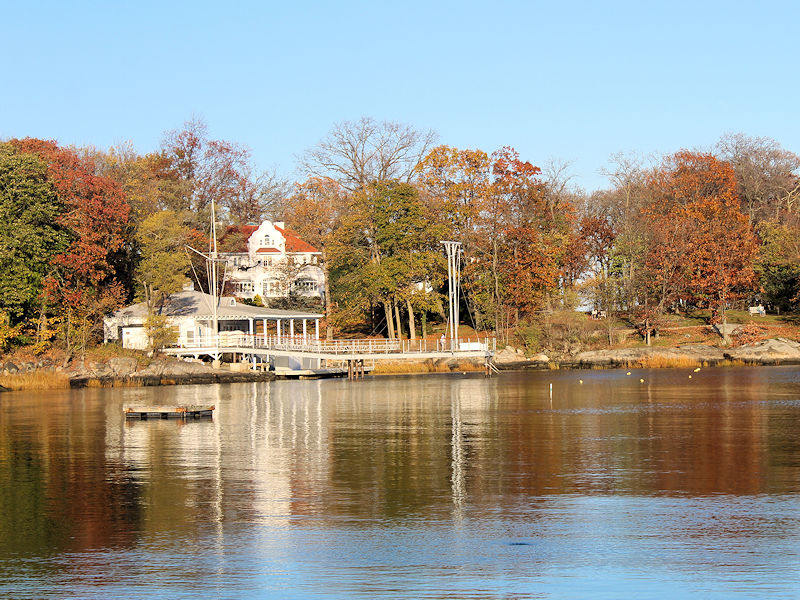
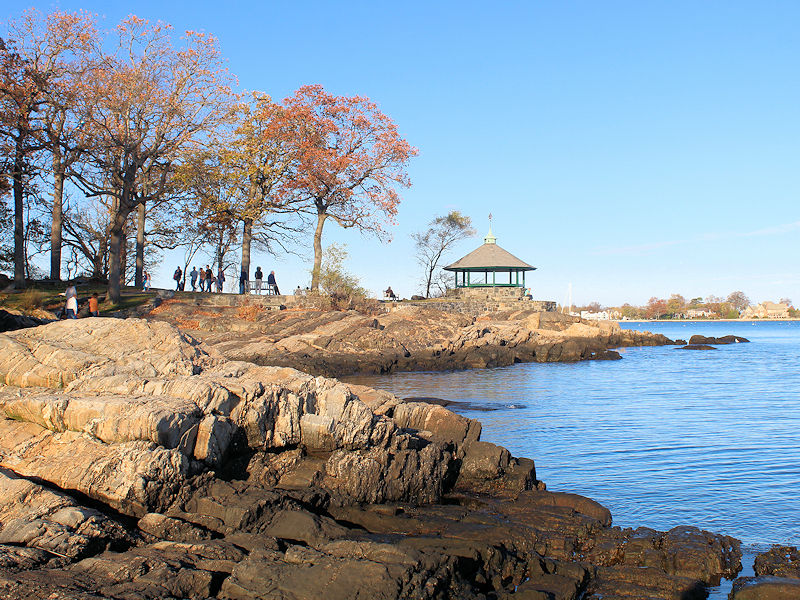
Some scenes from what could be November 2022's last exceptionally warm day.
-
JFK has now set a record for most 70-degree days in November.
-
I believe JFK is tied with its record. I will post them this evening.
-
Morning thoughts… The sun will return. It will be unseasonably warm. High temperatures will reach the upper 60s and lower 70s in most of the region. Likely high temperatures around the region include: New York City (Central Park): 69° Newark: 72° Philadelphia: 70° Much colder air will press into the region tonight setting up an extended period with below normal temperatures. Normals: New York City: 30-Year: 55.2°; 15-Year: 55.2° Newark: 30-Year: 56.2°; 15-Year: 56.4° Philadelphia: 30-Year: 57.2°; 15-Year: 57.1°
-
Overnight, a surge of warmth east of Nicole's remnants sent the mercury soaring into the upper 60s and lower 70s. Numerous records were tied or broken: Bridgeport: 69° (old record: 67°, 2021) Islip: 68° (old record: 67°, 2014) New Haven: 73° (old record: 68°, 2021) New York City-JFK: 67° (old record: 66°, 2014 and 2021) New York City-LGA: 69° (tied record set in 2020 and tied in 2021) Newark: 74° (tied record set in 1938) Westhampton: 68° (old record: 66°, 2012) White Plains: 68° (old record: 65°, 2021)
-
That was remarkable.
-
At midnight, Newark had a temperature of 71 degrees. Newark has now seen its 9th 70-degree or warmer day in November. The old record of 7 days was set in 1975 and tied in 2020. 2022 is the only year that had more 70-degree days in November (9 days) than in October (7 days). Records go back to 1931.
-
At 8 pm EST, #Newark reached 70 degrees. That’s the 8th 70-degree or above temperature this month. The old November record was 8 days. That record was set in 1975 and tied in 2020.
-
Rains associated with Nicole spread into the region today. Through 7 pm, rainfall totals include: Islip: 0.47" New York City: 0.81" Newark: 0.78" Philadelphia: 0.44" As expected based on the storm's track, more rain has fallen in eastern Ohio, western Pennsylvania, and western New York. Rainfall totals include: Buffalo: 1.36" (near the daily record of 1.40") Youngstown, OH: 2.18" (old record: 1.10", 1898) There will be additional periods of rain overnight as Nicole moves northward. A general 0.50"-1.50" rainfall with locally higher amounts is likely by tomorrow afternoon. Parts of the region could see strong thunderstorms, as well. In addition, as the system undergoes baroclinic deepening while heading toward upstate New York and northern New England, it could turn very windy late tonight into tomorrow. Parts of the region could see gusts of 50 mph. With the region's being in the storm's warm sector, the mercury could reach or exceed 70° tomorrow in parts of the area. Currently, Newark has 7 70° days this month. That ties the November record, which was set in 1975 and tied in 2020. JFK Airport has seen 5 70° days, which ties the November record set in 1975. Following the storm and cold frontal passage, much colder air will pour into the region tomorrow night. Minimum temperatures will dip into the 30s for the first time this season Sunday night or Monday morning at LaGuardia Airport (will be the 5th latest first occurrence) and Central Park (will tie 1946 as the 2nd latest first occurrence). Highs will recover to no higher than the upper 40s and perhaps lower 50s through the middle of next week. Beyond mid-month, Atlantic blocking could try to develop. Early indications suggest that the blocking won't be strong. Its duration, should it develop, remains uncertain. The ENSO Region 1+2 anomaly was -1.8°C and the Region 3.4 anomaly was -1.1°C for the week centered around November 2. For the past six weeks, the ENSO Region 1+2 anomaly has averaged -1.71°C and the ENSO Region 3.4 anomaly has averaged -0.90°C. La Niña conditions will likely persist into the winter. The SOI was +22.46 today. The preliminary Arctic Oscillation (AO) was +1.822 today. On November 9 the MJO was in Phase 1 at an amplitude of 0.961 (RMM). The November 8-adjusted amplitude was 1.239 (RMM). Based on sensitivity analysis applied to the latest guidance, there is an implied 76% probability that New York City will have a warmer than normal November (1991-2020 normal). November will likely finish with a mean temperature near 50.1° (2.1° above normal).
-
Morning thoughts… Rain associated with Nicole will arrive late this morning or early this afternoon. Periods of rain and thunderstorms are likely into tomorrow. The wind will also pick up, especially in coastal regions. High temperatures will reach the upper 60s and lower 70s in most of the region. Likely high temperatures around the region include: New York City (Central Park): 69° Newark: 71° Philadelphia: 71° Rain will end. It will be very warm and windy with gusts as high as 50 mph in parts of the region. Much colder air will press into the region tomorrow night setting up an extended period with below normal temperatures. Normals: New York City: 30-Year: 55.6°; 15-Year: 55.6° Newark: 30-Year: 56.6°; 15-Year: 56.8° Philadelphia: 30-Year: 57.6°; 15-Year: 57.5°
-
Temperatures surged into the 60s and even reached 70° in parts of the region today. It was even warmer in the Great Lakes region. Milwaukee hit 77°, which broke the daily record and tied the monthly record. Alpena, MI reached 78°, which set a new November record. Farther west, the temperature was in the teens in Bismarck with heavy snow. Rain will overspread the area tomorrow as Nicole moves northward. A general 0.50"-1.50" rainfall with locally higher amounts is likely from late Friday morning through Saturday afternoon. Parts of the region could see strong thunderstorms, as well. In addition, as the system undergoes baroclinic deepening while heading toward upstate New York and northern New England, it could turn very windy on Saturday. Parts of the region could see gusts of 50 mph. With the region's being in the storm's warm sector, the mercury could reach or exceed 70° tomorrow and Saturday in parts of the area. Currently, Newark has 7 70° days this month. That ties the November record, which was set in 1975 and tied in 2020. JFK Airport has seen 5 70° days, which ties the November record set in 1975. Following the storm and cold frontal passage, much colder air will pour into the region Saturday night. Minimum temperatures will dip into the 30s for the first time this season Sunday night or Monday morning at LaGuardia Airport and Central Park. Highs will recover to no higher than the upper 40s and perhaps lower 50s through the middle of next week. Beyond mid-month, Atlantic blocking could try to develop. Its magnitude and duration, should it develop, remain uncertain. The ENSO Region 1+2 anomaly was -1.8°C and the Region 3.4 anomaly was -1.1°C for the week centered around November 2. For the past six weeks, the ENSO Region 1+2 anomaly has averaged -1.71°C and the ENSO Region 3.4 anomaly has averaged -0.90°C. La Niña conditions will likely persist into the winter. The SOI was +17.62 today. The preliminary Arctic Oscillation (AO) was +1.439 today. On November 8 the MJO was in Phase 8 at an amplitude of 1.241 (RMM). The November 7-adjusted amplitude was 1.612 (RMM). Based on sensitivity analysis applied to the latest guidance, there is an implied 77% probability that New York City will have a warmer than normal November (1991-2020 normal). November will likely finish with a mean temperature near 50.3° (2.3° above normal).
-
Newark has reached 70 degrees today. That is the 7th such day this month, which ties the November record that was set in 1975 and tied in 2020.
-
FYI, the numbers are not standardized as per PSL.
-
I agree. It wouldn't be difficult to construct standardized values from the values provided on the PSL website. I have inquired as to whether the values shown on the site are ordinary values or whether they are already standardized just to be sure what the site is showing.
-
Unfortunately, the once freely-available GEFS forecasts are now only available on vendor sites.
-
I found them here: https://downloads.psl.noaa.gov/Public/map/teleconnections/epo.reanalysis.t10trunc.1948-present.txt
-
If the guidance verifies, this will be a historic EPO block. Both the EPS and GEFS show the EPO plunging to -5.000 or below for November 15-16. Below are the November and all-time records: November Record: -3.600, November 8, 1979 All-Time Record: -5.044, December 24, 1983 (only day on record with a -5.000 or below value)
-
The potential for some snow/sleet clearly is there. Overnight, there was even a hint that at least a trace of wintry precipitation could even extend close to the coast.
-
Morning thoughts… Today will be fair and warmer. High temperatures will reach the middle and upper 60s in most of the region. Likely high temperatures around the region include: New York City (Central Park): 64° Newark: 67° Philadelphia: 69° Rain from Nicole will arrive tomorrow. Thunderstorms are possible and it will be unseasonably warm. Normals: New York City: 30-Year: 55.9°; 15-Year: 55.9° Newark: 30-Year: 56.9°; 15-Year: 57.2° Philadelphia: 30-Year: 57.9°; 15-Year: 57.8°
-
It was 39 this morning.
-
Temperatures will rebound into the 60s tomorrow under partly sunny skies. However, the sunshine will yield to increasing clouds late in the day or at night. Rain will develop on Friday as the remnants of Nicole move northward. A general 1"-2" rainfall with locally higher amounts is likely from late Friday morning through Saturday afternoon. Parts of the region could see strong thunderstorms, as well. In addition, as the system undergoes baroclinic deepening while heading toward upstate New York and northern New England, it could turn very windy on Saturday. Parts of the region could see gusts of 50 mph. With the region's being in the storm's warm sector, the mercury could reach or exceed 70° Friday and Saturday in parts of the area. Currently, Newark has 6 70° days this month. The November record is 7 days, which was set in 1975 and tied in 2020. JFK Airport has seen 5 70° days, which tied the November record set in 1975. Following the storm and cold frontal passage, much colder air will pour into the region Saturday night. Minimum temperatures will dip into the 30s for the first time this season Sunday night or Monday morning at LaGuardia Airport and Central Park. Highs will recover to no higher than the upper 40s and perhaps lower 50s through the middle of next week. Beyond mid-month, Atlantic blocking could try to develop. Its magnitude and duration, should it develop, remain uncertain. The ENSO Region 1+2 anomaly was -1.8°C and the Region 3.4 anomaly was -1.1°C for the week centered around November 2. For the past six weeks, the ENSO Region 1+2 anomaly has averaged -1.71°C and the ENSO Region 3.4 anomaly has averaged -0.90°C. La Niña conditions will likely persist into the winter. The SOI was +4.45 today. The preliminary Arctic Oscillation (AO) was +1.285 today. On November 7 the MJO was in Phase 8 at an amplitude of 1.613 (RMM). The November 6-adjusted amplitude was 1.741 (RMM). Based on sensitivity analysis applied to the latest guidance, there is an implied 77% probability that New York City will have a warmer than normal November (1991-2020 normal). November will likely finish with a mean temperature near 50.4° (2.4° above normal).

