

donsutherland1
-
Posts
24,192 -
Joined
Content Type
Profiles
Blogs
Forums
American Weather
Media Demo
Store
Gallery
Everything posted by donsutherland1
-
Morning thoughts… It will be mostly sunny and cold. High temperatures will reach the upper 30s and lower 40s in most of the region. Likely high temperatures around the region include: New York City (Central Park): 41° Newark: 43° Philadelphia: 44° Colder than normal temperatures will continue until the middle of next week. Normals: New York City: 30-Year: 52.8°; 15-Year: 52.9° Newark: 30-Year: 53.6°; 15-Year: 53.9° Philadelphia: 30-Year: 54.6°; 15-Year: 54.7°
-
Historic Lake Effect Event?! 11/17-11/21
donsutherland1 replied to BuffaloWeather's topic in Upstate New York/Pennsylvania
It’s an incredible event. -
Historic Lake Effect Event?! 11/17-11/21
donsutherland1 replied to BuffaloWeather's topic in Upstate New York/Pennsylvania
Visibility at Greater Buffalo International Airport has dropped to 1/4 mile. -
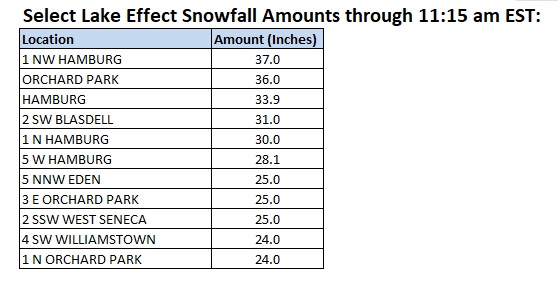
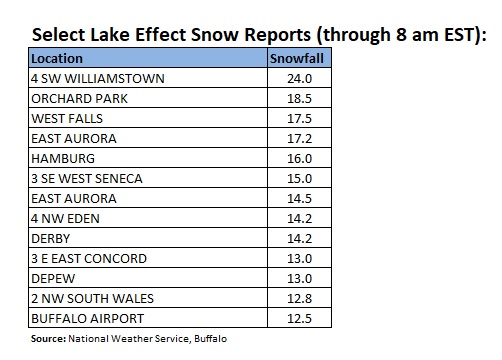
A major lake effect snowstorm is raging in western New York State. Through 4 pm, Buffalo has seen 13.9". However, just south of the city, excessive snow has fallen. Excessive snowfall has also fallen downwind of Lake Ontario. Snowfall amounts include: Blasdell 2 SW: 48.0" Elma 3 SW: 48.0" Fort Drum 1 SSE: 42.0" Hamburg 1 NE: 43.0" Orchard Park: 54.0" Back in the New York City-Philadelphia region, flurries and snow showers are possible tonight before midnight. Afterward, a cold weekend will follow with the season's coldest air pouring into the region by the end of the weekend. Generally colder than normal weather will continue through at least early next week before it turns briefly milder. The ENSO Region 1+2 anomaly was -1.4°C and the Region 3.4 anomaly was -1.0°C for the week centered around November 9. For the past six weeks, the ENSO Region 1+2 anomaly has averaged -1.67°C and the ENSO Region 3.4 anomaly has averaged -0.93°C. La Niña conditions will likely persist into the winter. The SOI was +11.90 today. The preliminary Arctic Oscillation (AO) was -0.313 today. On November 16 the MJO was in Phase 4 at an amplitude of 0.693 (RMM). The November 15-adjusted amplitude was 0.753 (RMM). Based on sensitivity analysis applied to the latest guidance, there is an implied 70% probability that New York City will have a warmer than normal November (1991-2020 normal). November will likely finish with a mean temperature near 49.4° (1.4° above normal).
-
Historic Lake Effect Event?! 11/17-11/21
donsutherland1 replied to BuffaloWeather's topic in Upstate New York/Pennsylvania
Hopefully, the bands will work northward this evening so that you get to see more snow. -
Historic Lake Effect Event?! 11/17-11/21
donsutherland1 replied to BuffaloWeather's topic in Upstate New York/Pennsylvania
Where are you? -
Historic Lake Effect Event?! 11/17-11/21
donsutherland1 replied to BuffaloWeather's topic in Upstate New York/Pennsylvania
-
Some reference points for the EPO while we wait for the November 16 value to be posted. Meters: Lowest: 504.41 meters below normal, December 24, 1983 Standardized*: Lowest: -3.923, May 1, 1989 *-Standardized on a monthly basis using the NCEI's longest reference period (1951-2010).
-
Historic Lake Effect Event?! 11/17-11/21
donsutherland1 replied to BuffaloWeather's topic in Upstate New York/Pennsylvania
Thank you. I truly appreciate it. -
Historic Lake Effect Event?! 11/17-11/21
donsutherland1 replied to BuffaloWeather's topic in Upstate New York/Pennsylvania
Richard, Would you mind if I use some images from your videos on my winter storms photos site. Credit would be noted. Let me know. -
Historic Lake Effect Event?! 11/17-11/21
donsutherland1 replied to BuffaloWeather's topic in Upstate New York/Pennsylvania
-
Morning thoughts… It will be partly cloudy and cold. Parts of the region could see snow flurries and show showers from late afternoon into the evening. High temperatures will reach the lower 40s in most of the region. Likely high temperatures around the region include: New York City (Central Park): 42° Newark: 45° Philadelphia: 44° Colder than normal temperatures will last through the week. A very cold weekend is likely. Normals: New York City: 30-Year: 53.2°; 15-Year: 53.2° Newark: 30-Year: 54.0°; 15-Year: 54.2° Philadelphia: 30-Year: 55.0°; 15-Year: 55.0°
-
Generally colder than normal weather will continue through at least early next week before it turns briefly milder. Tomorrow will be partly sunny and blustery. Some snow flurries or snow showers are possible during the afternoon and evening hours. Afterward, the season's coldest air so far could arrive during the weekend. Snow flurries or snow showers are again possible during the weekend. The ENSO Region 1+2 anomaly was -1.4°C and the Region 3.4 anomaly was -1.0°C for the week centered around November 9. For the past six weeks, the ENSO Region 1+2 anomaly has averaged -1.67°C and the ENSO Region 3.4 anomaly has averaged -0.93°C. La Niña conditions will likely persist into the winter. The SOI was +4.01 today. The preliminary Arctic Oscillation (AO) was +0.118 today. On November 15 the MJO was in Phase 4 at an amplitude of 0.755 (RMM). The November 14-adjusted amplitude was 0.752 (RMM). Based on sensitivity analysis applied to the latest guidance, there is an implied 66% probability that New York City will have a warmer than normal November (1991-2020 normal). November will likely finish with a mean temperature near 49.5° (1.5° above normal).
-
Never enough.
-
Morning thoughts… It will be sunny and cool. High temperatures will reach the lower and middle 40s in most of the region. Likely high temperatures around the region include: New York City (Central Park): 44° Newark: 47° Philadelphia: 46° Colder than normal temperatures will last through the week. A very cold weekend is likely. Normals: New York City: 30-Year: 53.5°; 15-Year: 53.6° Newark: 30-Year: 54.4°; 15-Year: 54.6° Philadelphia: 30-Year: 55.3°; 15-Year: 55.4°
-
Overnight parts of the Northeast saw some snow. Select seasonal snowfall amounts through November 16 4 pm include: Albany: 1.5" (0.5" above normal) Binghamton: 2.6" (0.8" below normal) Caribou: 7.6" (1.9" above normal) Buffalo: 0.3" (3.3" below normal) ***a significant lake effect snow event will occur through Saturday*** Burlington: 3.0" (0.8" above normal) Scranton: 1.2" (0.8" below normal) In the wake of the storm that brought some frozen precipitation to the distant New York City suburbs, the generally colder than normal weather will continue through at least early next week. The season's coldest air so far could arrive during the weekend. Snow flurries or snow showers are possible during the weekend. The ENSO Region 1+2 anomaly was -1.4°C and the Region 3.4 anomaly was -1.0°C for the week centered around November 9. For the past six weeks, the ENSO Region 1+2 anomaly has averaged -1.67°C and the ENSO Region 3.4 anomaly has averaged -0.93°C. La Niña conditions will likely persist into the winter. The SOI was +19.16 today. The preliminary Arctic Oscillation (AO) was +0.305 today. On November 14 the MJO was in Phase 4 at an amplitude of 0.754 (RMM). The November 13-adjusted amplitude was 0.511 (RMM). Based on sensitivity analysis applied to the latest guidance, there is an implied 73% probability that New York City will have a warmer than normal November (1991-2020 normal). November will likely finish with a mean temperature near 49.7° (1.7° above normal).
-
Yes, but some areas see a stronger push of warmth. At 10 am, it was 62 at Montauk and 52 at Groton. Not far west of there, readings were in the 40s.
-
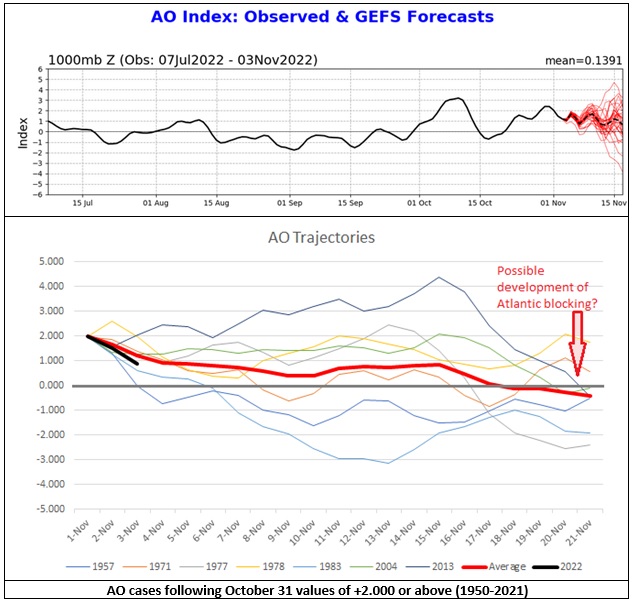
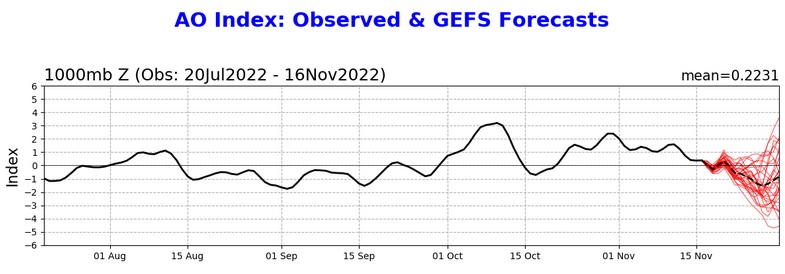
Update: 11/16/2022 AO: +0.305 Strong model consensus for a period of Atlantic blocking now exists.
-
Occasionally, there's a very strong surge of warmth to the east of the low pressure. That's really impressive.
-
Morning thoughts… Clouds will break during the late morning or afternoon and the remainder of the day will be partly sunny. It will be briefly milder. High temperatures will reach the upper 40s and lower 50s in most of the region. Likely high temperatures around the region include: New York City (Central Park): 51° Newark: 53° Philadelphia: 53° Colder than normal temperatures will last through the week. A very cold weekend is likely. Normals: New York City: 30-Year: 53.9°; 15-Year: 53.9° Newark: 30-Year: 54.7°; 15-Year: 54.9° Philadelphia: 30-Year: 55.7°; 15-Year: 55.7°
-
Over the past 20 minutes, light snow has transitioned to light rain at Poughkeepsie. Meanwhile, a cold rain was continuing to fall in Newark and New York City. A storm will bring a cold rain to the region tonight into tomorrow. A general 0.50"-1.00" rainfall with locally higher amounts is likely. A few interior sections could briefly see some frozen precipitation. An accumulating snowfall is likely across parts of upstate New York and northern New England. Albany could pick up 1"-3". Following the storm,temperatures will remain below normal. The season's coldest air so far could arrive during the weekend. Snow flurries or snow showers are possible during the weekend. Beyond that, the cold will continue into at least early next week. The ENSO Region 1+2 anomaly was -1.4°C and the Region 3.4 anomaly was -1.0°C for the week centered around November 9. For the past six weeks, the ENSO Region 1+2 anomaly has averaged -1.67°C and the ENSO Region 3.4 anomaly has averaged -0.93°C. La Niña conditions will likely persist into the winter. The SOI was +15.46 today. The preliminary Arctic Oscillation (AO) was +0.415 today. On November 13 the MJO was in Phase 3 at an amplitude of 0.510 (RMM). The November 12-adjusted amplitude was 0.557 (RMM). Based on sensitivity analysis applied to the latest guidance, there is an implied 74% probability that New York City will have a warmer than normal November (1991-2020 normal). November will likely finish with a mean temperature near 49.7° (1.7° above normal).
-
Morning thoughts… Sunshine will give way to increasing clouds. A cold rain will overspread the region late in the day or during the evening. Some interior sections could see a brief period of snow or sleet at the onset of the precipitation. High temperatures will reach the upper 40s in most of the region. Likely high temperatures around the region include: New York City (Central Park): 46° Newark: 48° Philadelphia: 48° Colder than normal temperatures will last through the week. A very cold weekend is likely. Normals: New York City: 30-Year: 54.2°; 15-Year: 54.2° Newark: 30-Year: 55.1°; 15-Year: 55.3° Philadelphia: 30-Year: 56.1°; 15-Year: 56.1°
-
A prolonged period of below normal temperatures has now set in. Highs will recover to no higher than the upper 40s and perhaps lower 50s through the week. A storm will likely bring a cold rain to the region tomorrow night into Wednesday. A few interior sections could briefly see some frozen precipitation. An accumulating snowfall is likely across parts of upstate New York and northern New England. Beyond mid-month, Atlantic blocking could develop. Early indications suggest that the blocking won't be strong (with the AO staying mainly above -1.000). Its duration remains uncertain. The ENSO Region 1+2 anomaly was -1.4°C and the Region 3.4 anomaly was -1.0°C for the week centered around November 9. For the past six weeks, the ENSO Region 1+2 anomaly has averaged -1.67°C and the ENSO Region 3.4 anomaly has averaged -0.93°C. La Niña conditions will likely persist into the winter. The SOI was +0.82 today. The preliminary Arctic Oscillation (AO) was +0.336 today. On November 12 the MJO was in Phase 2 at an amplitude of 0.559 (RMM). The November 11-adjusted amplitude was 0.713 (RMM). Based on sensitivity analysis applied to the latest guidance, there is an implied 67% probability that New York City will have a warmer than normal November (1991-2020 normal). November will likely finish with a mean temperature near 49.6° (1.6° above normal).
-
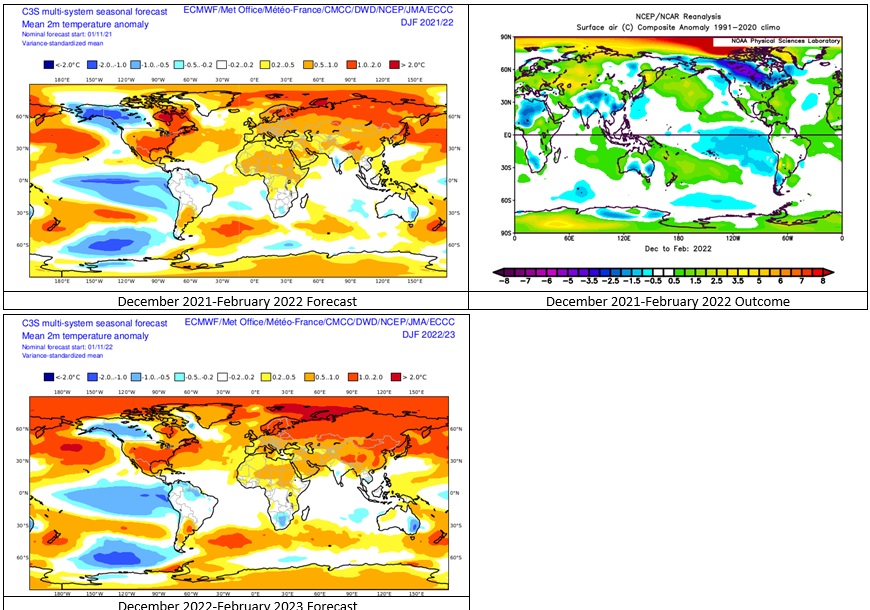
The Copernicus Program has issued the multi-ensemble winter forecast. It is very similar to last year's forecast (likely the result of La Niña). Last year's forecast and outcome are provided, along with this year's forecast.
-
We’ll probably have to wait for the weekend for NYC’s first freeze.


