donsutherland1
-
Posts
24,160 -
Joined
Content Type
Profiles
Blogs
Forums
American Weather
Media Demo
Store
Gallery
Everything posted by donsutherland1
-
Tomorrow will be another cool day with highs in the lower and middle 40s. A system could bring some rain or perhaps wet snow to parts of the region Sunday night into Monday. Some areas could see a light accumulation of snow. With the development of an EPO-/AO-/PNA- pattern following a short-lived rebound in the EPO to positive levels, colder air intrusions could again become more frequent toward mid-December. The potential for snowfall could also begin to increase, as well, as a sustained colder pattern begins to develop, but significant snowfall is not likely during the transition to that colder pattern. No severe cold is likely through at least the first three weeks of December. The latest EPS weeklies suggest that near normal to below normal temperatures could prevail during the December 19-26 period. The latest guidance suggests that the AO could fall to -3.000 or below during the second week of December. Since 1950, there were 24 cases that saw the AO reach -3.000 or below during December. Mean snowfall for those cases was 6.2" (Median: 6.0"). 50% of such cases saw December wind up with 6.0" or more snow (25% saw 10.0" or more). In contrast, during all other December cases, mean December snowfall was 3.5" (Median: 2.5"). In those cases, 21% of years saw December snowfall of 6.0" or more while 8% saw 10.0" or more snowfall. The ENSO Region 1+2 anomaly was -0.5°C and the Region 3.4 anomaly was -1.0°C for the week centered around November 30. For the past six weeks, the ENSO Region 1+2 anomaly has averaged -1.42°C and the ENSO Region 3.4 anomaly has averaged -0.95°C. La Niña conditions will likely persist through mid-winter. The SOI was +18.37 today. The preliminary Arctic Oscillation (AO) was -3.6473 today. On December 7 the MJO was in Phase 3 at an amplitude of 1.147 (RMM). The December 6-adjusted amplitude was 0.994 (RMM). Based on sensitivity analysis applied to the latest guidance, there is an implied 50% probability that New York City will have a colder than normal December (1991-2020 normal). December will likely finish with a mean temperature near 39.1° (normal).
-
Cooler air is now overspreading the region. Tomorrow through the weekend will likely see highs in the lower and middle 40s. A system could bring some rain or perhaps wet snow to parts of the region Sunday night into Monday. Some areas could see a light accumulation of snow. With the development of an EPO-/AO-/PNA- pattern following a short-lived rebound in the EPO to positive levels, colder air intrusions could again become more frequent toward mid-December. The potential for snowfall could also begin to increase, as well, as a sustained colder pattern begins to develop, but significant snowfall is not likely during the transition to that colder pattern. No severe cold is likely through at least the first three weeks of December. The latest EPS weeklies suggest that near normal to below normal temperatures could prevail during the December 19-26 period. The latest guidance suggests that the AO could fall to -3.000 or below during the second week of December. Since 1950, there were 24 cases that saw the AO reach -3.000 or below during December. Mean snowfall for those cases was 6.2" (Median: 6.0"). 50% of such cases saw December wind up with 6.0" or more snow (25% saw 10.0" or more). In contrast, during all other December cases, mean December snowfall was 3.5" (Median: 2.5"). In those cases, 21% of years saw December snowfall of 6.0" or more while 8% saw 10.0" or more snowfall. The ENSO Region 1+2 anomaly was -0.5°C and the Region 3.4 anomaly was -1.0°C for the week centered around November 30. For the past six weeks, the ENSO Region 1+2 anomaly has averaged -1.42°C and the ENSO Region 3.4 anomaly has averaged -0.95°C. La Niña conditions will likely persist through mid-winter. The SOI was +5.92 today. The preliminary Arctic Oscillation (AO) was -3.372 today. On December 6 the MJO was in Phase 3 at an amplitude of 0.995 (RMM). The December 5-adjusted amplitude was 0.867 (RMM). Based on sensitivity analysis applied to the latest guidance, there is an implied 51% probability that New York City will have a warmer than normal December (1991-2020 normal). December will likely finish with a mean temperature near 39.2° (0.1° above normal).
-
Cooler air will move into the region during the day tomorrow. However, temperatures will again reach the balmy 50s ahead of the arrival of the cooler air. Afterward, the remainder of the week will see highs in the lower and middle 40s. A system could bring some rain or perhaps wet snow to parts of the region Sunday night into Monday. Some areas could see a light accumulation of snow. With the development of an EPO-/AO-/PNA- pattern following a short-lived rebound in the EPO to positive levels, colder air intrusions could again become more frequent toward mid-December. The potential for snowfall could also begin to increase, as well, as a sustained colder pattern begins to develop, but significant snowfall is not likely during the transition to that colder pattern. No severe cold is likely through at least the first three weeks of December. The latest EPS weeklies suggest that near normal to below normal temperatures could prevail during the December 19-26 period. The latest guidance suggests that the AO could fall to -3.000 or below during the second week of December. Since 1950, there were 24 cases that saw the AO reach -3.000 or below during December. Mean snowfall for those cases was 6.2" (Median: 6.0"). 50% of such cases saw December wind up with 6.0" or more snow (25% saw 10.0" or more). In contrast, during all other December cases, mean December snowfall was 3.5" (Median: 2.5"). In those cases, 21% of years saw December snowfall of 6.0" or more while 8% saw 10.0" or more snowfall. The ENSO Region 1+2 anomaly was -0.5°C and the Region 3.4 anomaly was -1.0°C for the week centered around November 30. For the past six weeks, the ENSO Region 1+2 anomaly has averaged -1.42°C and the ENSO Region 3.4 anomaly has averaged -0.95°C. La Niña conditions will likely persist through mid-winter. The SOI was +0.21 today. The preliminary Arctic Oscillation (AO) was -2.648 today. On December 5 the MJO was in Phase 3 at an amplitude of 0.867 (RMM). The December 4-adjusted amplitude was 0.887 (RMM). Based on sensitivity analysis applied to the latest guidance, there is an implied 52% probability that New York City will have a warmer than normal December (1991-2020 normal). December will likely finish with a mean temperature near 39.3° (0.2° above normal).
-
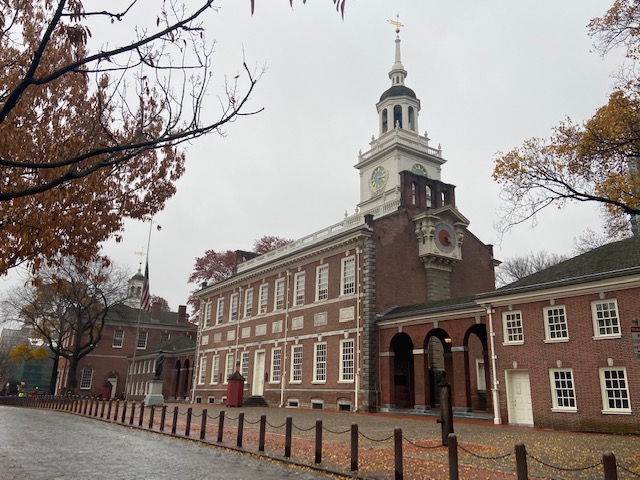
I tried to resolve the perennial question, “How much in Philly?” I think I need a smaller ruler.;)
-
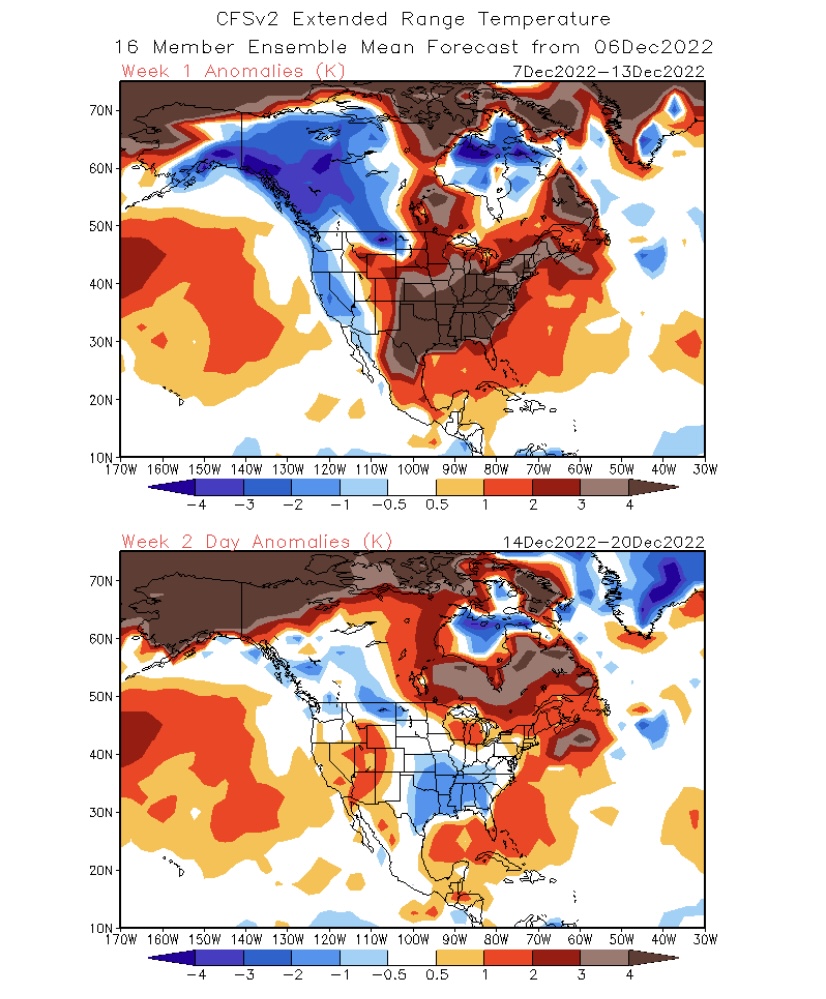
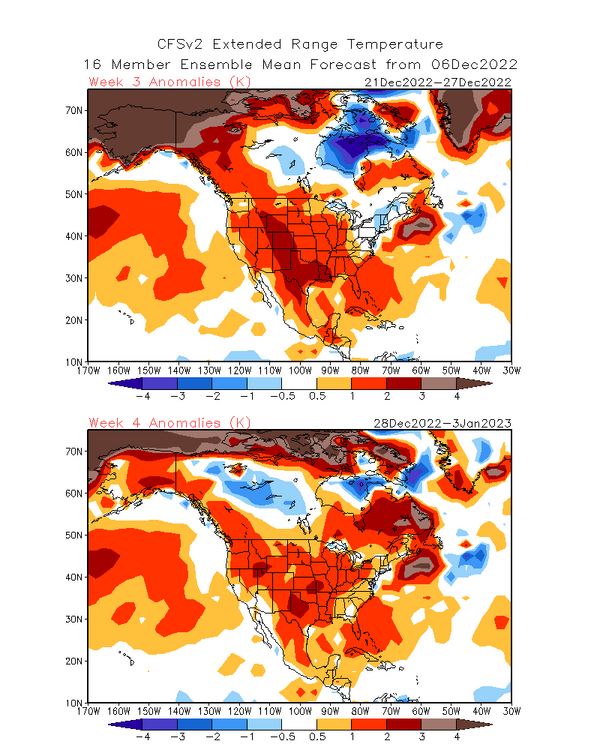
The CFSv2 weeklies seemingly turn the calendar back to winter 2001-02 and now show little prospect of cooling in a dramatic shift from yesterday’s run. Fortunately, beyond week 2, skill is low. Let’s see what the EPS weeklies show tomorrow.

-
Morning thoughts… Today will be mostly cloudy and very mild. High temperatures will reach the upper 50s in most of the region. Likely high temperatures around the region include: New York City (Central Park): 58° Newark: 59° Philadelphia: 59° The mild weather will continue into Thursday when cooler air begins to overspread the region. Normals: New York City: 30-Year: 46.7°; 15-Year: 47.2° Newark: 30-Year: 47.2°; 15-Year: 47.9° Philadelphia: 30-Year: 48.4°; 15-Year: 49.1°
-
Rain will end during the morning and it will be unseasonably warm tomorrow. Much of the region could see the temperature peak in the upper 50s and perhaps lower 60s. Cooler air will move into the region on Thursday. With the development of an EPO-/AO-/PNA- pattern following a short-lived rebound in the EPO to positive levels, colder air intrusions could again become more frequent toward mid-December. The potential for snowfall could also begin to increase, as well, as a sustained colder pattern begins to develop, but significant snowfall is not likely during the transition to that colder pattern. No severe cold is likely through at least the first three weeks of December. The latest EPS weeklies suggest that near normal to below normal temperatures could prevail during the December 19-26 period. The latest guidance suggests that the AO could fall to -3.000 or below during the second week of December. Since 1950, there were 24 cases that saw the AO reach -3.000 or below during December. Mean snowfall for those cases was 6.2" (Median: 6.0"). 50% of such cases saw December wind up with 6.0" or more snow (25% saw 10.0" or more). In contrast, during all other December cases, mean December snowfall was 3.5" (Median: 2.5"). In those cases, 21% of years saw December snowfall of 6.0" or more while 8% saw 10.0" or more snowfall. The ENSO Region 1+2 anomaly was -0.5°C and the Region 3.4 anomaly was -1.0°C for the week centered around November 30. For the past six weeks, the ENSO Region 1+2 anomaly has averaged -1.42°C and the ENSO Region 3.4 anomaly has averaged -0.95°C. La Niña conditions will likely persist through mid-winter. The SOI was +12.66 today. The preliminary Arctic Oscillation (AO) was -2.651 today. On December 4 the MJO was in Phase 3 at an amplitude of 0.888 (RMM). The December 3-adjusted amplitude was 0.746 (RMM).
-
I got the data from here: https://xmacis.rcc-acis.org
-
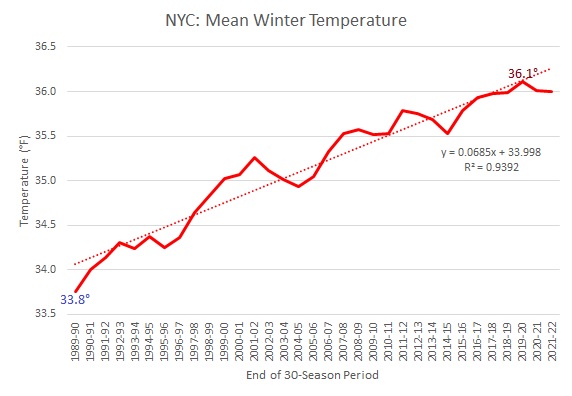
Some charts to illustrate the ongoing trends:
-
Morning thoughts… Today will be mostly cloudy and very mild. Some showers and periods of rain are likely. High temperatures will reach the middle and upper 50s in most of the region. Likely high temperatures around the region include: New York City (Central Park): 55° Newark: 57° Philadelphia: 57° The mild weather will continue into Thursday. Normals: New York City: 30-Year: 47.1°; 15-Year: 47.5° Newark: 30-Year: 47.6°; 15-Year: 48.2° Philadelphia: 30-Year: 48.7°; 15-Year: 49.4°
-
After a frosty start, the mercury rose into the upper 40s across much of the region. Meanwhile, Utqiagvik (formerly Barrow) saw the temperature soar to 40° today. That smashed the December monthly mark of 34°, which was set on December 9, 1932. It also eclipsed the November monthly record of 39° from November 11, 1937. Much milder conditions will return tomorrow before additional cold air returns. With the development of an EPO-/AO-/PNA- pattern following a short-lived rebound in the EPO to positive levels, colder air intrusions could again become more frequent toward mid-December. The potential for snowfall could also begin to increase, as well, as a sustained colder pattern begins to develop, but significant snowfall is not likely during the transition to that colder pattern. No severe cold is likely through at least the first three weeks of December. The latest EPS weeklies suggest that near normal to below normal temperatures could prevail during the December 19-26 period. The latest guidance suggests that the AO could fall to -3.000 or below during the second week of December. Since 1950, there were 24 cases that saw the AO reach -3.000 or below during December. Mean snowfall for those cases was 6.2" (Median: 6.0"). 50% of such cases saw December wind up with 6.0" or more snow (25% saw 10.0" or more). In contrast, during all other December cases, mean December snowfall was 3.5" (Median: 2.5"). In those cases, 21% of years saw December snowfall of 6.0" or more while 8% saw 10.0" or more snowfall. The ENSO Region 1+2 anomaly was -0.5°C and the Region 3.4 anomaly was -1.0°C for the week centered around November 30. For the past six weeks, the ENSO Region 1+2 anomaly has averaged -1.42°C and the ENSO Region 3.4 anomaly has averaged -0.95°C. La Niña conditions will likely persist through mid-winter. The SOI was +12.66 today. The preliminary Arctic Oscillation (AO) was -2.867 today. On December 3 the MJO was in Phase 3 at an amplitude of 0.686 (RMM). The December 2-adjusted amplitude was 0.281 (RMM).
-
Morning thoughts… Today will partly sunny with near seasonable temperatures. High temperatures will reach the middle and upper 40s in most of the region. Likely high temperatures around the region include: New York City (Central Park): 46° Newark: 49° Philadelphia: 49° Warmer air will return tomorrow. Normals: New York City: 30-Year: 47.4°; 15-Year: 47.8° Newark: 30-Year: 47.9°; 15-Year: 48.5° Philadelphia: 30-Year: 49.0°; 15-Year: 49.7°
-
Much milder conditions will return on Tuesday before additional cold air returns. With the development of an EPO-/AO-/PNA- pattern following a short-lived rebound in the EPO to positive levels, colder air intrusions could again become more frequent toward mid-December. The potential for snowfall could also begin to increase, as well, as a sustained colder pattern begins to develop, but significant snowfall is not likely during the transition to that colder pattern. No severe cold is likely through at least the first three weeks of December. The latest guidance suggests that the AO could fall to -3.000 or below during the second week of December. Since 1950, there were 24 cases that saw the AO reach -3.000 or below during December. Mean snowfall for those cases was 6.2" (Median: 6.0"). 50% of such cases saw December wind up with 6.0" or more snow (25% saw 10.0" or more). In contrast, during all other December cases, mean December snowfall was 3.5" (Median: 2.5"). In those cases, 21% of years saw December snowfall of 6.0" or more while 8% saw 10.0" or more snowfall. The ENSO Region 1+2 anomaly was -1.7°C and the Region 3.4 anomaly was -0.8°C for the week centered around November 23. For the past six weeks, the ENSO Region 1+2 anomaly has averaged -1.57°C and the ENSO Region 3.4 anomaly has averaged -0.92°C. La Niña conditions will likely persist through mid-winter. The SOI was +15.31 today. The preliminary Arctic Oscillation (AO) was -1.913 today. On December 2 the MJO was in Phase 2 at an amplitude of 0.290 (RMM). The December 1-adjusted amplitude was 0.470 (RMM).
-
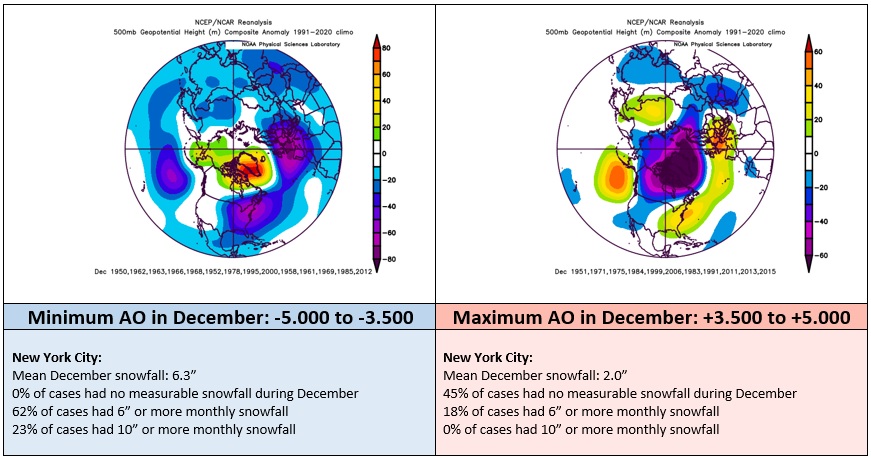
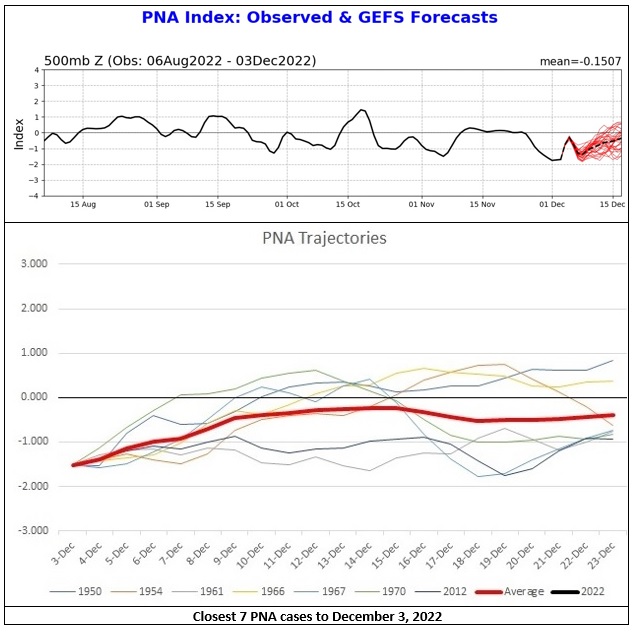
To date, Atlantic blocking has developed (AO: -1.913; NAO: -1.377). That blocking is forecast to strengthen and slowly retrograde. The PNA remains negative (-0.742) but is forecast to slowly rise toward neutral levels (probably getting there around December 20). The strong blocking typically leads to the development of elongated troughs beneath the block (showing up on the latter periods of the ensembles). Below are illustrations of December cases where the AO bottomed out between -5.000 and -3.500 or peaked between +3.500 and +5.000. Even more extreme cases where the AO fell below -5.000 or rose above +5.000 were excluded. Some NYC statistics are provided for each. Personally, I'd rather be in a situation where the AO is forecast to fall below -3.000 then the opposite scenario. There are no guarantees, but at least the odds of snow and cold much better in the former case than the latter. In cases where the AO falls to -4.000 or below in December for the minimum value, 40% of cases had 10" or more snow and 50% had 8" or more snow.
-
Morning thoughts… Today will sunny but much cooler. High temperatures will reach the middle and upper 40s in most of the region. Likely high temperatures around the region include: New York City (Central Park): 44° Newark: 47° Philadelphia: 47° Warmer air will return on Tuesday. A sustained cold pattern could develop around or just after mid-month. Normals: New York City: 30-Year: 47.7°; 15-Year: 48.1° Newark: 30-Year: 48.2°; 15-Year: 48.8° Philadelphia: 30-Year: 49.3°; 15-Year: 50.0°
-
In the wake of today's rainfall, colder air will again move into the region. However, much milder conditions could return toward the middle of next week before additional cold air returns. With the development of an EPO-/AO-/PNA- pattern following a short-lived rebound in the EPO to positive levels, colder air intrusions could again become more frequent toward mid-December. The potential for snowfall could also begin to increase, as well, as a sustained colder pattern begins to develop, but significant snowfall is not likely during the transition to that colder pattern. The latest guidance suggests that the AO could fall to -3.000 or below during the second week of December. Since 1950, there were 24 cases that saw the AO reach -3.000 or below during December. Mean snowfall for those cases was 6.2" (Median: 6.0"). 50% of such cases saw December wind up with 6.0" or more snow (25% saw 10.0" or more). In contrast, during all other December cases, mean December snowfall was 3.5" (Median: 2.5"). In those cases, 21% of years saw December snowfall of 6.0" or more while 8% saw 10.0" or more snowfall. The ENSO Region 1+2 anomaly was -1.7°C and the Region 3.4 anomaly was -0.8°C for the week centered around November 23. For the past six weeks, the ENSO Region 1+2 anomaly has averaged -1.57°C and the ENSO Region 3.4 anomaly has averaged -0.92°C. La Niña conditions will likely persist through mid-winter. The SOI was +18.32 today. The preliminary Arctic Oscillation (AO) was -1.685 today. On December 1 the MJO was in Phase 8 at an amplitude of 0.473 (RMM). The November 30-adjusted amplitude was 0.953 (RMM).
-
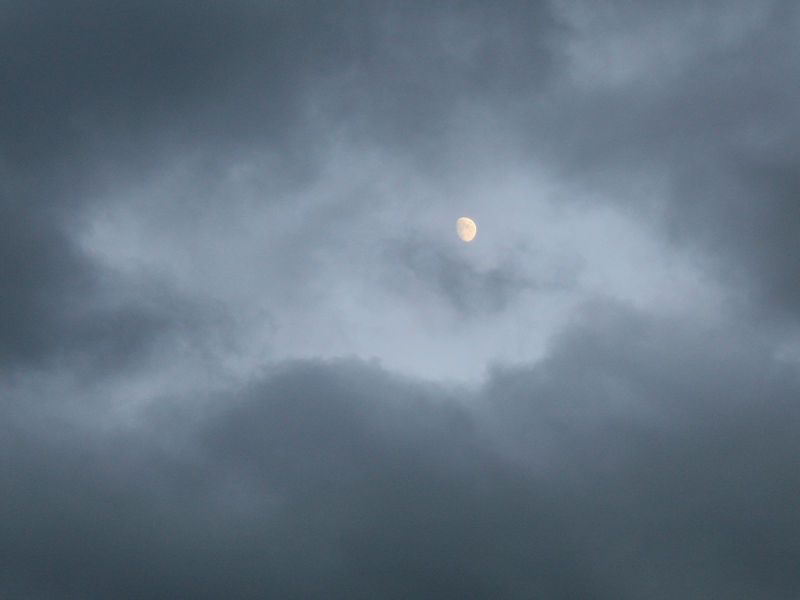
Some cloud shots near sunset.

-
Statistically, insight regarding strong AO+ values proved useful in heralding the arrival of AO blocking in late November. A sustained AO- regime commenced on November 23. https://www.americanwx.com/bb/topic/58336-november-2022/?do=findComment&comment=6681570 Statistical trends in the PNA following the most similar December 3 cases suggest that, just as is shown on the dynamical guidance, the ongoing PNA- regime will be slow to breakdown. By the end of the third week in December, values should be less negative than they currently are. However, the development of sustained positive values by that time seems unlikely (not zero, but still a less than one-in-three probability).
-
Tune in starting at 4:30 pm to find out.
-
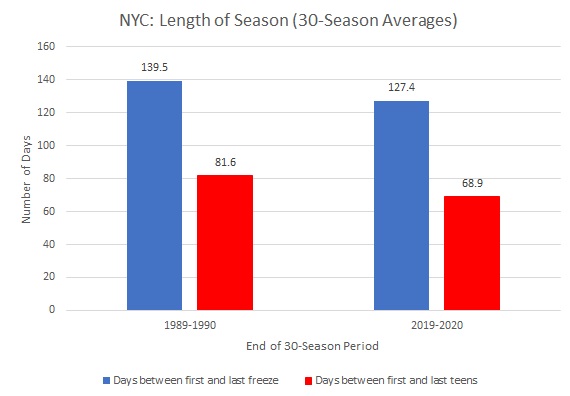
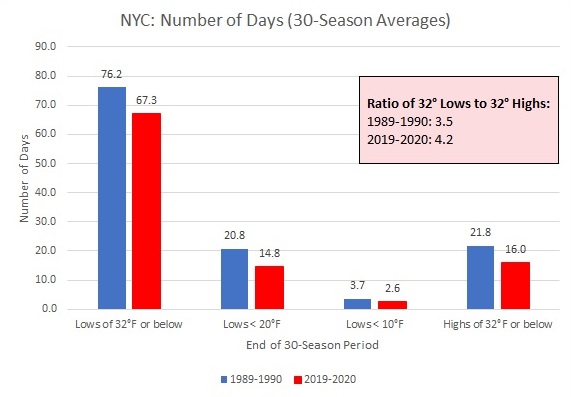
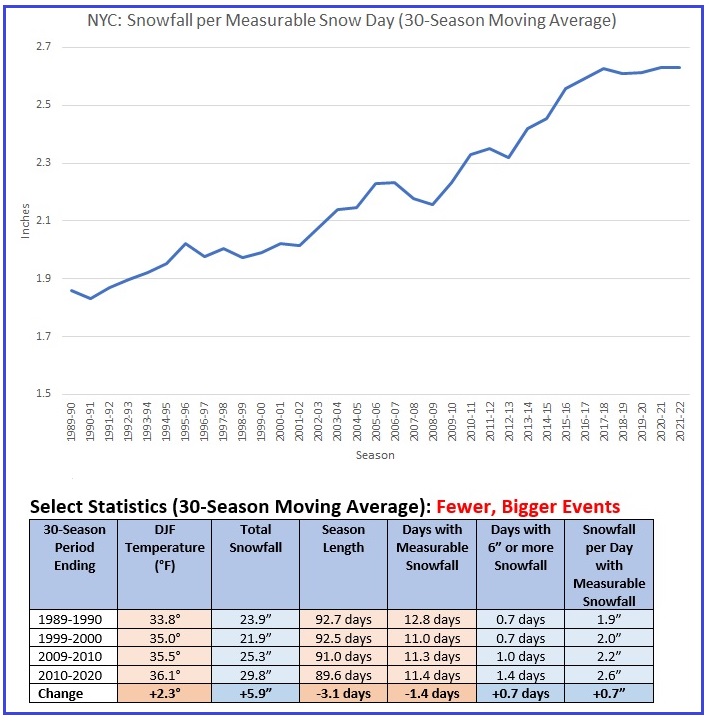
Some winter trends for New York City: Rising winter temperatures, rising seasonal snowfall, fewer but bigger events.
-
Morning thoughts… Today will be rainy and mild. High temperatures will reach the middle and upper 50s in most of the region. Some locations could reach 60°. Likely high temperatures around the region include: New York City (Central Park): 57° Newark: 59° Philadelphia: 59° Cooler air will return for tomorrow and Monday. A sustained cold pattern could develop around mid-month. Normals: New York City: 30-Year: 48.0°; 15-Year: 48.4° Newark: 30-Year: 48.6°; 15-Year: 49.1° Philadelphia: 30-Year: 49.6°; 15-Year: 50.3°
-
The PNA was +0.289 on 1/6 and +0.447 on 1/7.
-
-
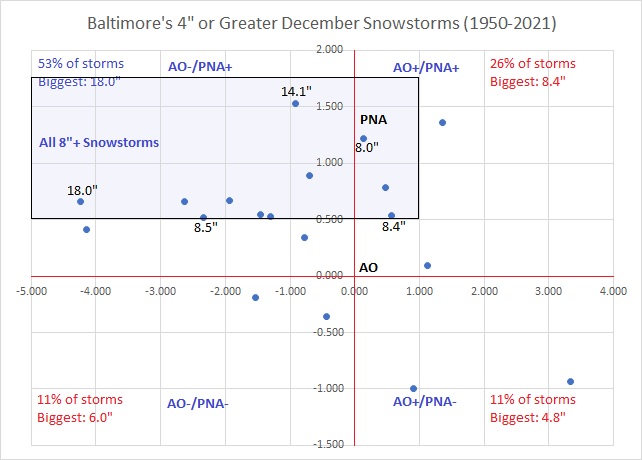
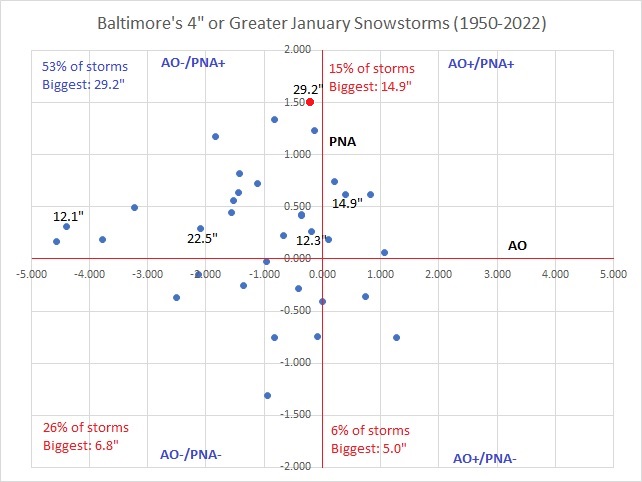
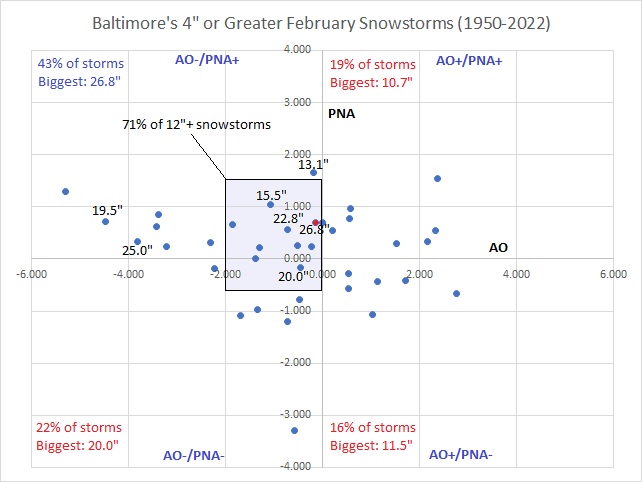
For ease of reference, I've included the AO/PNA charts for 4"+ snowstorms for Baltimore for December, January, and February here.
-
I will do so. Hopefully, sometime this evening or tomorrow.