

donsutherland1
-
Posts
24,192 -
Joined
Content Type
Profiles
Blogs
Forums
American Weather
Media Demo
Store
Gallery
Everything posted by donsutherland1
-
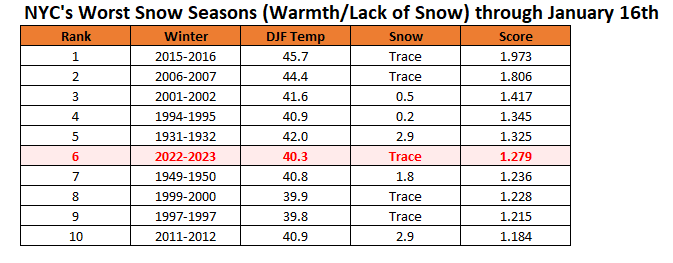
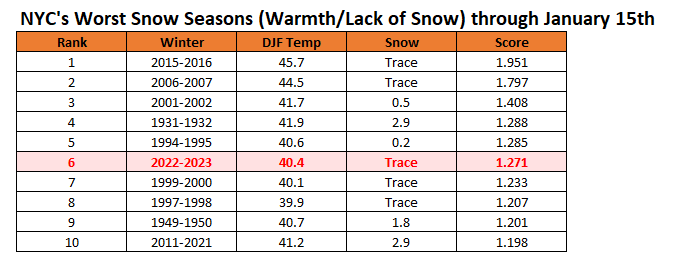
NYC's latest snow season futility ranking to date:
-
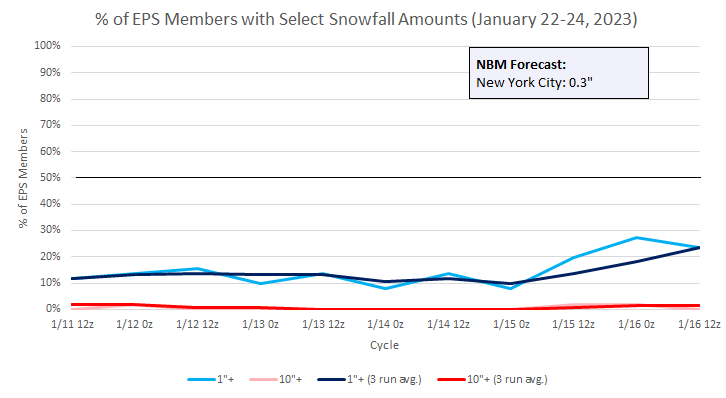
Most of the individual ensemble members were changeover or rain cases.
-
Morning thoughts… It will variably cloudy and mild. High temperatures will reach the middle and upper 40s in most areas. Likely high temperatures around the region include: New York City (Central Park): 45° Newark: 47° Philadelphia: 46° Temperatures will average above normal during the week. Normals: New York City: 30-Year: 39.1°; 15-Year: 39.8° Newark: 30-Year: 39.6°; 15-Year: 40.5° Philadelphia: 30-Year: 40.9°; 15-Year: 41.6°
-
EPS ensemble probability for select snowfall amounts for NYC:
-
An offshore storm brought a widespread 2"-4" snowfall to eastern New England. Some of the heavier snowfall worked its way into Boston where 3.5" of snow fell. That was Boston's biggest snowstorm since February 25, 2022 when the city was blanketed by 8.5". The last time Boston saw 3" or more snow while New York City, Philadelphia, Baltimore, and Washington, DC had none was February 9, 2021 when Boston picked up 3.0" of snow. The last such storm to occur in January took place on January 16, 2013 when Boston saw 3.2" of snow. The lengthening measurable snow drought will persist in New York City and Philadelphia for at least several more days. The next period of interest could be January 22-24. Ensemble support for measurable snow has recently increased to low-to-moderate levels. Milder weather will then return and persist through much of the week before cooler air returns near the end of the month. The duration of any cooler period is uncertain, as some of the extended guidance returns ridging to the East near the end of January or very early in February. If so, a warming trend could develop during early February. The ENSO Region 1+2 anomaly was -0.3°C and the Region 3.4 anomaly was -0.2°C for the week centered around January 11. For the past six weeks, the ENSO Region 1+2 anomaly has averaged -0.37°C and the ENSO Region 3.4 anomaly has averaged -0.82°C. La Niña conditions could fade to neutral conditions during late winter or early spring. The SOI was +3.82 today. The preliminary Arctic Oscillation (AO) was -0.785 today. On January 14 the MJO was in Phase 8 at an amplitude of 0.711 (RMM). The January 13-adjusted amplitude was 0.945 (RMM). Based on sensitivity analysis applied to the latest guidance, there is an implied near 100% probability that New York City will have a warmer than normal January (1991-2020 normal). January will likely finish with a mean temperature near 40.8° (7.1° above normal).
-
Today was another mostly sunny day. New York City's measurable snow drought increased to 313 consecutive days (4th longest).
-
There can be cases where things evolve just right to allow for significant snowfall. For NYC, since 1950, the following La Niña winters saw February snowfalls of 6.0" or above: 1974: 6.0" 1996: 7.5", 10.7" 2006: 26.9" 2008: 6.0"
-
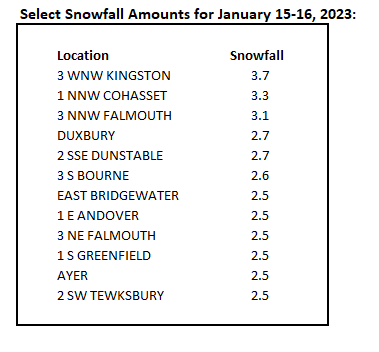
000 NOUS41 KBOX 161529 PNSBOX CTZ002>004-MAZ002>024-026-RIZ001>008-170329- Public Information Statement National Weather Service Boston/Norton MA 1029 AM EST Mon Jan 16 2023 ...SNOWFALL REPORTS... Location Amount Time/Date Provider ...Connecticut... ...Hartford County... Suffield Depot 6.0 WNW 0.5 in 0700 AM 01/16 COCORAHS 4 N Enfield 0.5 in 0512 AM 01/16 Trained Spotter North Granby 1.3 ENE 0.3 in 0700 AM 01/16 COCORAHS 1 SSW Vernon 0.2 in 0730 AM 01/16 COCORAHS Bradley AP 0.2 in 0700 AM 01/16 ASOS Enfield 1.5 SE 0.2 in 0700 AM 01/16 COCORAHS West Hartford 1.1 NNE 0.1 in 0700 AM 01/16 COCORAHS ...Tolland County... Staffordville 0.5 in 0500 AM 01/16 COOP 1 NE Somers 0.4 in 0700 AM 01/16 COCORAHS Central Somers 0.3 N 0.4 in 0600 AM 01/16 COCORAHS Somersville 0.2 ENE 0.2 in 0745 AM 01/16 COCORAHS ...Massachusetts... ...Barnstable County... East Falmouth 0.7 NW 3.7 in 0700 AM 01/16 COCORAHS Falmouth 3.1 NNW 3.1 in 0700 AM 01/16 COCORAHS Waquoit 0.6 SSW 2.0 in 0700 AM 01/16 COCORAHS Mashpee 4.6 S 1.5 in 0637 AM 01/16 COCORAHS East Sandwich 1.4 in 0830 AM 01/16 COOP 3 ESE Sandwich 1.4 in 0659 PM 01/15 NWS Employee 5 WNW Barnstable 1.2 in 0100 PM 01/15 NWS Employee South Dennis 1.0 NW 0.2 in 0700 AM 01/16 COCORAHS ...Bristol County... Acushnet 2.0 in 0600 AM 01/16 Amateur Radio 1 W Taunton AP 1.5 in 1020 PM 01/15 Amateur Radio 2 SSE New Bedford 1.4 in 0630 AM 01/16 Trained Spotter Fairhaven 2.2 ESE 0.8 in 0855 AM 01/16 COCORAHS Westport 6.6 SSE 0.5 in 0800 AM 01/16 COCORAHS Norton 0.8 S 0.5 in 0915 PM 01/15 COCORAHS Dighton 3.3 NNW 0.4 in 0800 AM 01/16 COCORAHS Dartmouth 2.5 SSW 0.4 in 0700 AM 01/16 COCORAHS NWS Boston/Norton 0.3 in 0700 AM 01/16 COOP Somerset 2.3 NNE 0.2 in 0700 AM 01/16 COCORAHS Norton 0.2 in 0711 PM 01/15 Official NWS Obs ...Dukes County... Vineyard Haven 0.8 WSW 0.5 in 0700 AM 01/16 COCORAHS West Tisbury 0.5 in 0633 AM 01/16 Amateur Radio ...Essex County... North Andover 0.3 NW 3.5 in 0800 AM 01/16 COCORAHS Newburyport 1.3 WNW 3.5 in 0700 AM 01/16 COCORAHS Topsfield 3.4 in 0908 AM 01/16 Public Newbury 3.3 in 0830 AM 01/16 COCORAHS 1 SE Haverhill 3.0 in 0755 AM 01/16 Trained Spotter Middleton 1.4 SSW 2.9 in 0800 AM 01/16 COCORAHS 2 NW Peabody 2.5 in 0855 AM 01/16 Amateur Radio Groveland 1.2 NE 2.5 in 0831 AM 01/16 COCORAHS Nahant 0.4 N 2.5 in 0730 AM 01/16 COCORAHS West Newbury 1.1 ESE 2.5 in 0700 AM 01/16 COCORAHS Andover 0.6 E 2.5 in 0500 AM 01/16 COCORAHS Beverly Coop 2.4 in 0830 AM 01/16 COOP Boxford 2.4 S 2.4 in 0700 AM 01/16 COCORAHS Rowley 2.3 in 0900 AM 01/16 Public 1 N Methuen 2.0 in 0753 AM 01/16 Trained Spotter Amesbury 2.6 WSW 2.0 in 0729 AM 01/16 COCORAHS 1 W Gloucester 2.0 in 0620 AM 01/16 Trained Spotter Rockport 1.0 E 1.0 in 0700 AM 01/16 COCORAHS ...Franklin County... Conway 0.9 SW 3.0 in 0800 AM 01/16 COCORAHS Greenfield 2.5 in 0600 AM 01/16 COOP Buckland 1.8 ESE 2.0 in 0800 AM 01/16 COCORAHS Bernardston 1.0 SW 2.0 in 0700 AM 01/16 COCORAHS Sunderland 1.8 in 0700 AM 01/16 COOP Colrain 3.7 WNW 0.6 in 0700 AM 01/16 COCORAHS Shutesbury 2.9 SW 0.5 in 0700 AM 01/16 COCORAHS New Salem 3.1 S 0.3 in 0900 AM 01/16 COCORAHS ...Hampden County... Westfield 2.8 SE 0.7 in 0600 AM 01/16 COCORAHS 2 SE West Springfield 0.5 in 0823 AM 01/16 Amateur Radio Hampden 2.0 NW 0.4 in 0800 AM 01/16 COCORAHS Agawam 1.1 SSW 0.2 in 0700 AM 01/16 COCORAHS ...Hampshire County... 1 ESE Plainfield 3.0 in 0810 AM 01/16 Trained Spotter Williamsburg 1.2 WSW 3.0 in 0630 AM 01/16 COCORAHS Westhampton 1.8 SW 2.5 in 0805 AM 01/16 COCORAHS Northampton 0.4 S 1.3 in 0850 AM 01/16 COCORAHS Easthampton 1.0 E 1.2 in 0810 AM 01/16 COCORAHS Amherst 0.9 in 0715 AM 01/16 COOP Florence 1.9 SW 0.5 in 0700 AM 01/16 COCORAHS ...Middlesex County... Littleton 2.8 NNW 3.0 in 0735 AM 01/16 COCORAHS 2 SSE Dunstable 2.7 in 1200 AM 01/16 Public Billerica 2.3 NNW 2.5 in 0830 AM 01/16 COCORAHS 2 SSW Reading 2.5 in 0805 AM 01/16 Trained Spotter 1 WNW Pepperell 2.5 in 0745 AM 01/16 Trained Spotter 2 SW Tewksbury 2.5 in 0730 AM 01/16 Trained Spotter Ayer 2.5 in 0610 AM 01/16 COCORAHS 2 SE Carlisle 2.2 in 0630 AM 01/16 COCORAHS Winchester 0.7 SE 2.1 in 0750 AM 01/16 COCORAHS 2 E Acton 2.1 in 0700 AM 01/16 Amateur Radio Westford 2.0 in 0800 AM 01/16 Amateur Radio Maynard 0.7 ESE 1.9 in 0700 AM 01/16 COCORAHS Acton 1.3 SW 1.8 in 0700 AM 01/16 COCORAHS Lexington 0.6 SW 1.5 in 0700 AM 01/16 COCORAHS Framingham 2.0 NNE 1.5 in 0700 AM 01/16 COCORAHS Sudbury 3.6 W 1.5 in 0700 AM 01/16 COCORAHS Reading 1.2 N 1.5 in 0600 AM 01/16 COCORAHS Natick 1.9 NNE 1.3 in 0800 AM 01/16 COCORAHS Melrose 0.5 NE 1.2 in 0700 AM 01/16 COCORAHS Hudson 0.5 SSE 1.2 in 0615 AM 01/16 COCORAHS Melrose 1.0 in 0815 AM 01/16 Trained Spotter Sherborn 1.1 NW 1.0 in 0705 AM 01/16 COCORAHS Medford 1.2 W 1.0 in 0700 AM 01/16 COCORAHS Hopkinton 0.9 in 0855 AM 01/16 Public Stow 0.8 in 0905 AM 01/16 Broadcast Media ...Norfolk County... 1 SSW Walpole 2.1 in 0930 AM 01/16 Public 2 SSW Norwood 1.2 in 0840 AM 01/16 Amateur Radio 1 ESE Randolph 1.2 in 0558 AM 01/16 Trained Spotter Blue Hill Coop 1.1 in 0700 AM 01/16 COOP Braintree 1.5 SE 0.8 in 0700 AM 01/16 COCORAHS Foxborough 3.1 E 0.2 in 0710 AM 01/16 COCORAHS Norwood 1.3 NW 0.2 in 0700 AM 01/16 COCORAHS ...Plymouth County... Kingston 3.3 WNW 3.7 in 0600 AM 01/16 COCORAHS 3 NNW Wareham 3.0 in 0830 AM 01/16 Public Whitman 2.6 in 0951 AM 01/16 Trained Spotter Hingham 0.8 ESE 2.6 in 0804 AM 01/16 COCORAHS Carver 2.3 E 2.5 in 0700 AM 01/16 COCORAHS East Bridgewater 2.5 in 0955 PM 01/15 Trained Spotter Marshfield 1.5 NNW 2.3 in 0700 AM 01/16 COCORAHS Wareham 5.6 NE 2.2 in 0700 AM 01/16 COCORAHS Bridgewater 1.0 in 0720 AM 01/16 COOP Rochester 1.0 in 0700 AM 01/16 COOP ...Suffolk County... Logan AP 3.4 in 0936 AM 01/16 ASOS Chelsea 0.8 N 3.0 in 0700 AM 01/16 COCORAHS Jamacia Plain 0.9 in 0800 AM 01/16 COOP ...Worcester County... Ashburnham 2.7 in 0700 AM 01/16 COOP 1 SE Hubbardston 2.3 in 0710 AM 01/16 Trained Spotter 1 NE Lunenburg 2.0 in 0935 AM 01/16 Amateur Radio Fitchburg 1.6 SSW 2.0 in 0715 AM 01/16 COCORAHS 1 ESE Fitchburg 2.0 in 0715 AM 01/16 Trained Spotter Ashburnham North 2.0 in 0700 AM 01/16 COOP Westminster 0.6 WSW 1.9 in 0700 AM 01/16 COCORAHS Sterling 1.8 in 0700 AM 01/16 Trained Spotter Northborough 2.3 N 1.5 in 0800 AM 01/16 COCORAHS Berlin 1.3 WSW 1.4 in 0736 AM 01/16 COCORAHS Barre 1.4 NNE 1.2 in 0700 AM 01/16 COCORAHS Warren 2.4 WSW 1.1 in 0715 AM 01/16 COCORAHS 1 ENE Oakham 1.0 in 0757 AM 01/16 Trained Spotter Milford 1.0 in 0700 AM 01/16 COOP Worcester 1.6 SE 0.7 in 0700 AM 01/16 COCORAHS Auburn 2.6 SW 0.5 in 0800 AM 01/16 COCORAHS Holden 0.9 SSE 0.5 in 0630 AM 01/16 COCORAHS Athol 2.8 NNE 0.3 in 0741 AM 01/16 COCORAHS Douglas 1.9 NNE 0.3 in 0700 AM 01/16 COCORAHS Worcester AP 0.3 in 1150 PM 01/15 ASOS Southbridge 0.1 in 0700 AM 01/16 COOP ...Rhode Island... ...Newport County... Little Compton 1.7 NW 0.3 in 0700 AM 01/16 COCORAHS Tiverton 4.4 SSE 0.1 in 0632 AM 01/16 COCORAHS ...Providence County... Greenville 0.7 NNW 0.1 in 0700 AM 01/16 COCORAHS &&
-
It has been an awful winter even up to eastern Maine.
-
I saw the struggle for snow in some of the areas. Hyannis stayed above freezing. Provincetown was mostly rain.
-
-
It will be challenging. There could be 1-2 opportunities for at least some measurable snowfall before January concludes. Ensemble support for January 22-24 has increased somewhat in recent cycles.
-
Winter futility ranking through January 15th.
-
Morning thoughts… It will become partly to mostly sunny and mild. High temperatures will reach the middle and upper 40s in most areas. Likely high temperatures around the region include: New York City (Central Park): 45° Newark: 48° Philadelphia: 48° Temperatures will average above normal during the week. Normals: New York City: 30-Year: 39.1°; 15-Year: 39.9° Newark: 30-Year: 39.6°; 15-Year: 40.6° Philadelphia: 30-Year: 40.9°; 15-Year: 41.7°
-
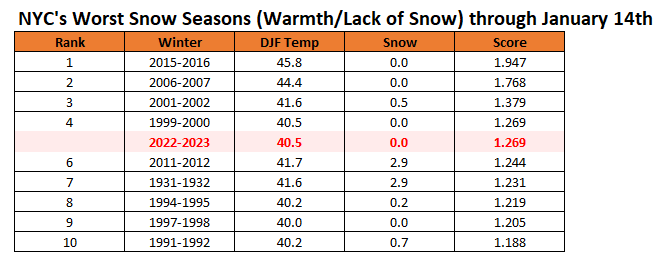
In terms of earlier winters, 1931-32 ranked 2nd behind 2001-02. 1918-19 ranked 6th. Those rankings are for the entire snow season.
-
Using today's data, 1949-50 will move up to 9th on the list (40.7° mean temperature/1.8" snow through January 15th). For the entire winter, it tied with 1974-75 at 12th with a mean temperature of 37.7° and seasonal snowfall of 14.0".
-
An offshore storm will graze eastern Long Island and eastern New England tonight and tomorrow. Parts of that region, including Boston, could see a period of snow. Boston could pick up around an inch of snow. Meanwhile, the lengthening measurable snow drought will persist in New York City and Philadelphia. Milder weather will then return and persist through much of the week before cooler air returns. The duration of any cooler period is uncertain, as some of the extended guidance returns ridging to the East near the end of January or very early in February. The ENSO Region 1+2 anomaly was -0.3°C and the Region 3.4 anomaly was -0.7°C for the week centered around December 28. For the past six weeks, the ENSO Region 1+2 anomaly has averaged -0.48°C and the ENSO Region 3.4 anomaly has averaged -0.87°C. La Niña conditions will likely persist through mid-winter before fading to neutral conditions. The SOI was +8.20 today. The preliminary Arctic Oscillation (AO) was -0.907 today. On January 13 the MJO was in Phase 8 at an amplitude of 0.946 (RMM). The January 12-adjusted amplitude was 0.875 (RMM). Based on sensitivity analysis applied to the latest guidance, there is an implied near 100% probability that New York City will have a warmer than normal January (1991-2020 normal). January will likely finish with a mean temperature near 40.8° (7.1° above normal).
-
An offshore storm spread clouds but not snow into snow drought-stricken southeastern New York State today.


-
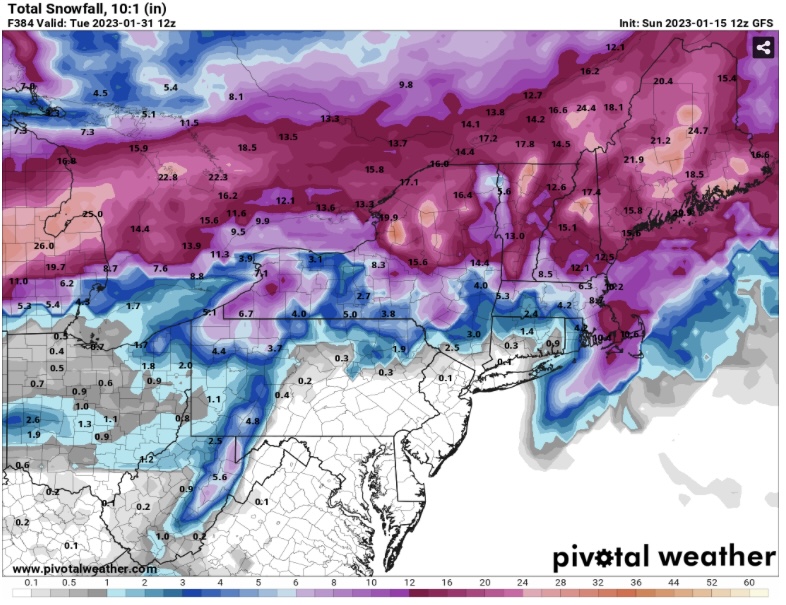
The measurable snow drought is likely to continue for some time in Baltimore, New York City, Philadelphia, and Washington, DC. The 12z GFS offers a grim nightmare of the drought’s continuation through its forecast horizon. However, skill scores drop significantly after 7 days.
-
1999 had the March snowstorm.
-
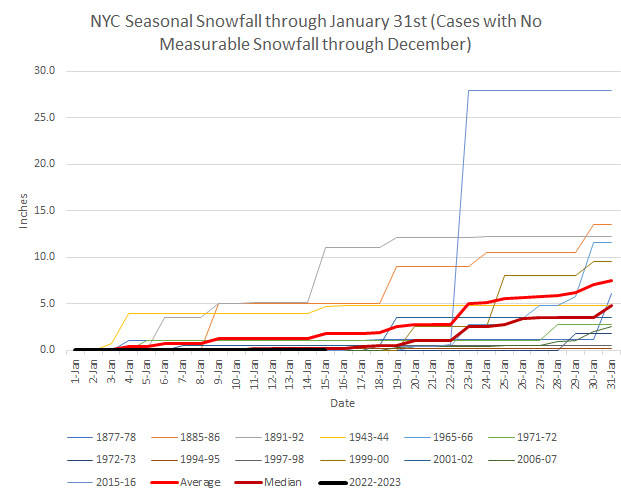
It would be great to have an outlier storm like that at some point. For winters that had no measurable snowfall through December 31st, here's how things progressed during January. 2015-16 stands almost alone, though three other winters wound up with 10" or more snow in January: 1885-86, 1891-92, and 1965-66. 1999-00 (9.5") just missed.
-
I also found this link: https://frontierweather.dtn.com/verification.html I've bookmarked it for future reference.
-
This is the only link I have with verification scores: https://www.emc.ncep.noaa.gov/users/verification/
-
Winter 2022-2023 to date vs. other bad winters (warmth and lack of snowfall):
-
Morning thoughts… It will become partly to mostly sunny and seasonably cold. High temperatures will reach the upper 30s and lower 40s in most areas. Likely high temperatures around the region include: New York City (Central Park): 40° Newark: 44° Philadelphia: 44° Temperatures will average above normal during the week. Normals: New York City: 30-Year: 39.2°; 15-Year: 39.9° Newark: 30-Year: 39.6°; 15-Year: 40.6° Philadelphia: 30-Year: 41.0°; 15-Year: 41.7°


