TheClimateChanger
-
Posts
3,486 -
Joined
-
Last visited
Content Type
Profiles
Blogs
Forums
American Weather
Media Demo
Store
Gallery
Everything posted by TheClimateChanger
-
Occasional Thoughts on Climate Change
TheClimateChanger replied to donsutherland1's topic in Climate Change
Looks like mostly nonsense again. Misleading data presented in a way to produce the desired trend. Why basket things into decades when some of the decades don't have full data? Just show the annual trend to avoid overweighting some years. Also the changing basket of station has a huge effect. It looks like the 1890s had a high number of 90+ days, but it's probably based only on these two sites. We can see from the data you presented 90+ days at those sites were actually quite low compared to the average at these stations. The data from Phoenixville in the 30s and 40s is also suspect, inexplicably doubling West Chester many years. Of course, they love to trot out that 111F. Don't even get me started on these state records. Same thing with West Virginia. 112F in Martinsburg, when it was 98F at Hagerstown just up the road on the same date. I will say the deniers have a point to call some of this data into question, but it's mostly in the opposite direction than they claim. Funny the two longest standing coop sites both have a significant positive trend, even in this raw data which is subject to known biases. Yet somehow Chesco's "nature trick" converts that into a declining trend when he switches up the basket of stations. -
Occasional Thoughts on Climate Change
TheClimateChanger replied to donsutherland1's topic in Climate Change
Also, here is Harrisburg. Just a short drive from Chester County. Weird that Chester would have such a wildly differing trend than Philadelphia or Harrisburg. -
Occasional Thoughts on Climate Change
TheClimateChanger replied to donsutherland1's topic in Climate Change
Oh yes and as @chubbspoints out, you are still changing the mix of stations over time. It is possible that the individual stations can all have a positive trend [like that for Phoenixville and West Chester] while the average tally for the basket of stations shows a decline due to you varying what stations are included in the basket over time. -
Occasional Thoughts on Climate Change
TheClimateChanger replied to donsutherland1's topic in Climate Change
Well you know I'm going to have to comment. (1) Data from 1920s - 1960s is likely not directly comparable to more recent data at some of the sites. May co-op stations reset their thermometers at 5 or 6 pm, and thus would register extra 90s on hot days [when the following day may or may not have reached 90]. Would expect this to add at least a couple or few extra 90-degree days on average each year. (2) The trend is minimal from the low elevation sites, and biased due to weighting 2020s equally even though only 4 years are included. It looks like the 2020s have had an unusually low number of 90+ days, but it's based on only 4 years of data. Same thing with the high elevation sites, but you also then extrapolate the trend back to the 1890s even though the data stops in the 1950s. In fact, the trends from 1950s to the present are about the same and we can be pretty confident that general pattern would have persisted into the 1890s. So the big drop off implied in the regression is clearly not accurate. If the remainder of the 2020s have a high number of 90+ readings, the trends could be significantly different. (3) These trends do not agree with Philadelphia data [from a county neighboring Chester County]. These data were collected by trained meteorologists from the Weather Bureau and later National Weather Service, and thus are less likely to contain errors and are unaffected by any changes in observation time. I can anticipate you will claim the UHI effect is the culprit, but there's no explanation for why center city Philadelphia would have fewer 90-degree days than Chester County, which would have been very rural, in the 19th century and early 20th century. -
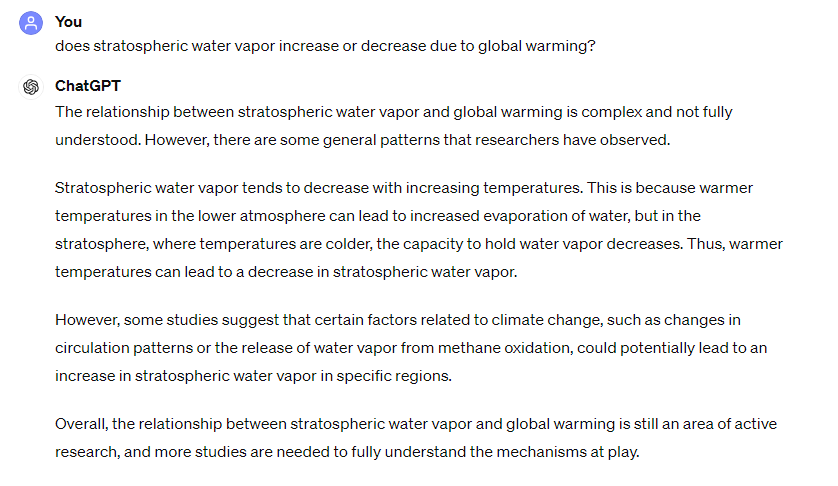
Clearly, GPT is confused as well because it comes to the same conclusion as me.
-
Interesting. I can't really make heads or tails of this stratospheric water vapor stuff. You would think if the stratosphere is cooling (as it is), then water vapor would decrease since colder air holds less moisture. Alternatively, if water vapor was increasing, you would think the stratosphere would warm since water vapor is a greenhouse gas. Yet observational data shows temperature is decreasing but water vapor is increasing. This seems to be a bit of a paradox.
-
Interesting. I have been very skeptical of claims that HTHH caused climate warming. Never heard of a volcanic eruption producing a significant warming effect prior to 2022.
-
I don't buy it. Hunga Tonga Hunga Ha'apai was a VEI of 6 [or at least high end 5]. Prior to 2022, all available science said strong volcanic eruptions cause cooling, not warming. I have read in the past where a series of eruptions or flood basalt eruptions can lead to climate warming over time, but not ephemeral warming. Instead, they lead to sustained warming over long [geological] timescales from increased atmospheric greenhouse gas concentrations. Unless someone can provide proof from the geological record of a volcanic eruption causing warming, I am going to assume HTHH led to climate cooling and it would have been even warmer over the past couple of years in the absence of the volcano.
-
May 2024 General Discussion
TheClimateChanger replied to HillsdaleMIWeather's topic in Lakes/Ohio Valley
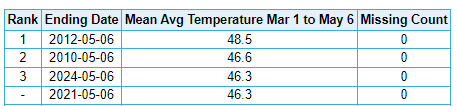
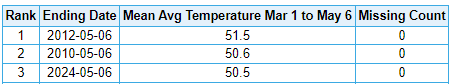
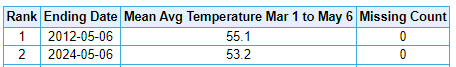
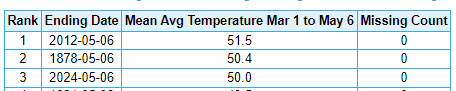
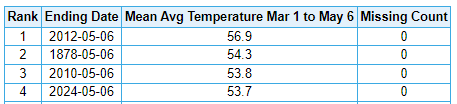
It has been a glorious spring for much of the subforum, on the heels of one of the mildest winters of record. Only a couple analogs - 2012 was a bit warmer region wide, 2010 was similar, 1878 looks like a close historical match. Detroit Chicago Milwaukee Cleveland Columbus Toledo Indianapolis Louisville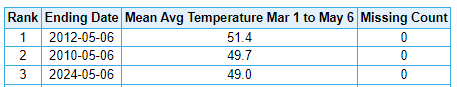
-
Occasional Thoughts on Climate Change
TheClimateChanger replied to donsutherland1's topic in Climate Change
And these are the same people who made a huge deal over "Mike's nature trick." Like Chesco, they all take SOOO many liberties with the data to try and limit the warming trend. Incredible hypocrisy. -
Occasional Thoughts on Climate Change
TheClimateChanger replied to donsutherland1's topic in Climate Change
Do you have any source for this, Chuck? One thing I always wondered about this contrail thing, is why there is no effort to change the fuel or engine design, etc., to limit them? Nobody asked us if we wanted our skies covered with this junk. -
Occasional Thoughts on Climate Change
TheClimateChanger replied to donsutherland1's topic in Climate Change
No, I don't believe the government. They have consistently downplayed this for decades. The data shows it has warmed much more than the government statistics claim. -
Occasional Thoughts on Climate Change
TheClimateChanger replied to donsutherland1's topic in Climate Change
Willful ignorance. If you change the mix of stations over time (i.e., remove warmer locations or add in cooler locations), you can get a scenario where every single station has a warming trend, but the aggregate is a cooling trend (or, as in this case, less of a warming trend than any of the individual sites). -
Pittsburgh/Western PA Spring 2024
TheClimateChanger replied to Ahoff's topic in Upstate New York/Pennsylvania
Not to be argumentative, but it’s been nearly 10F warmer than normal so far. Doesn’t look to change much by the 10th. If it’s +10F on the 10th, it would need to average nearly 5F below normal the rest of the month just to hit normal. So both of those forecasts could be correct. -
Pittsburgh/Western PA Spring 2024
TheClimateChanger replied to Ahoff's topic in Upstate New York/Pennsylvania
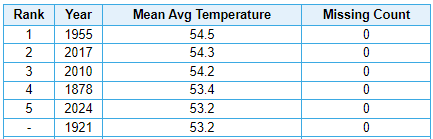
Third warmest (35.4F) behind 1921 (35.9F) and 1880 (35.5F). -
Pittsburgh/Western PA Spring 2024
TheClimateChanger replied to Ahoff's topic in Upstate New York/Pennsylvania
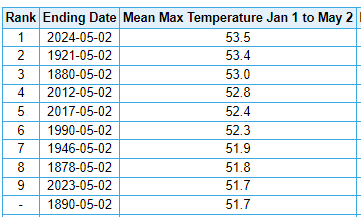
Currently, second warmest year to date in the threaded record for the Pittsburgh area. I remember looking at these numbers and the old city office records seemed insurmountable. Like 1998 was widely regarded as the hottest year ever and we weren't even close. Yet here we are, in the year of our Lord 2024, and right near the top of those. Very impressive IMO. Actually in first place for average high temperature year to date. Unlike a lot of locations, PIT actually does a little better on high temperatures relative to low temperatures since the latter were more impacted by the urban heat island effect at the downtown office site. I will say it's a bit harder to keep pace with the old years in the warm season, as the warm bias has a greater impact on the rankings during that period when seasonal variability is at its annual minimum. But it does look like the next week or so should be well above normal on the whole.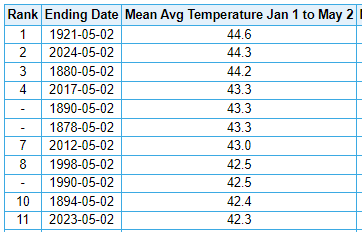
-
Central Pa. Spring 2024
TheClimateChanger replied to mahantango#1's topic in Upstate New York/Pennsylvania
Record highs set or tied today in Harrisburg, Williamsport, Altoona and DuBois. -
Pittsburgh/Western PA Spring 2024
TheClimateChanger replied to Ahoff's topic in Upstate New York/Pennsylvania
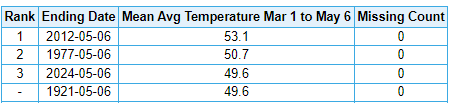
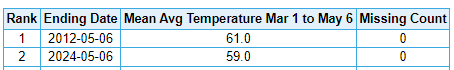
Current forecast would make the first week of May sixth warmest in the threaded record, and second only to 2012 at the airport. -
May 2024 General Discussion
TheClimateChanger replied to HillsdaleMIWeather's topic in Lakes/Ohio Valley
Best climate. Looking like another historically warm year across the region. Pretty much all long-term climate sites are in the top 5 for YTD through the first 1/3rd of 2024. If this outlook for May is correct, looks like some locations may climb even higher in the record books [especially in the eastern parts of the subforum]. Here is Dayton: Let's hope this continues through the summer and you get to ring up some high double-digit 90+ days!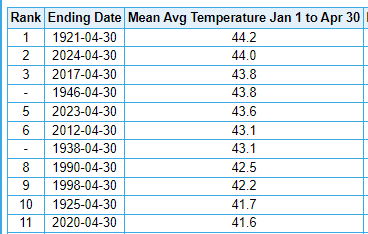
-
Detroit finished as 5th warmest on record.
-
-
Pittsburgh/Western PA Spring 2024
TheClimateChanger replied to Ahoff's topic in Upstate New York/Pennsylvania
Looking forward to May, odds favor above normal temperatures with equal odds of above, below or near normal precipitation, per the CPC. -
Pittsburgh/Western PA Spring 2024
TheClimateChanger replied to Ahoff's topic in Upstate New York/Pennsylvania
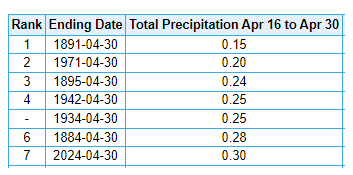
April finished off as 5th warmest and 2nd wettest on record [3rd wettest if you include the Allegheny Arsenal records back to 1836 - there was reportedly over 9 inches in 1852]. While the month finished off in a solid 5th place for temperature, it was quite close to the record high, finishing just 0.4F below 2017. Precipitation fell in an interesting pattern, with the first half of the month easily the wettest on record. The second half of the month was actually the 7th driest such period with just 0.30" of precipitation. For the first 1/3 of the year, the mean temperature is 3rd warmest in the threaded record. Easily warmest at the airport site, being nearly a full degree warmer than 2017. The average high temperature for the year to date is 2nd warmest in the threaded record.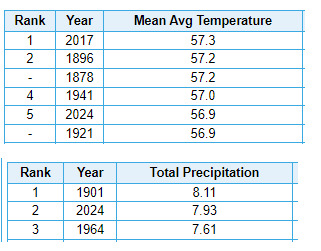
-
Central Pa. Spring 2024
TheClimateChanger replied to mahantango#1's topic in Upstate New York/Pennsylvania
Sorry, meant to post in the western Pennsylvania thread. -
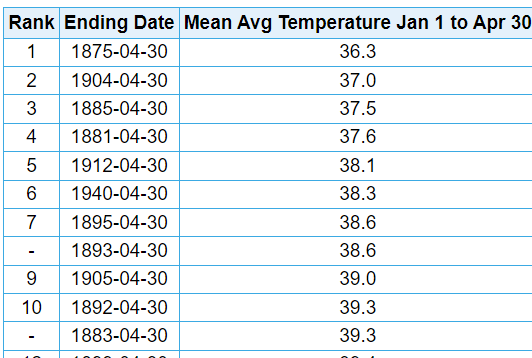
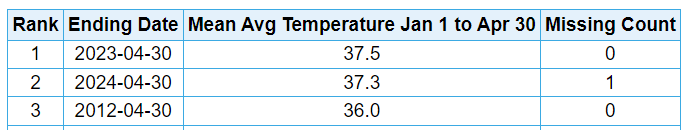
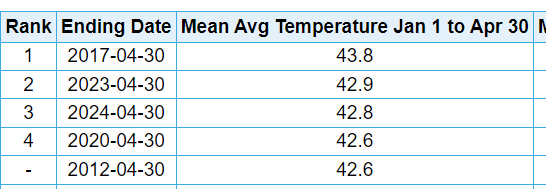
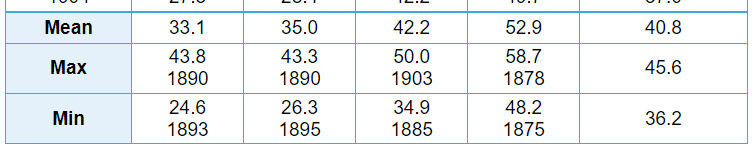
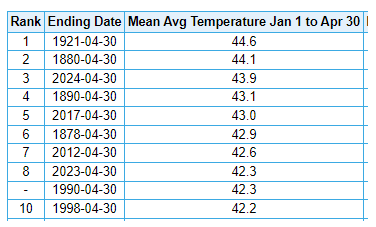
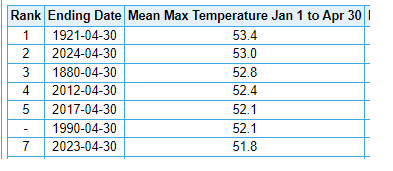
Gets even more depressing when you look at the cold years. It used to be common for the first 4 months of the year to average 36-39F in the 19th century and early 20th century. This isn't too dissimilar to recent years in Bradford, Pennsylvania. Elevation over 2000 feet on the border with New York surrounded by the Allegheny National Forest, with an average snowfall over 100 inches per year. A better comparison might be to Elkins, West Virginia, which is at a similar latitude but near 2000 feet of elevation. Many recent years have been several degrees warmer in the winter and early spring than many of these early years in Washington, DC. I don't think anyone would believe if you said the ridges are now several degrees warmer than DC used to be in the winter and early spring. But that is in fact what the actual data reveals. Obviously, a bit misleading to just look at specific years. But the most recent 9 years at Elkins - a location with an average annual snowfall of nearly 70 inches - matches the 30-year average from 1875 to 1904 in Washington, DC. DC (1875-1904) Elkins, WV (last 9 years) Obviously some of the warming at DC might be attributable to urban heat island effect. But there is no UHI in Bradford or Elkins. There were far, far more people living in DC in 1900 than there are in the entirety of Randolph County, West Virginia (pop: 27k) or McKean County, Pennsylvania (pop: 40k) in the year of our lord 2024. So really if anything the old DC numbers would be inflated relative to the readings at these locations today.