TheClimateChanger
-
Posts
4,551 -
Joined
-
Last visited
Content Type
Profiles
Blogs
Forums
American Weather
Media Demo
Store
Gallery
Everything posted by TheClimateChanger
-
2024-2025 La Nina
TheClimateChanger replied to George001's topic in Weather Forecasting and Discussion
Actually, I remember going to fireworks and occasionally needing a hoodie at night because it was in the low 60s. You don't need that today, because it's still 70+ at 11 pm. -
2024-2025 La Nina
TheClimateChanger replied to George001's topic in Weather Forecasting and Discussion
I was living in the 90s, and I don't recall it as "much hotter." We didn't even have air conditioning in my bedroom. I don't think you could do that today. It doesn't cool down enough at night to open a window. -
2024-2025 La Nina
TheClimateChanger replied to George001's topic in Weather Forecasting and Discussion
Yes, overall, that looks like a cool summer. Compared to most modern summers, a summer of yesteryear, no doubt. -
2024-2025 La Nina
TheClimateChanger replied to George001's topic in Weather Forecasting and Discussion
I think 1977 is exaggerated or something. It was the second coldest on record at Pittsburgh, behind only 1976. -
2024-2025 La Nina
TheClimateChanger replied to George001's topic in Weather Forecasting and Discussion
Going to tough to break those inflated numbers from the HO-83 era. Big warm bias at the first order sites. -
Wow, JB doesn't seem to understand the difference between an ice sheet and sea ice. Odd.
-
2024-2025 La Nina
TheClimateChanger replied to George001's topic in Weather Forecasting and Discussion
Not sure I buy that. It looks like a 5-period moving average is near the maximum for 90-degree days at both LGA and EWR, with the LOESS curve predicting the highest value of 90+ days in the POR at both sites. Looks like we are on the precipice of a big upswing in heat. Even a small additional increase in 90+ days would likely push your area outside of historic norms. Also, as I have noted numerous times, the heat spike from 1986-1995 very likely an artifact of the data collection due to the defective HO-83 sensors in use during that brief era. The increase in 90+ days matches up temporally with the proliferation of HO-83 units. After installation of ASOS, the 90+ days rapidly drop back to pre-1986 levels, from which they have since steadily climbed. The impact of the HO-83 cannot be dismissed a small bias. It was a substantial bias, the magnitude of which varied by site. At Lincoln, Nebraska, it averaged nearly 2F warmer than the ASOS, although at times, it could be as much as 7F warmer. See: Central Region Technical Attachment 93-07, Comparison of ASOS and HO83 Temperatures at Lincoln, Nebraska from November 1991 through October 1992, George H. Grosshans, NWS Lincoln (1993). -
Through yesterday, this has been the sixth warmest spring to date. By my calculation, May would need to finish with an average temperature of 68.1F to tie the record for warmest spring (set in 2024). Currently, the month to date is at 65.4F. We will lose some ground this week; however, there are some indications of a warmer weather pattern by the middle of the month. Either way, a top five warmest spring season is looking increasingly likely.
-
-
Spartaman is not going to like the Old Farmer’s Almanac outlook for the summer. Hot and dry pretty much everywhere, except in Ohio and surrounding areas. At least it’ll still be hot - although with all that rain, you have to assume it would be more from warmer minimum temperatures.
-
2024-2025 La Nina
TheClimateChanger replied to George001's topic in Weather Forecasting and Discussion
I think some people are missing out on how much warming has occurred globally since the 1990s. Just look at the UAH temperature data [which uses a 1991-2020 baseline] and the 1990s look as warm globally as the 1800s used to look in the 1980s & 1990s, which to me suggests as much warming occurred in the last 25 years as had occurred in the preceding 100+ years. -
April checked in at +0.61C [versus 1991-2020] on UAH V6.1.
-
Hoping we miss the severe weather today after the wild storm on Tuesday. Not looking super good though, with the temperature up to 80F already.
-
Up to 85F in the Motor City, besting the 126 year old record of 83F.
-
Similar story in many spots, with unprecedented morning temperatures.
-
Very impressive warmth this morning. Rewriting the record books, with the highest hourly observation (since 1942) for every hour between 3 and 8 am, inclusive, and tying the record value for 9 am.
-
Thank you for the update. One correction, however, just to be clear... Copernicus uses an 1850-1900 baseline. I know they refer to it as "pre-industrial" which may imply before 1850, but it is, in fact, based on the second half of the 19th century averages [even if a fair amount of industrialization had occurred by that time]. Not trying to be critical, just wanted to clarify. A lot of times, the choice of baseline can make a big difference. Of course, in that era, the changes were relatively smaller. Still, a baseline of 1800-1850 could be 0.1 or 0.2C cooler. Just not enough data from that era to say for sure.
-
The average high temperature YTD for Detroit is 43.0F, which is 25th warmest [of 152 years in the threaded history], placing it around the top 16% of all years. Although only 3 years of the past 9 have been cooler (2022, 2019 & 2018).
-
Another top shelf one today, albeit a tad on the warm side with highs climbing into the 80s. Definitely a continuation of the same theme we've seen since March 1. In the Motor City, this is 8th warmest spring to date, by mean high temperature (Detroit threaded record - 152 years). Prior to 2010, only 4 years were warmer (1945, 1946, 1976 & 1977). Definitely some elite company in there. I remember looking at spring temperatures in years like 1945, 1946, and 1921 as unbelievably hot back in the 90s. 4th warmest at Detroit City Airport (92 years).
-
Interestingly, the warmth has been driven more by high temperatures than low temperatures. I know certain people don't like using daily average temperature, but, in this regime, I bet those same people would eschew the use of daily maxima.
-
What season are we in now? Fake summer? The brutal thing about this year was losing all of my magnolia blossoms before they opened. Just devastating. Fake spring came so early that it took them out in the cold snap earlier this month.
-
Occasional Thoughts on Climate Change
TheClimateChanger replied to donsutherland1's topic in Climate Change
Not sure how I feel about this. On the one hand, states like Pennsylvania and New York have been greatly harmed by the advent of air conditioning and the anti-labor policies of the southern United States (which have drawn capital southward due to lower wages, less benefits, etc). Moreover, the south was responsible for the death of 400,000 Americans just 160 years ago, the bulk coming from states like New York and Pennsylvania, and have never received appropriate punishment (IMO) for that crime. A great amelioration of the climate of New York and Pennsylvania is ongoing which should be a boon to the region. But instead we are going to block out the sun so that Texas, Arizona, and Florida will be better off. And you know who is going to pay for it? All of us, rather than the lion's share falling on places that stand to benefit the most. We'll probably end up subsidizing their insurance as well. I say let states like Arizona, Texas, Florida etc. handle it. They hate federal involvement anyways - let alone international cooperation. So let them come up with their own solutions. -
Looking like we may make a push for one of the warmest spring seasons on record if this continues into May. Currently, sitting in 9th place, with a good chance of making a push for top 5 by the end of April. April will be the third consecutive above normal month at PIT, and 21st out of the last 22 months.
-
You would think by the characterization of these threads (March & April) that this has been a cold and miserable spring. In fact, it's been one of the most favored springs on record with excellent planting conditions. By the end of the month, many places should be looking at a top 10 warmest spring season to date. Dayton, Ohio, for instance, where the thread creator resides, is currently in 11th place, which places this season around the 92nd percentile of all years! For the record, 1945 & 1946 were not observed at the airport. Temperatures were quite a bit cooler at the airport site:
-
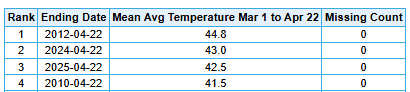
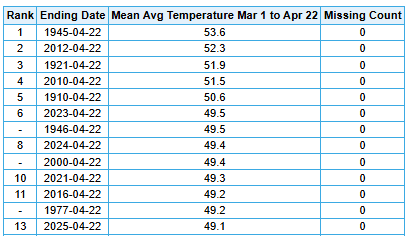
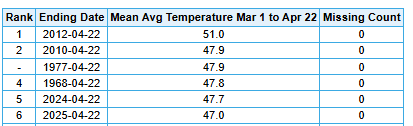
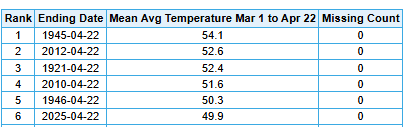
Central PA Spring 2025
TheClimateChanger replied to canderson's topic in Upstate New York/Pennsylvania
One of the most favored springs in the storied history of this Commonwealth to date. Models show continued warmth into the month of May. I suspect that, by the end of April, most places will be top 5-10, with some of the shorter period of record sites perhaps making a push for warmest spring on record. Outstanding conditions for spring planting. Pittsburgh [9th warmest] DuBois [4th warmest] Bradford [3rd warmest] Harrisburg [13th warmest] Williamsport [9th warmest] Altoona [6th warmest] Reading [6th warmest] Allentown [8th warmest] Philadelphia [8th warmest]