TheClimateChanger
-
Posts
4,436 -
Joined
-
Last visited
Content Type
Profiles
Blogs
Forums
American Weather
Media Demo
Store
Gallery
Everything posted by TheClimateChanger
-
Spring/Summer '24 Banter and Complaint Thread
TheClimateChanger replied to IWXwx's topic in Lakes/Ohio Valley
Summer is almost certain to be a scorcher. Just looking over the numbers for some recent summers, and it's insane. At Toledo, 3 of the top 5 hottest summers have occurred this decade [and it's only 4 years old]. At Mansfield, Ohio, the top 2 hottest summers have occurred in the past 4 years. At Akron-Canton, ALL of the top 5 hottest summers have occurred in the past 8 years. Cleveland has lucked out a bit on the summer heat front, but still 4 of the top 8 have occurred in the past 14 years, and 5 of the top 8 have occurred in the past 19 years. These are all long period of record sites. Despite all this, we'll still hear about how much hotter it was in the 1930s! -
March 2024 General Discussion
TheClimateChanger replied to HillsdaleMIWeather's topic in Lakes/Ohio Valley
I wonder if the enhanced atmospheric carbon dioxide helps green things up too. Was 394 ppm in 2012, and today it’s 425. -
March 2024 General Discussion
TheClimateChanger replied to HillsdaleMIWeather's topic in Lakes/Ohio Valley
Wow, can you imagine this today?!? -20F in north central Ohio on March 12. -
Occasional Thoughts on Climate Change
TheClimateChanger replied to donsutherland1's topic in Climate Change
-
Central PA Winter 23/24
TheClimateChanger replied to Voyager's topic in Upstate New York/Pennsylvania
Wasn't a good year in western Pennsylvania either. I know Soergel's had to cancel their strawberry festival last year, although they did get some strawberries later in the season after it started raining again. Looking like fruit growers are going to have a tough time navigating this new climate. Spring just doesn't seem delayed enough anymore to retard plant growth sufficiently to counter the threat of spring frosts and freezes. -
Pittsburgh/Western PA Spring 2024
TheClimateChanger replied to Ahoff's topic in Upstate New York/Pennsylvania
-
Pittsburgh/Western PA Spring 2024
TheClimateChanger replied to Ahoff's topic in Upstate New York/Pennsylvania
A little stat padding spring snow that will melt in between each snowy interval. -
Occasional Thoughts on Climate Change
TheClimateChanger replied to donsutherland1's topic in Climate Change
-
Pittsburgh/Western PA Spring 2024
TheClimateChanger replied to Ahoff's topic in Upstate New York/Pennsylvania
Don't worry. I am sure there will be plenty more record warmth to come. Even I've grown tired of the constant record warmth and taken a bit of a break despite that fact that various records continue to be approached or broken all over the place. -
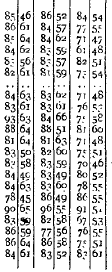
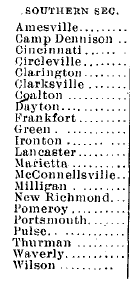
Just a bunch of nonsense. It was actually allegedly 96F in Portsmouth, Ohio, in March 1907. Apparently Chris tossed that value. Shown below are March 22-24, 1907. Look at this nonsense. Green was 3 degrees warmer than Portsmouth, and 5-15F warmer than every other site on the 22nd. Portsmouth was 8-19F warmer than the rest of southern Ohio on the 23rd, and 7-24F warmer on the 24th. Funny how we don't see this extreme random site variation with modern equipment - almost like those values aren't very reliable, and should be tossed! Which makes it all the crazier when we do beat statewide record maxima, as in the case of Michigan in February. Not just an isolated station or two, but fully half or more of the state! So the tl;dr, this is probably the worst possible metric to gauge climate change. As you pointed out, monthly means are a much better way to evaluate that since these questionable extremes are filtered out through averaging.
-
Damn, Forky just predicted a record number of EWR is running too high this summer the other day. And it’s already started. Best prediction yet.
-
Philadelphia Historical Snowfall Data:
TheClimateChanger replied to ncforecaster89's topic in Philadelphia Region
Agreed. Also, 1949-1950 was officially observed as 1.9", even though it's now given as 2.0". There was a trace of snow reported on March 2nd, but it's been changed after the fact to 0.1". Obviously, today, that would be a measurable snow on an official measuring board [0.01" of precipitation with temperatures at or below 31F all day], but at the time it was reported as a trace. I'm sure there are plenty of days like this in the official records, suggesting an undercount in earlier years. -
Central PA Winter 23/24
TheClimateChanger replied to Voyager's topic in Upstate New York/Pennsylvania
-
2024 Short/Medium Range Severe Weather Discussion
TheClimateChanger replied to Chicago Storm's topic in Lakes/Ohio Valley
-
Pittsburgh/Western PA Spring 2024
TheClimateChanger replied to Ahoff's topic in Upstate New York/Pennsylvania
-
Pittsburgh/Western PA Spring 2024
TheClimateChanger replied to Ahoff's topic in Upstate New York/Pennsylvania
Looks like we are going to struggle to get many 90s again. My weather station was from 1.5-2F cooler than the airport, but now since the sun came out and spring has arrived, it's 2-4F warmer during the afternoon. Still cooler at night though. -
To highlight how profound this impact is, if we look at the first 34 years of data collected at the Michigan State Agricultural College [now Michigan State University], the mean minima in the month of March was 18.7F. The mean low temperature of the most recent 14 Marches observed at Capital City Airport is 26.8F. Further, the mean monthly minima for the month of January and February over the past 15 years is 18.2F and 18.3F, respectively. Or only slightly less than the 19th century March average.
-
Also, I find it rather presumptuous that you think I was trying to ameliorate a growing UHI effect. I was just trying to eliminate as much urban heat island contamination, regardless of when it occurred. Most of this is comparing data collected from rooftop and/or north-facing window enclosures in the city center to modern data collected from suburban airport sites with equipment properly installed at an appropriate height over grass or sod. The low temperatures in the early data are more impacted by this, and therefore show less warming at most of the sites. We can see one exception to this is the data for East Lansing, where minima have increased by an astounding 8.1F in the month of March when comparing the first 34 years of data to the most recent 14 years. This is likely due to the fact that the temperature shelter was properly housed over grass or sod, and East Lansing was still very rural [especially in 1863, when the data starts].
-
One interesting thing is the mean high temperature in April during the 19th century was closer to recent March high temperatures than the 19th century March figures at many sites. That's the case at Milwaukee, Chicago, Cleveland, Washington, New York, Philadelphia, Atlanta and Charlotte. Detroit is a push. I think that's consistent with about a 2-3 week seasonal shift forward, which I think is also supported by phenological data. March in the 19th century had a climate we associate with the period of mid February through early March. March today is more akin to the period from mid March through early April from the 19th century.
-
Winter '23-'24 Piss and Moan/Banter Thread
TheClimateChanger replied to IWXwx's topic in Lakes/Ohio Valley
Both of those were at lakeside observatories on a rooftop. C'mon man, you would have loved this. These are the glory days for Detroit. In the modern threaded record, there are only 15 years that had a peak snow depth of 12" or more at Detroit [out of 77 years]. The maximum is 24" from the winter of 1998-1999. From 1885-1886 to 1911-12 (rounding to the nearest inch), the following peak depths were noted: (1) 26" in 1899-1900 (2) 25" in 1885-1886 [in April, no less!] (3) 18" in 1892-1893 (4) 16" in 1904-1905 (5) 15" in 1907-1908 (6) 15" in 1903-1904 (7) 14" in 1893-1894 (8) 14" in 1894-1895 (9) 14" in 1909-1910 (10) 13" in 1911-1912 (11) 12" in 1910-1911 (12) 12" in 1908-1909 (13) 11" in 1900-1901 (14) 11" in 1898-1899 That's 12 years with 12"+ more peak depth, and 14 with 11" or more, in just 27 winters, compared to 15 & 18 in 77 winters with daily snow depth data - including two years with peak depths higher than any observed in the most recent 77 winters. Look at the 24 hour snowfalls - at least 8 double digit snowfalls [possible additional ones, since I didn't check], including 4 years with 12"+ [and a fifth at 11.8"] with one having observed more than 24" in a 24 hour period. This is clearly a higher frequency of big storms and deep snow depth than recent decades.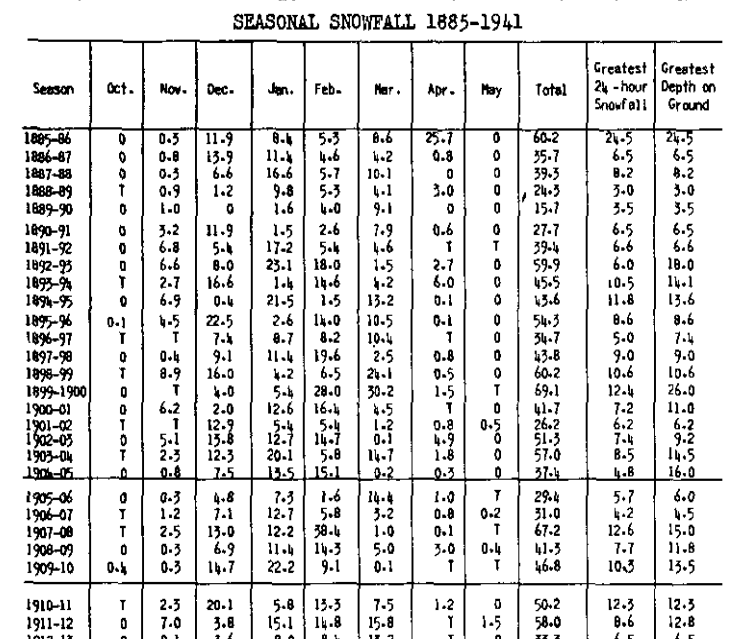
-
March 2024 General Discussion
TheClimateChanger replied to HillsdaleMIWeather's topic in Lakes/Ohio Valley
Looks like another new record. Was 71 at the top of last hour at MSP. -
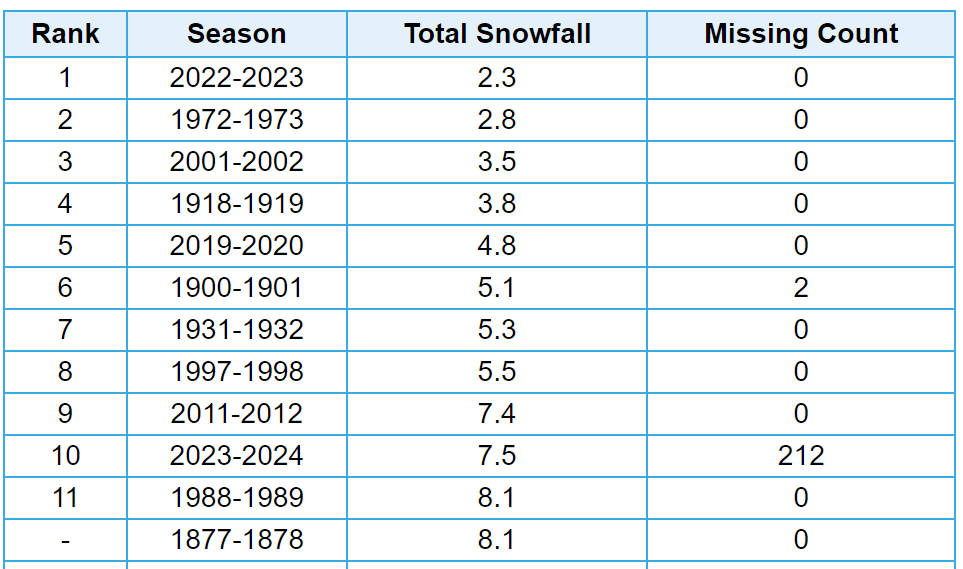
Will be interesting to see whether New York City observes any more snowfall this winter. Currently, ninth least for the season dating back to the winter of 1868-1869. Only partial records available for the first winter, but there was still far more snowfall observed in the available months. xMacis has this as 10th least; however, there was actually 9.1" observed in the winter of 1900-1901. xMacis is missing 4 inches from that winter.
-
Winter '23-'24 Piss and Moan/Banter Thread
TheClimateChanger replied to IWXwx's topic in Lakes/Ohio Valley
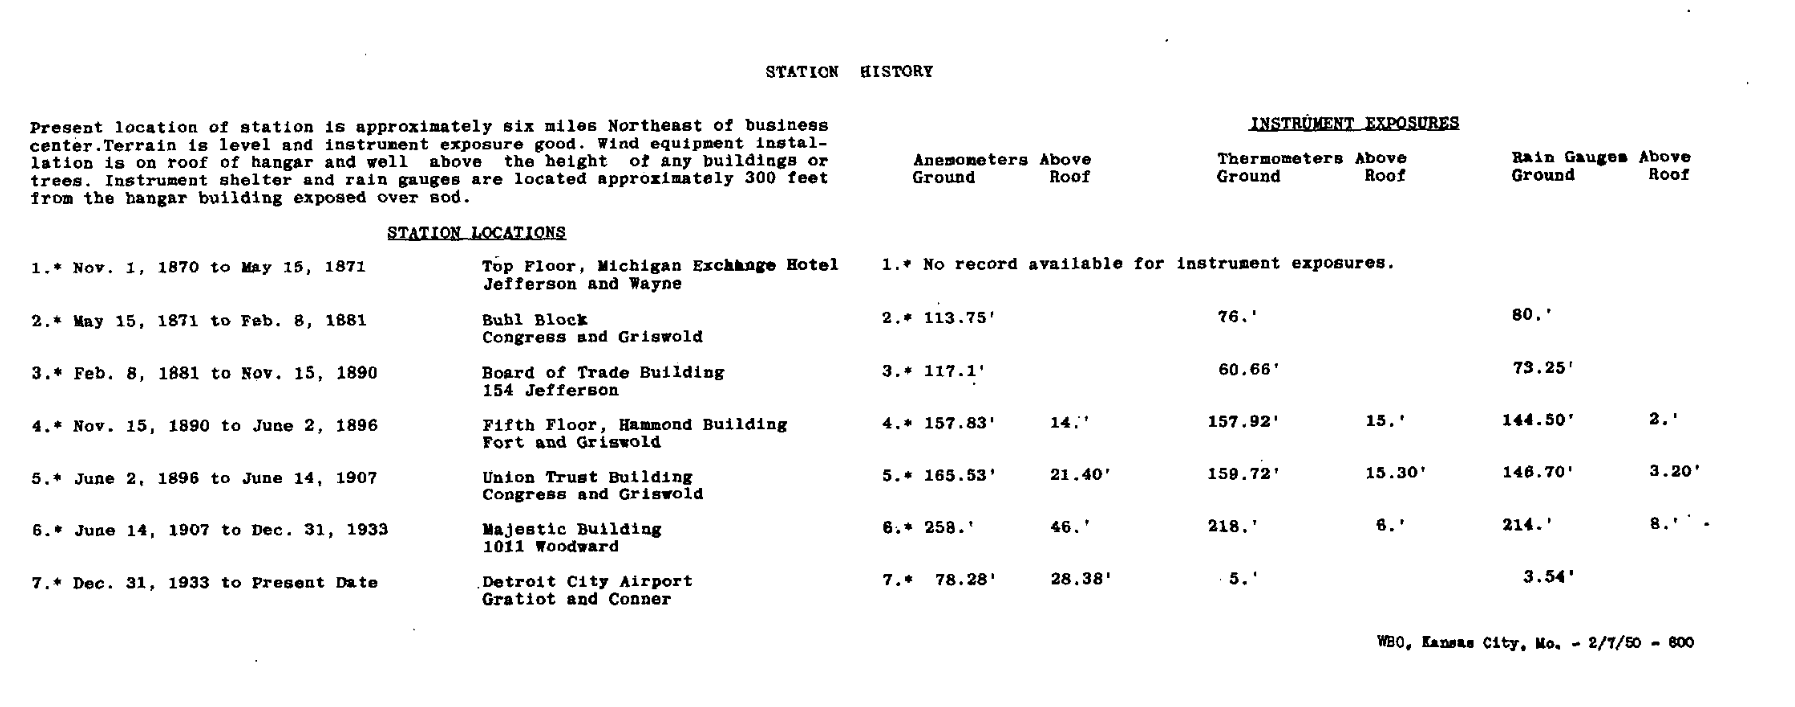
The point is we are comparing temperatures collected over grass or sod from modern aspirated temperature sensors to mercury thermometers housed in shelters in a window enclosure or on rooftops. Obviously, it would be substantially warmer if the official observation was still taken downtown on a rooftop. And then we have people in this thread lying about there being LESS UHI in 1930. The population of Detroit was 1.6 million in 1930, and the official observation site was on the rooftop of the Majestic Building downtown at 1011 Woodward. All I'm doing is providing actual data... it was indeed the warmest on record at DET back to 1933-1934 and at DTW back to 1958-1959, as well as the fourth warmest in the threaded record back to 1874 [1870-1871, if you include the tri-daily means pre-1874], while also providing useful information about the historic location and exposure of the official station in the threaded record, and countering disinformation. Station history from 1949 annual publication: Useful information on impacts of rooftop exposure versus sod/grass: How not to measure temperature, part 48. NOAA cites errors with Baltimore's Rooftop USHCN Station – Watts Up With That?
-
Winter '23-'24 Piss and Moan/Banter Thread
TheClimateChanger replied to IWXwx's topic in Lakes/Ohio Valley
I’m talking about the city office records, which were indeed a north-facing window exposure for the first several years, and rooftop exposure thereafter.