
Ephesians2
-
Posts
586 -
Joined
Content Type
Profiles
Blogs
Forums
American Weather
Media Demo
Store
Gallery
Everything posted by Ephesians2
-
I come from the future... [code] STATION: LYNCHBURG VA MONTH: JANUARY YEAR: 2027 LATITUDE: 37 19 N LONGITUDE: 79 12 W TEMPERATURE IN F: :PCPN: SNOW: WIND :SUNSHINE: SKY :PK WND ================================================================================ 1 2 3 4 5 6A 6B 7 8 9 10 11 12 13 14 15 16 17 18 12Z AVG MX 2MIN DY MAX MIN AVG DEP HDD CDD WTR SNW DPTH SPD SPD DIR MIN PSBL S-S WX SPD DR ================================================================================ 1 73 44 59 22 6 0 0.00 0.0 0 6.0 15 300 M M 1 1 25 310 2 62 32 47 10 18 0 0.01 0.0 0 6.9 13 50 M M 7 18 50 3 53 22 38 1 27 0 0.15 0.1 0 2.5 10 40 M M 10 1 13 40 4 40 17 29 -8 36 0 0.00 0.0 0 4.0 10 200 M M 3 12 15 210 5 39 32 36 0 29 0 0.92 1.0 0 5.7 17 190 M M 10 12 25 190 6 43 29 36 0 29 0 0.10 0.0 1 4.5 15 40 M M 8 20 40 7 44 21 33 -3 32 0 0.00 0.0 0 8.7 26 200 M M 6 39 200 8 52 39 46 10 19 0 2.04 0.0 0 4.6 13 270 M M 10 1 22 280 9 46 23 35 -1 30 0 0.10 0.0 0 3.1 15 260 M M 8 12 23 280 10 43 23 33 -3 32 0 0.00 0.0 0 4.9 15 190 M M 1 22 190 11 57 26 42 6 23 0 0.00 0.0 0 8.6 23 190 M M 1 32 210 12 63 39 51 15 14 0 0.01 0.0 0 5.0 16 10 M M 5 12 30 20 13 68 44 56 21 9 0 0.00 0.0 0 11.3 30 200 M M 0 43 200 14 57 42 50 15 15 0 0.00 0.0 0 3.9 12 310 M M 0 20 310 15 56 40 48 13 17 0 0.07 0.0 0 6.9 14 40 M M 7 1 20 40 16 46 32 39 4 26 0 1.16 0.0 0 13.6 30 220 M M 10 1 48 220 17 41 23 32 -3 33 0 0.00 0.0 0 7.4 16 260 M M 3 28 270 18 44 25 35 0 30 0 0.00 0.0 0 4.8 14 190 M M 2 19 200 19 40 28 34 -1 31 0 0.00 0.0 0 2.3 9 220 M M 3 14 350 20 34 21 28 -8 37 0 T T 0 7.5 22 190 M M 6 36 180 21 38 23 31 -5 34 0 0.01 0.0 0 2.5 12 360 M M 6 21 340 22 37 23 30 -6 35 0 0.50 5.5 0 5.5 17 200 M M 10 29 270 23 34 23 29 -7 36 0 0.63 5.1 5 7.0 21 300 M M 10 36 320 24 43 24 34 -2 31 0 0.00 0.0 10 4.6 14 70 M M 0 24 40 25 53 22 38 2 27 0 0.00 0.0 8 4.9 17 190 M M 0 23 140 26 60 24 42 6 23 0 0.00 0.0 3 8.8 18 200 M M 1 28 210 27 69 37 53 17 12 0 0.21 0.0 0 7.4 17 40 M M 9 1 26 30 28 55 34 45 8 20 0 0.00 0.0 0 4.6 14 310 M M 1 30 0 29 42 30 36 -1 29 0 1.20 2.6 0 8.2 22 190 M M 10 32 200 30 34 24 29 -8 36 0 0.66 5.0 2 6.8 16 210 M M 10 22 210 31 32 20 26 -11 39 0 0.01 0.1 6 11.7 23 190 M M 8 30 200 ================================================================================ SM 1498 886 815 0 7.78 19.4 194.2 M 166 ================================================================================ AV 48.3 28.6 6.3 FASTST M M 5 MAX(MPH) MISC ----> # 30 200 48 220 ================================================================================ NOTES: # LAST OF SEVERAL OCCURRENCES COLUMN 17 PEAK WIND IN M.P.H. [/code] [code] PRELIMINARY LOCAL CLIMATOLOGICAL DATA (WS FORM: F-6) , PAGE 2 STATION: LYNCHBURG VA MONTH: JANUARY YEAR: 2027 LATITUDE: 37 19 N LONGITUDE: 79 12 W [TEMPERATURE DATA] [PRECIPITATION DATA] SYMBOLS USED IN COLUMN 16 AVERAGE MONTHLY: 38.7 TOTAL FOR MONTH: 7.78 1 = FOG OR MIST DPTR FM NORMAL: 2.7 DPTR FM NORMAL: +4.28 2 = FOG REDUCING VISIBILITY HIGHEST: 73 ON 1 GRTST 24HR 2.14 ON 8-9 TO 1/4 MILE OR LESS LOWEST: 17 ON 4 3 = THUNDER SNOW, ICE PELLETS, HAIL 4 = ICE PELLETS TOTAL MONTH: 19.4 INCH 5 = HAIL GRTST 24HR 10.6 ON 22-23 6 = FREEZING RAIN OR DRIZZLE GRTST DEPTH: 10 7 = DUSTSTORM OR SANDSTORM: VSBY 1/2 MILE OR LESS 8 = SMOKE OR HAZE [NO. OF DAYS WITH] [WEATHER - DAYS WITH] 9 = BLOWING SNOW X = TORNADO MAX 32 OR BELOW: 1 0.01 INCH OR MORE: 16 MAX 90 OR ABOVE: 0 0.10 INCH OR MORE: 11 MIN 32 OR BELOW: 23 0.50 INCH OR MORE: 7 MIN 0 OR BELOW: 0 1.00 INCH OR MORE: 3 [/code] [code] STATION: LYNCHBURG VA MONTH: FEBRUARY YEAR: 2027 LATITUDE: 37 19 N LONGITUDE: 79 12 W TEMPERATURE IN F: :PCPN: SNOW: WIND :SUNSHINE: SKY :PK WND ================================================================================ 1 2 3 4 5 6A 6B 7 8 9 10 11 12 13 14 15 16 17 18 12Z AVG MX 2MIN DY MAX MIN AVG DEP HDD CDD WTR SNW DPTH SPD SPD DIR MIN PSBL S-S WX SPD DR ================================================================================ 1 33 24 29 -8 36 0 0.00 0.0 0 6.0 15 300 M M 1 1 25 310 2 42 32 37 0 28 0 0.08 0.1 0 6.9 13 50 M M 7 18 50 3 43 22 33 -4 32 0 0.00 0.0 0 2.5 10 40 M M 10 1 13 40 4 50 27 39 2 26 0 0.00 0.0 0 4.0 10 200 M M 3 12 15 210 5 56 21 39 1 26 0 0.10 0.0 0 5.7 17 190 M M 7 12 25 190 6 43 28 36 -2 29 0 0.00 0.0 0 4.5 15 40 M M 2 20 40 7 30 21 26 -12 39 0 1.10 11.0 0 8.7 26 200 M M 10 39 200 8 32 19 26 -12 39 0 0.94 9.2 11 4.6 13 270 M M 10 1 22 280 9 26 3 15 -23 50 0 0.00 0.0 19 3.1 15 260 M M 2 12 23 280 10 33 13 23 -15 42 0 0.10 2.1 18 4.9 15 190 M M 9 22 190 11 37 16 27 -11 38 0 0.00 0.0 19 8.6 23 190 M M 1 32 210 12 43 24 34 -5 31 0 0.03 0.3 17 5.0 16 10 M M 6 12 30 20 13 58 34 46 7 19 0 0.00 0.0 14 11.3 30 200 M M 0 43 200 14 56 32 44 5 21 0 0.00 0.0 6 3.9 12 310 M M 0 20 310 15 66 50 58 19 7 0 0.57 0.0 1 6.9 14 40 M M 9 1 20 40 16 56 48 52 13 13 0 2.16 0.0 0 13.6 30 220 M M 10 3 48 220 17 51 29 40 1 25 0 1.20 0.0 0 7.4 16 260 M M 10 28 270 18 44 25 35 -5 30 0 0.00 0.0 0 4.8 14 190 M M 2 19 200 19 50 28 39 -1 26 0 0.00 0.0 0 2.3 9 220 M M 3 14 350 20 44 31 38 -2 27 0 1.32 T 0 7.5 22 190 M M 10 36 180 21 48 33 41 1 24 0 0.01 0.0 0 2.5 12 360 M M 6 21 340 22 57 33 45 5 20 0 0.00 0.0 0 5.5 17 200 M M 0 29 270 23 64 43 54 14 11 0 0.03 0.0 0 7.0 21 300 M M 6 36 320 24 53 34 44 4 21 0 0.50 0.0 0 4.6 14 70 M M 9 24 40 25 43 30 37 -4 28 0 0.00 0.0 0 4.9 17 190 M M 0 23 140 26 50 29 40 -1 25 0 0.10 0.3 0 8.8 18 200 M M 8 28 210 27 39 27 33 -8 32 0 0.31 4.0 0 7.4 17 40 M M 10 1 26 30 28 55 34 45 4 20 0 0.00 0.0 3 4.6 14 310 M M 1 30 0 ================================================================================ SM 1302 790 765 0 8.55 27.0 167.5 M 152 ================================================================================ AV 46.5 28.2 6.0 FASTST M M 5 MAX(MPH) MISC ----> # 30 220 48 220 ================================================================================ NOTES: # LAST OF SEVERAL OCCURRENCES COLUMN 17 PEAK WIND IN M.P.H. [/code] [code] PRELIMINARY LOCAL CLIMATOLOGICAL DATA (WS FORM: F-6) , PAGE 2 STATION: LYNCHBURG VA MONTH: FEBRUARY YEAR: 2027 LATITUDE: 37 19 N LONGITUDE: 79 12 W [TEMPERATURE DATA] [PRECIPITATION DATA] SYMBOLS USED IN COLUMN 16 AVERAGE MONTHLY: 37.7 TOTAL FOR MONTH: 8.55 1 = FOG OR MIST DPTR FM NORMAL: -1.3 DPTR FM NORMAL: +5.65 2 = FOG REDUCING VISIBILITY HIGHEST: 66 ON 15 GRTST 24HR 3.36 ON 16-17 TO 1/4 MILE OR LESS LOWEST: 3 ON 9 3 = THUNDER SNOW, ICE PELLETS, HAIL 4 = ICE PELLETS TOTAL MONTH: 27.0 INCH 5 = HAIL GRTST 24HR 20.2 ON 7-8 6 = FREEZING RAIN OR DRIZZLE GRTST DEPTH: 19 7 = DUSTSTORM OR SANDSTORM: VSBY 1/2 MILE OR LESS 8 = SMOKE OR HAZE [NO. OF DAYS WITH] [WEATHER - DAYS WITH] 9 = BLOWING SNOW X = TORNADO MAX 32 OR BELOW: 3 0.01 INCH OR MORE: 15 MAX 90 OR ABOVE: 0 0.10 INCH OR MORE: 11 MIN 32 OR BELOW: 20 0.50 INCH OR MORE: 7 MIN 0 OR BELOW: 0 1.00 INCH OR MORE: 4 [HDD (BASE 65) ] TOTAL THIS MO. 765 CLEAR (SCALE 0-3) 12 DPTR FM NORMAL +37 PTCLDY (SCALE 4-7) 5 TOTAL FM JUL 1 2708 CLOUDY (SCALE 8-10) 11 DPTR FM NORMAL -539 [CDD (BASE 65) ] TOTAL THIS MO. 0 DPTR FM NORMAL 0 [PRESSURE DATA] TOTAL FM JAN 1 0 HIGHEST SLP 30.61 ON 9 DPTR FM NORMAL 0 LOWEST SLP 29.24 ON 16 [/code] [code] CXUS51 KRNK 011132 CF6LYH PRELIMINARY LOCAL CLIMATOLOGICAL DATA (WS FORM: F-6) STATION: LYNCHBURG VA MONTH: MARCH YEAR: 2027 LATITUDE: 37 19 N LONGITUDE: 79 12 W TEMPERATURE IN F: :PCPN: SNOW: WIND :SUNSHINE: SKY :PK WND ================================================================================ 1 2 3 4 5 6A 6B 7 8 9 10 11 12 13 14 15 16 17 18 12Z AVG MX 2MIN DY MAX MIN AVG DEP HDD CDD WTR SNW DPTH SPD SPD DIR MIN PSBL S-S WX SPD DR ================================================================================ 1 54 34 44 2 21 0 0.00 0.0 0 6.0 15 300 M M 1 1 25 310 2 36 32 34 -8 31 0 0.88 4.3 0 12.4 25 40 M M 10 33 40 3 33 22 28 -14 37 0 2.10 19.0 4 18.7 38 30 M M 10 9 46 30 4 30 17 24 -18 41 0 0.20 2.0 21 15.2 31 320 M M 10 9 40 320 5 41 12 27 -16 38 0 0.00 0.0 22 8.3 20 320 M M 1 28 320 6 50 24 37 -6 28 0 0.00 0.0 18 7.1 17 310 M M 2 24 300 7 58 33 46 3 19 0 0.00 0.0 13 5.4 13 220 M M 3 18 210 8 68 44 56 12 9 0 0.32 0.0 8 9.8 24 190 M M 8 12 32 190 9 73 54 64 20 1 0 1.45 0.0 3 13.4 30 190 M M 10 12 41 190 10 78 60 69 25 0 4 2.30 0.0 0 15.1 34 200 M M 10 3 49 200 11 84 64 74 29 0 9 0.85 0.0 0 17.3 39 210 M M 9 35 61 220 12 73 50 62 17 3 0 0.40 0.0 0 14.6 36 280 M M 8 3 46 290 13 54 36 45 0 20 0 0.00 0.0 0 12.0 30 310 M M 3 39 310 14 57 33 45 0 20 0 0.00 0.0 0 7.9 18 320 M M 1 25 320 15 61 37 49 3 16 0 0.00 0.0 0 6.2 15 220 M M 2 21 230 16 65 42 54 8 11 0 0.12 0.0 0 8.1 19 200 M M 7 26 210 17 52 38 45 -1 20 0 0.47 0.0 0 9.3 22 40 M M 10 1 29 40 18 48 31 40 -7 25 0 0.00 0.0 0 10.7 26 320 M M 3 34 320 19 55 29 42 -5 23 0 0.00 0.0 0 6.5 16 290 M M 1 22 290 20 62 34 48 1 17 0 0.00 0.0 0 5.8 14 230 M M 2 19 240 21 68 41 55 7 10 0 0.00 0.0 0 7.7 20 210 M M 3 26 210 22 71 48 60 12 5 0 0.05 0.0 0 9.0 23 200 M M 6 31 200 23 63 45 54 6 11 0 0.62 0.0 0 10.2 25 270 M M 9 1 33 280 24 56 37 47 -1 18 0 0.00 0.0 0 8.8 21 310 M M 2 28 310 25 59 34 47 -2 18 0 0.00 0.0 0 6.4 15 320 M M 1 20 320 26 55 32 44 -5 21 0 0.00 0.0 0 7.2 18 40 M M 6 24 40 27 37 31 34 -15 31 0 0.22 2.0 0 9.8 22 40 M M 10 29 40 28 35 30 33 -17 32 0 0.13 1.4 2 11.4 26 10 M M 10 33 10 29 49 27 38 -12 27 0 0.00 0.0 3 9.6 22 330 M M 4 29 330 30 58 33 46 -4 19 0 0.00 0.0 0 6.8 16 250 M M 2 22 250 31 66 40 53 2 12 0 0.00 0.0 0 5.9 14 210 M M 1 19 210 ================================================================================ SM 1749 1124 584 13 10.11 28.7 302.6 M 165 ================================================================================ AV 56.4 36.3 9.8 FASTST M M 5 MAX(MPH) MISC ----> 39 210 61 220 ================================================================================ NOTES: COLUMN 17 PEAK WIND IN M.P.H. [/code] [code] PRELIMINARY LOCAL CLIMATOLOGICAL DATA (WS FORM: F-6) , PAGE 2 STATION: LYNCHBURG VA MONTH: MARCH YEAR: 2027 LATITUDE: 37 19 N LONGITUDE: 79 12 W [TEMPERATURE DATA] [PRECIPITATION DATA] SYMBOLS USED IN COLUMN 16 AVERAGE MONTHLY: 46.6 TOTAL FOR MONTH: 10.11 1 = FOG OR MIST DPTR FM NORMAL: +0.5 DPTR FM NORMAL: +6.31 2 = FOG REDUCING VISIBILITY HIGHEST: 84 ON 11 GRTST 24HR 3.75 ON 9-10 TO 1/4 MILE OR LESS LOWEST: 12 ON 5 3 = THUNDER SNOW, ICE PELLETS, HAIL 4 = ICE PELLETS TOTAL MONTH: 28.7 INCH 5 = HAIL GRTST 24HR 23.3 ON 2-3 6 = FREEZING RAIN OR DRIZZLE GRTST DEPTH: 22 7 = DUSTSTORM OR SANDSTORM: VSBY 1/2 MILE OR LESS 8 = SMOKE OR HAZE [NO. OF DAYS WITH] [WEATHER - DAYS WITH] 9 = BLOWING SNOW X = TORNADO MAX 32 OR BELOW: 1 0.01 INCH OR MORE: 14 MAX 90 OR ABOVE: 0 0.10 INCH OR MORE: 13 MIN 32 OR BELOW: 11 0.50 INCH OR MORE: 6 MIN 0 OR BELOW: 0 1.00 INCH OR MORE: 3 [HDD (BASE 65) ] TOTAL THIS MO. 584 CLEAR (SCALE 0-3) 15 DPTR FM NORMAL -3 PTCLDY (SCALE 4-7) 4 TOTAL FM JUL 1 3292 CLOUDY (SCALE 8-10) 12 DPTR FM NORMAL -542 [CDD (BASE 65) ] TOTAL THIS MO. 13 DPTR FM NORMAL +13 [PRESSURE DATA] TOTAL FM JAN 1 13 HIGHEST SLP 30.68 ON 5 DPTR FM NORMAL +13 LOWEST SLP 28.97 ON 3 [/code]
-
I come from the future. STATION: LYNCHBURG VA MONTH: DECEMBER YEAR: 2026 LATITUDE: 37 19 N LONGITUDE: 79 12 W TEMPERATURE IN F: :PCPN: SNOW: WIND :SUNSHINE: SKY :PK WND ================================================================================ 1 2 3 4 5 6A 6B 7 8 9 10 11 12 13 14 15 16 17 18 12Z AVG MX 2MIN DY MAX MIN AVG DEP HDD CDD WTR SNW DPTH SPD SPD DIR MIN PSBL S-S WX SPD DR ================================================================================ 1 73 45 59 17 6 0 0.00 0.0 0 6.0 15 300 M M 1 1 25 310 2 52 42 47 5 18 0 1.18 0.0 0 6.9 13 50 M M 10 18 50 3 49 37 43 1 22 0 0.95 0.0 0 2.5 10 40 M M 10 1 13 40 4 60 37 49 7 16 0 0.00 0.0 0 4.0 10 200 M M 3 12 15 210 5 69 42 56 15 9 0 0.00 0.0 0 5.7 17 190 M M 1 12 25 190 6 73 49 61 20 4 0 0.00 0.0 0 4.5 15 40 M M 2 20 40 7 70 51 61 20 4 0 0.00 0.0 0 8.7 26 200 M M 6 39 200 8 62 49 56 15 9 0 0.64 0.0 0 4.6 13 270 M M 9 1 22 280 9 66 43 55 14 10 0 0.00 0.0 0 3.1 15 260 M M 2 12 23 280 10 73 53 63 23 2 0 0.00 0.0 0 4.9 15 190 M M 1 22 190 11 77 56 67 27 0 2 0.00 0.0 0 8.6 23 190 M M 1 32 210 12 63 39 51 11 14 0 1.48 0.0 0 5.0 16 10 M M 10 12 30 20 13 58 34 46 6 19 0 0.00 0.0 0 11.3 30 200 M M 0 43 200 14 67 32 50 10 15 0 0.00 0.0 0 3.9 12 310 M M 0 20 310 15 76 50 63 24 2 0 0.07 0.0 0 6.9 14 40 M M 7 1 20 40 16 66 42 54 15 11 0 2.16 0.0 0 13.6 30 220 M M 10 3 48 220 17 51 33 42 3 23 0 0.00 0.0 0 7.4 16 260 M M 3 28 270 18 64 45 55 16 10 0 0.20 0.0 0 4.8 14 190 M M 8 19 200 19 70 48 59 20 6 0 0.00 0.0 0 2.3 9 220 M M 3 14 350 20 74 51 63 25 2 0 T 0.0 0 7.5 22 190 M M 6 36 180 21 68 53 61 23 4 0 0.01 0.0 0 2.5 12 360 M M 6 21 340 22 77 44 61 23 4 0 0.00 0.0 0 5.5 17 200 M M 0 29 270 23 74 43 59 21 6 0 0.03 0.0 0 7.0 21 300 M M 6 36 320 24 63 44 54 16 11 0 0.00 0.0 0 4.6 14 70 M M 0 24 40 25 73 43 58 21 7 0 0.00 0.0 0 4.9 17 190 M M 0 23 140 26 80 54 67 30 0 2 0.10 0.0 0 8.8 18 200 M M 7 3 28 210 27 69 47 58 21 7 0 2.31 0.0 0 7.4 17 40 M M 10 13 26 30 28 55 34 45 8 20 0 0.00 0.0 0 4.6 14 310 M M 1 30 0 29 42 37 40 3 25 0 0.62 0.0 0 8.2 22 190 M M 10 32 200 30 61 44 53 17 12 0 0.16 0.0 0 6.8 16 210 M M 8 22 210 31 62 50 56 20 9 0 3.70 0.0 0 11.7 23 190 M M 10 3 30 200 ================================================================================ SM 2037 1371 307 4 13.61 0.0 194.2 M 86 ================================================================================ AV 65.7 44.2 6.3 FASTST M M 5 MAX(MPH) MISC ----> # 30 200 48 220 ================================================================================ NOTES: # LAST OF SEVERAL OCCURRENCES COLUMN 17 PEAK WIND IN M.P.H. PRELIMINARY LOCAL CLIMATOLOGICAL DATA (WS FORM: F-6) , PAGE 2 STATION: LYNCHBURG VA MONTH: DECEMBER YEAR: 2026 LATITUDE: 37 19 N LONGITUDE: 79 12 W [TEMPERATURE DATA] [PRECIPITATION DATA] SYMBOLS USED IN COLUMN 16 AVERAGE MONTHLY: 55.2 TOTAL FOR MONTH: 13.61 1 = FOG OR MIST DPTR FM NORMAL: 16.0 DPTR FM NORMAL: +10.11 2 = FOG REDUCING VISIBILITY 3 = THUNDER
-
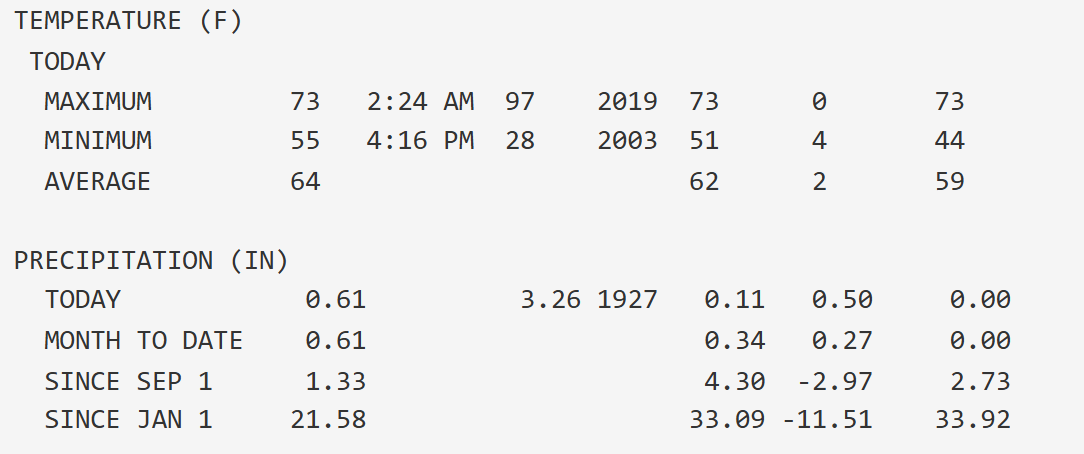
About 12 inches below normal precip YTD and still in D2 down here. Hopefully this knocks about 2 inches or so off the deficit. It is awfully dry in a lot of places.
-

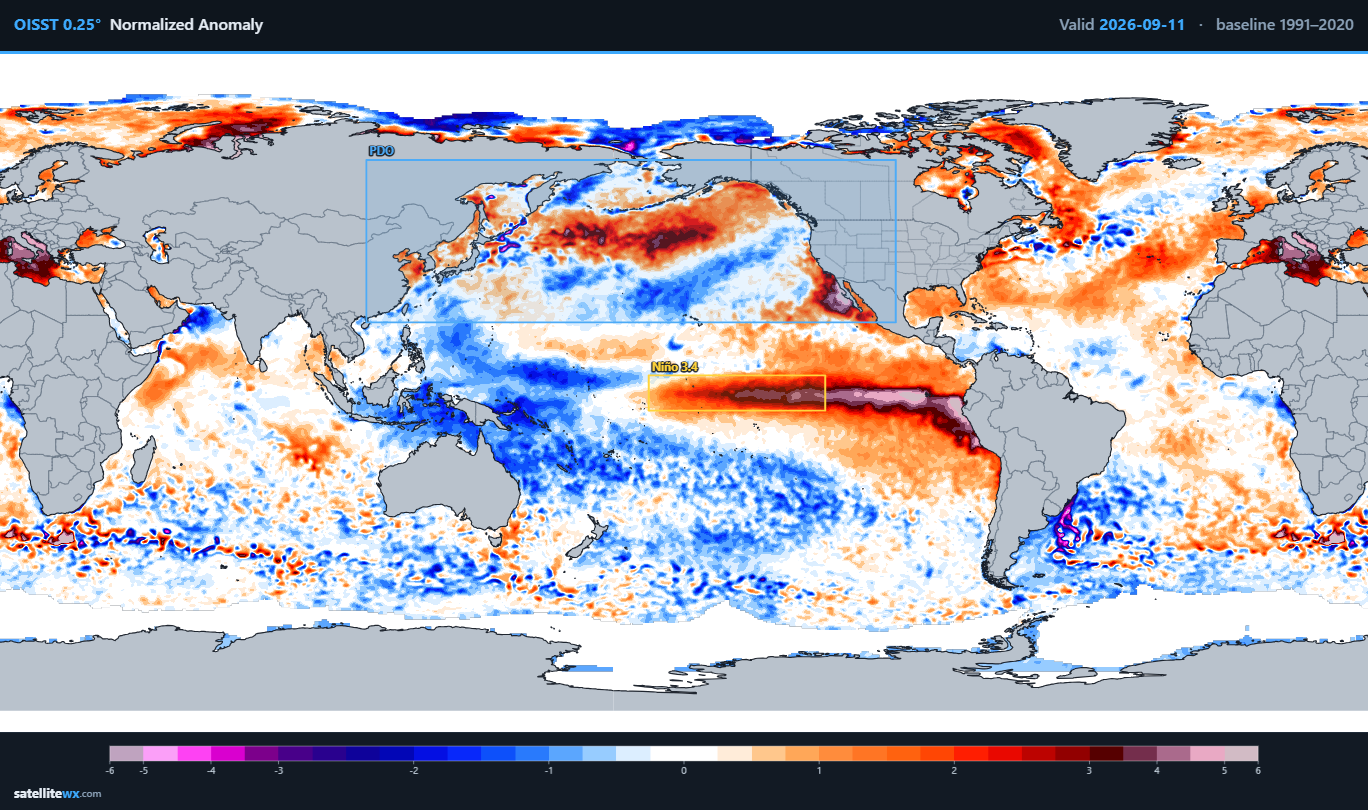
2026-2027 Record-breaking El Nino
Ephesians2 replied to Stormchaserchuck1's topic in Weather Forecasting and Discussion
-
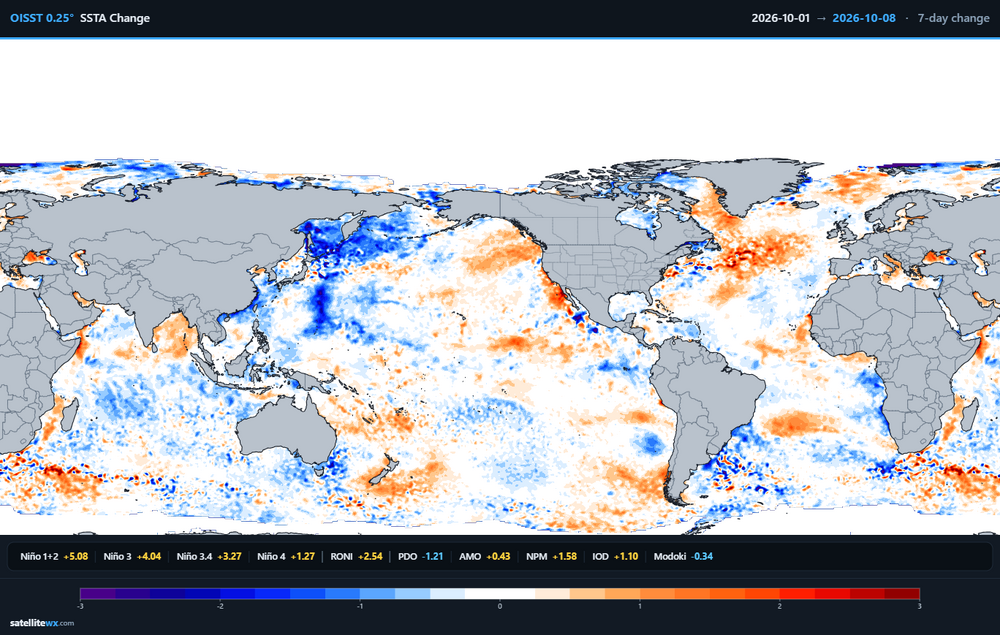
I'll take it.
-
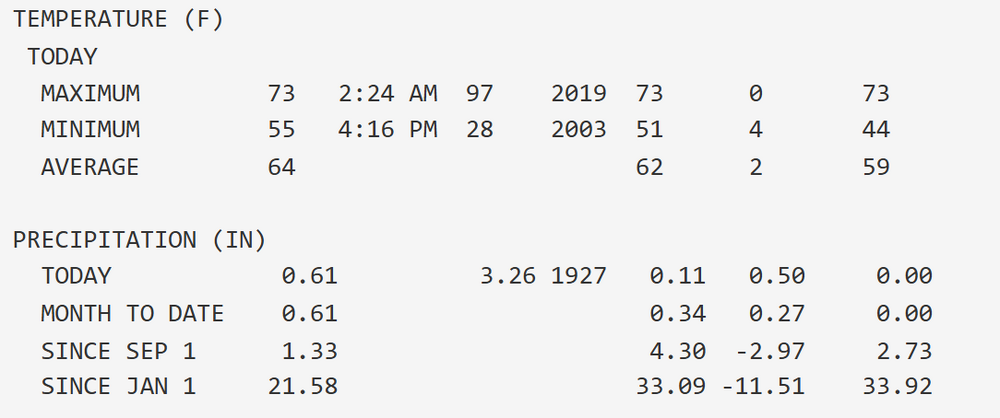
Not off to a good start. NWS forecast for "a half to three quarters of an inch" overnight - actually still completely dry. Month to date precip? 0.3".
-
2026-2027 Record-breaking El Nino
Ephesians2 replied to Stormchaserchuck1's topic in Weather Forecasting and Discussion
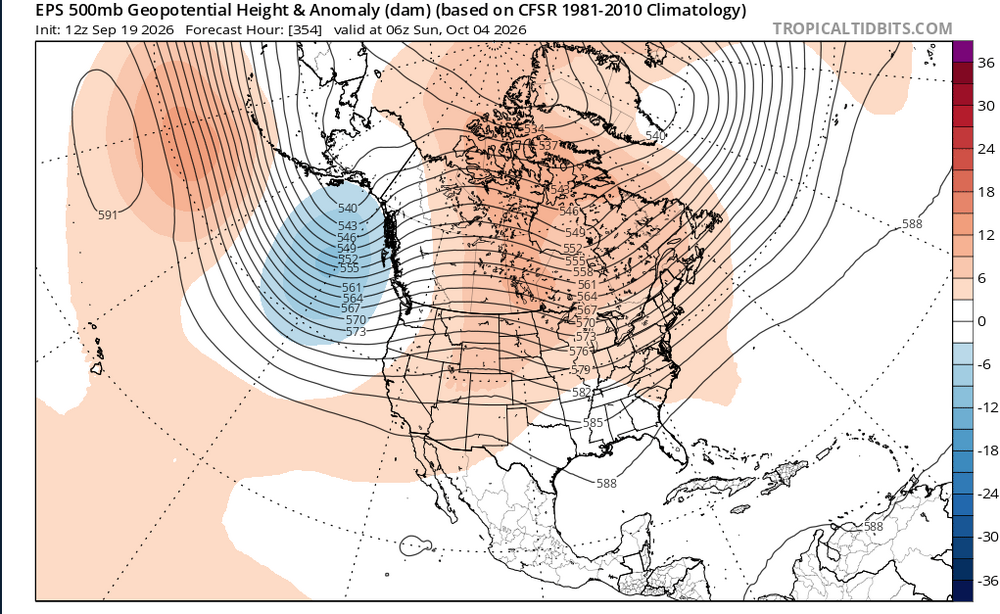
The Eternal Nina of 2016-2026 continues.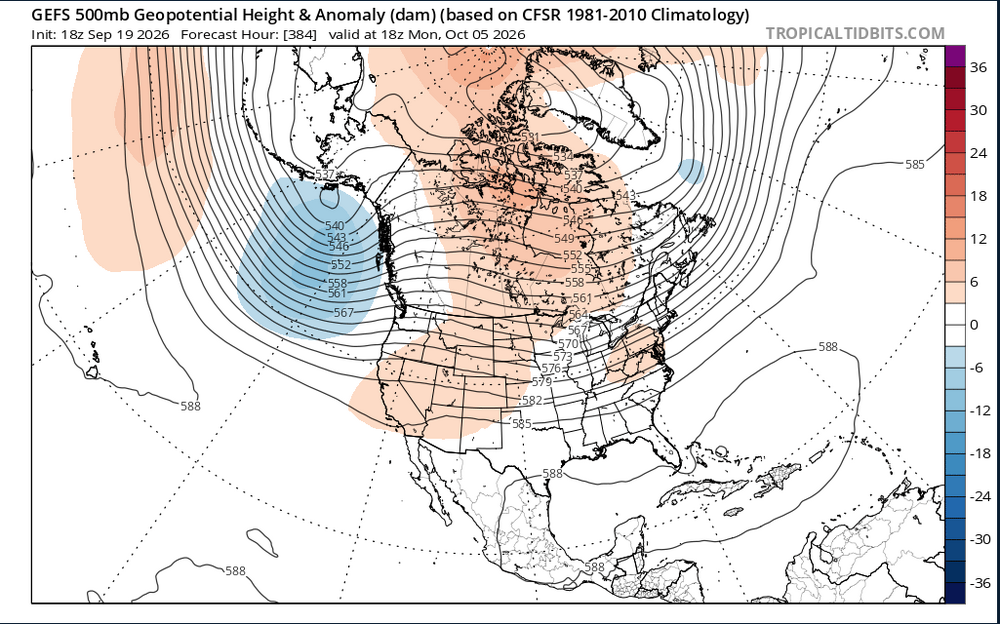
-
2026-2027 Record-breaking El Nino
Ephesians2 replied to Stormchaserchuck1's topic in Weather Forecasting and Discussion
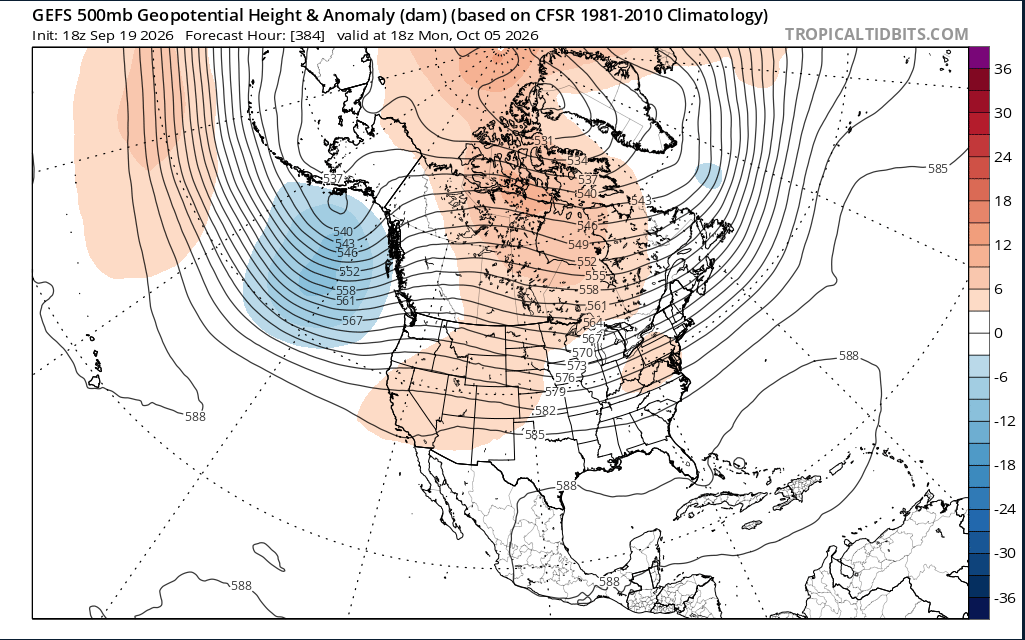
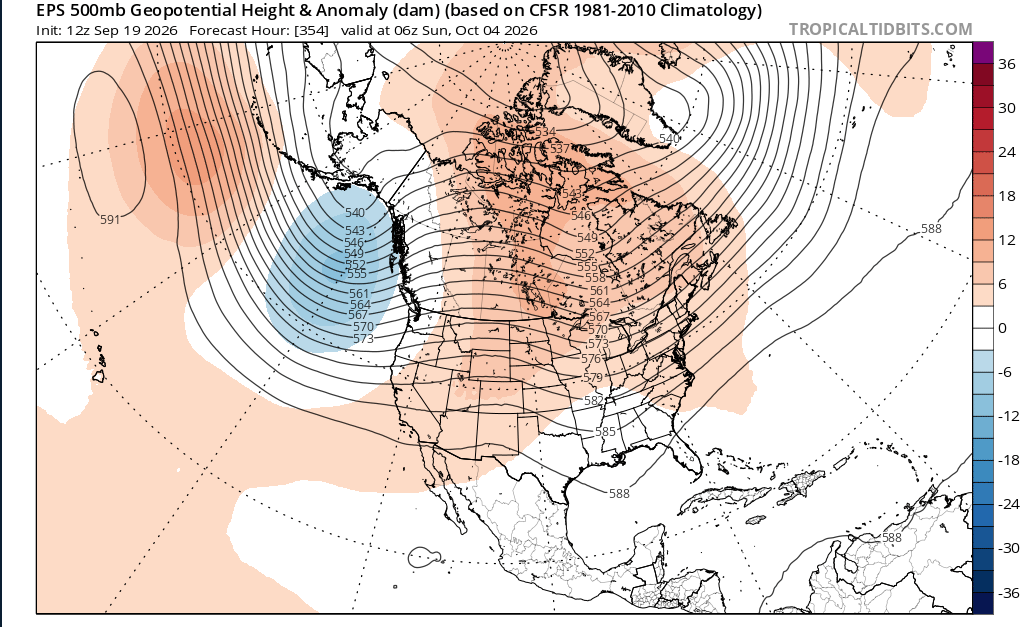
is that ridge south of the aleutians a nino pattern? -
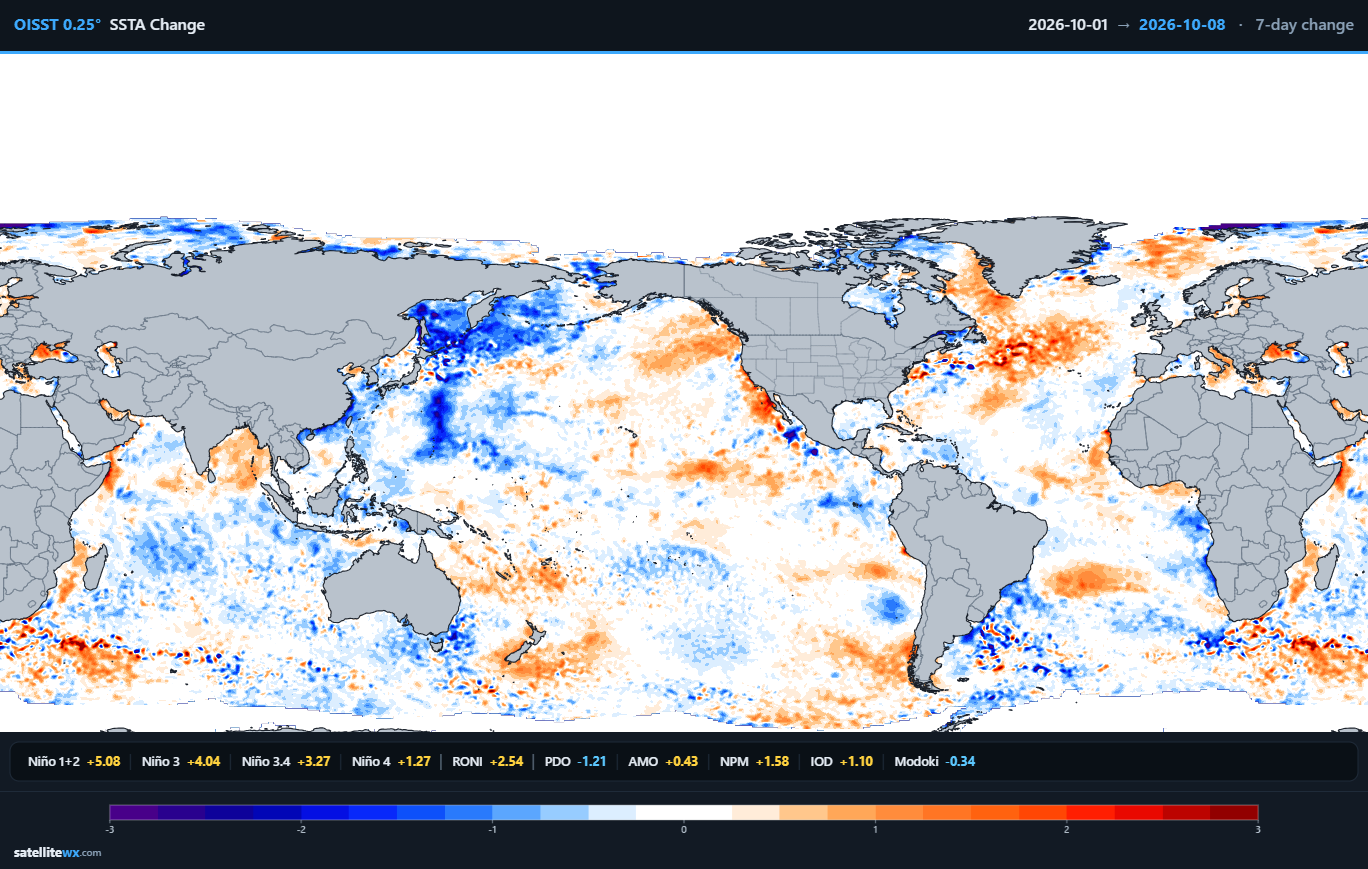
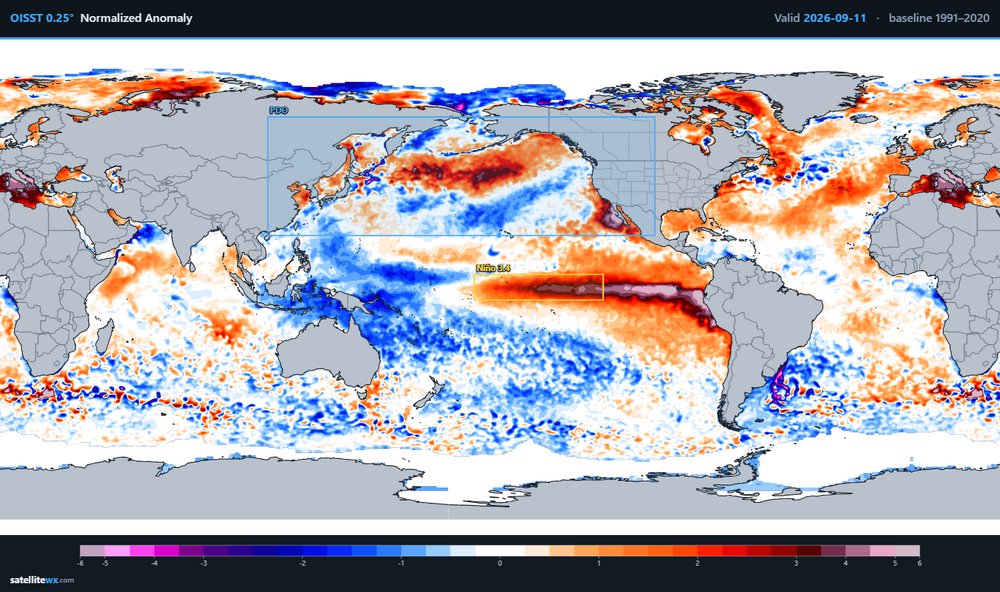
already pretty neutral looking, we'll almost certainly have a positve PDO by November/December. We also got a pretty good pacific pattern the last two winters even with Nina/-PDO
-
2026-2027 Record-breaking El Nino
Ephesians2 replied to Stormchaserchuck1's topic in Weather Forecasting and Discussion
The warm pool definitely isn't as extreme as it was a month ago -
2026-2027 Record-breaking El Nino
Ephesians2 replied to Stormchaserchuck1's topic in Weather Forecasting and Discussion
Not sure what you mean. It's part of the -PDO that has been around for years and was why 2023-24 was so weird. Hopefully we see that warm blob actually break down into the fall. -
2026-2027 Record-breaking El Nino
Ephesians2 replied to Stormchaserchuck1's topic in Weather Forecasting and Discussion
If you really squint you can see the warmth around Japan dissipating a bit -
Is that ridge from NW of Hawaii to Japan normal for a Nino? Or is that due to the PDO and really warm water in that area?
-
Enjoy https://www.instagram.com/reel/DcRGIBvuVJ_/?igsi=MXpwNDJyOTdid3c5
-
2026-2027 Record-breaking El Nino
Ephesians2 replied to Stormchaserchuck1's topic in Weather Forecasting and Discussion
implies a bad Pacific, which I think is more likely than not unless the PDO reverses -
Sorry, I meant underperformed based on what would expect if you were given the 500mb composite in advance, not expectations. Bad patterns were total shutouts and mediocre patterns became bad winters. 2018-19 is the only one that I think "luck" might have been in our favor - the Pacific was awful that year.
-
I think there's been a lot of "bad luck" the last few winters. Relative to what you'd expect with the overall pattern: 2017-18: underperformed (Dec and Jan produced very little for most of the forum) 2018-19: near expected 2020-21: MAJOR underperformance for most of the forum. 2021-22: near expected 2023-24: near expected 2024-25: slightly underperformed 2025-26: underperformed 2016-17, 19-20, and 22-23 were all awful seasonal patterns but you could argue they underperformed because they could have been like 4-8 inch seasonal totals, not total shutouts. Like even 2011-12 had a 7 inch fluke storm down here that missed DC. Hopefully we finally get the flukes to break in our favor this winter.
-
2026-2027 Record-breaking El Nino
Ephesians2 replied to Stormchaserchuck1's topic in Weather Forecasting and Discussion
-
-
2026 Mid-Atlantic Severe Storm General Discussion
Ephesians2 replied to Kmlwx's topic in Mid Atlantic
Charlottesville is the storm magnet this month. Seems like every time I check the radar to see if I am finally getting rain down here, there is a cell over Charlottesville.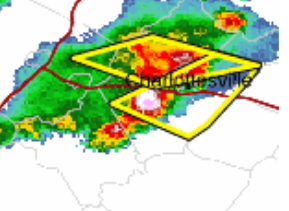
- 2,604 replies
-
- 1
-

-
- severe
- thunderstorms
- (and 7 more)
-
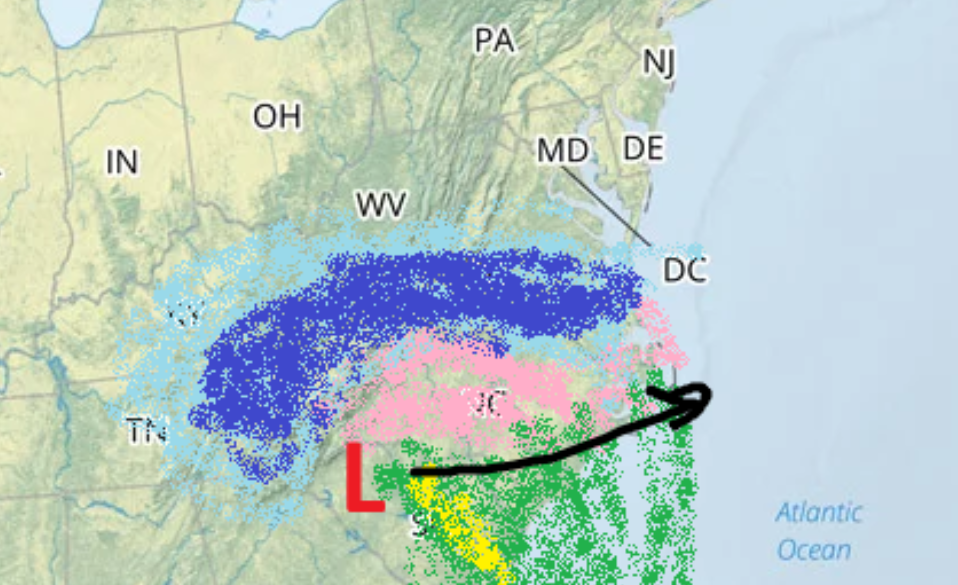
**evil laughter**
-
2026-2027 Record-breaking El Nino
Ephesians2 replied to Stormchaserchuck1's topic in Weather Forecasting and Discussion
2024 was too weak to overcome the nina/-PDO base state. my gut feeling is warm too, but not in the way 2024 was, when we had almost a nina-like pacific pattern. that winter wasn't that wet in the MA/SE either. -
You guys did well in 1997-98 if I recall. I would definitely rather have some elevation this winter.
-
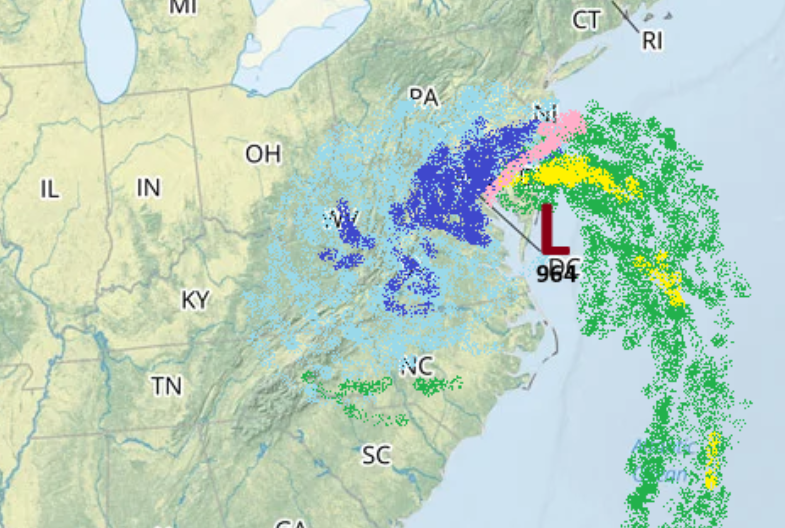
It's coming.
-
2026-2027 Record-breaking El Nino
Ephesians2 replied to Stormchaserchuck1's topic in Weather Forecasting and Discussion
This is literally the same outlook everyone posts on youtube every single year. Not to mention - I'm trying to figure out why the northern plains are "Polar Vortex", the Rockies are snowy, the Midwest is "Arctic Blasts", the southern plains into the southeast is the ever-present "Battle Zone" --- but the mild corner is specifically most of Kansas and Nebraska, a fourth of Iowa, and half of Missouri. What pattern would produce that? I'm not sure. Perhaps somewhere had to be mild.