vortex95
-
Posts
2,209 -
Joined
Content Type
Profiles
Blogs
Forums
American Weather
Media Demo
Store
Gallery
Everything posted by vortex95
-
Augdewst 2026: Summer's Last Stand
vortex95 replied to Prismshine Productions's topic in New England
Sometimes quite localized areas get repeatedly hammered. Looks at just RI, ern MA, an Downeast ME Jan-Feb 2015. It was relentless! But regarding snowstorms and the synoptic scale, the odds of them all just whaling on this small part of New England for 6 weeks? That's pretty incredible, YET it happened! -
Augdewst 2026: Summer's Last Stand
vortex95 replied to Prismshine Productions's topic in New England
You got Edouard instead. Did you weenie out tracking it on radar all night last night, and say, "when is this thing going to intensify!" It took its time and waited until the last min! -
Augdewst 2026: Summer's Last Stand
vortex95 replied to Prismshine Productions's topic in New England
Did you know there is an AWOS at Lake Placid? METARs started a few years ago! https://www.airnav.com/airport/KLKP -
Septorcher 2026 Discussion - Endless Summer
vortex95 replied to Damage In Tolland's topic in New England
I will objectively say, the first part is perhaps the best I have ever seen when it comes to an "VOR" approach. First, how quickly the tor intensified. Second, inflow "swirlies" well beyond the condensation funnel, and third, the radial inflow sfc jets apparent ("ghost train") apparent that can do wicked damage outside the condensation base. As @CoastalWx would say, "VIOLENTLY BEAUTIFUL!" -
Septorcher 2026 Discussion - Endless Summer
vortex95 replied to Damage In Tolland's topic in New England
@CoastalWx had a similar experience and was like this guy A wicked close strike hit the utility pole just outside when he lived in Dorchester, and he got shocked while he was on his PC (probably browsing AmrWx!). He was quite in shock and awe (couldn't stop talking about it when it came into work). And then the utility pole would not stop arcing! -
Septorcher 2026 Discussion - Endless Summer
vortex95 replied to Damage In Tolland's topic in New England
Really? That time it was coming into your basement when you lived in Dorchester, you were not thrilled! -
Septorcher 2026 Discussion - Endless Summer
vortex95 replied to Damage In Tolland's topic in New England
This is more appropriate. Scott can WOO WOO for a big winter! LOL. -
Septorcher 2026 Discussion - Endless Summer
vortex95 replied to Damage In Tolland's topic in New England
-
Septorcher 2026 Discussion - Endless Summer
vortex95 replied to Damage In Tolland's topic in New England
-
Wow, I did realize this record was sneaking up us, but we are now in Sep. And I did not realize that 3 of the top 7 had occurred since 2001. 4th place is assured. And even the "TC happy in the long-range" GFS shows nothing of significant in the next 10 days, so we may break the record. These kind of tidbit post w/ link that was provided above are great b/c it's hard to keep up w/ everything these days (don't assume everyone already knows!), and CSU is outstanding for TC info. I correspond w/ Klotzbach at times and he is excellent -- just provides the hard TC stats in his posts w/ no bells and whistles! Here is the CSU site w/ tons of stats present and past! Excellent info here. https://tropical.atmos.colostate.edu/Realtime/
-
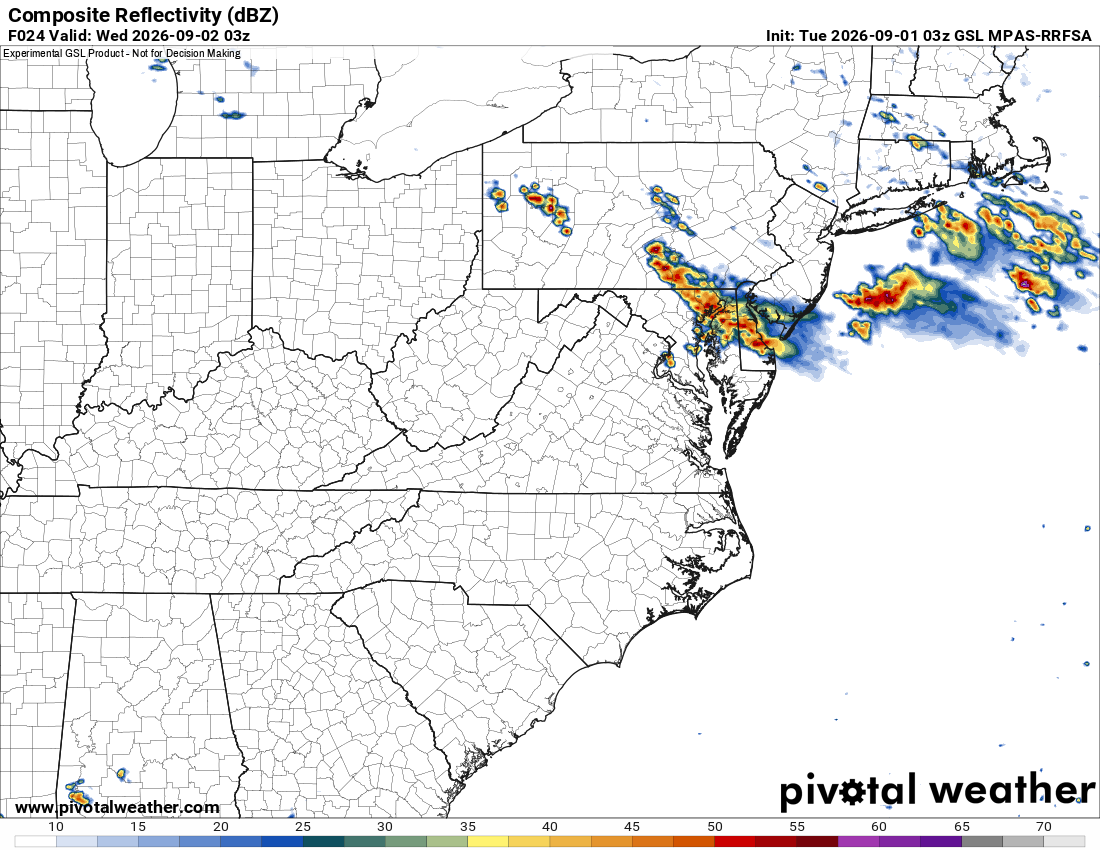
Around 8pm this evening looking N from the N side of the Beltway, I could see robust ACCAS, almost MDT CU. So there is your elevated instability in place. RRFS MPAS suggest a few cells may form in the DC area the next few hrs (DCA already reporting LTGIC NE), and we have those storms in the far nrn Delmarva w/ a distinct OFB. The EIR sat loop is impressive. Look at the backbuilding and sharp cloud temp gradient in far NE MD. NW flow is neat! Got this loop from here. Nice sector for the region! https://whirlwind.aos.wisc.edu/~wxp/goes16/ircm/goes16_ne_3h.html hanimate.mp4
- 2,604 replies
-
- 2
-

-
- severe
- thunderstorms
- (and 7 more)
-
Yes, look at different radar and elevations, there is more than one circulation present.
-
Yes, like an ERC when it finishes and the sig intensification can occur again, Just the dry slot gap N and E makes this process less likely here.
-
The odd reason is two things, hype for clicks/like, and as I have said before, esp. when it comes to satellite and cold clouds tops, some just "see at the trees w/o seeing the forest." The question you have to ask, is that developing deep convection banded or showing twist, esp near the center? If not, that means you have to temper your expectations at first. Many times a big blow up of convection collapses almost as fast, as one example, and irregular blobs of convection for a TC are not conducive to RI. One large coherent blob is ok, esp. if it persists, b/c that often is a sign of a developing CDO.
-
Look at the latest radar, it seems the small inner "eyewall" has almost dissipated like in an ERC and you have a larger center taken over. But even that larger center is not closed off w/ precip and looks like a fairly strong dry slot is wrapping in. Look like it is coming in from the SE, and we had the increase in shear apparent from the ESE earlier this morning, so that may be pushing the dry air into the core.
-
I think the it is a case of "modelization"as I like to call it. Too much reliance on models. Yes, modelling has come a long way, and the HAFS has shown excellent skill since it was operational 2 years ago, but you can't assume it always will do a good job, and you have to actually look at hard observation data first and foremost, and when that contradicts a model, the path is clear you need to adjust your fcst and messaging. I have notice close to a landfall, NHC rarely backs off on wording they have prior b/c they do not want the public to let their guard down. But this promotes the "cry wolf" problem b/c the threat is overstated and not adjusted for reality, Our in situ and remote observations have come so far and better than ever, yet we still seem to cling to "better safe than sorry" or "err on the side of caution." Overdoing it has real costs, like economic for business and commerce and the cost or evacuations and preparations in general. So it is in our best interest to try to fine tune our forecasts more and take advantage of all our advances, and I get the impression we are not doing that fully, at least not w/ the messaging when it comes to certain TC situations.
-
Exactly! And it is why my posts have been they way they have been since last night. Not being a negative Nancy, just see thing for what they are. The signs of RI are just not there, and those signs are not subtle (data rich area Edouard is in, so higher confidence what exactly is going on w/ the storm over time). And you see what recon just found, despite sat looking better, and radar looking *much* better. If you just showed me a radar of Edouard now in a vacuum, I would say, "that's probably a strong TS or min HU w/ that kind of banding and a partial eyewall!" And yet NHC just stays the course on the 12z update stating RI is imminent. Sometimes they prioritize consistent messaging over what is actually happening evolving in real time, just not to confuse the public. I can get that, but it really not being 100% truthful IMHO, and we all see the same data, so there are going to be some that call NHC out unprofessionally on social media for clicks and likes, among other things. So that's the flip side of not changing messaging as the event evolves -- it invokes criticism that in this case is legit. Even when it is not legit, that still presents challenges on a PR and overall perception level.
-
It does look better, but sat and radar show it filling in primarily in its outer bands, the inner core is not solid rain w/ dry slots present, and the center ring is not closed off. The blob nature of the developing convection is not a sign of imminent RI IMHO. 88D winds from LCH 4-5k ft show winds no higher than 50 mph, so even though I bet the pressure is now 998-1000 mb, the winds have not responded much yet.
-
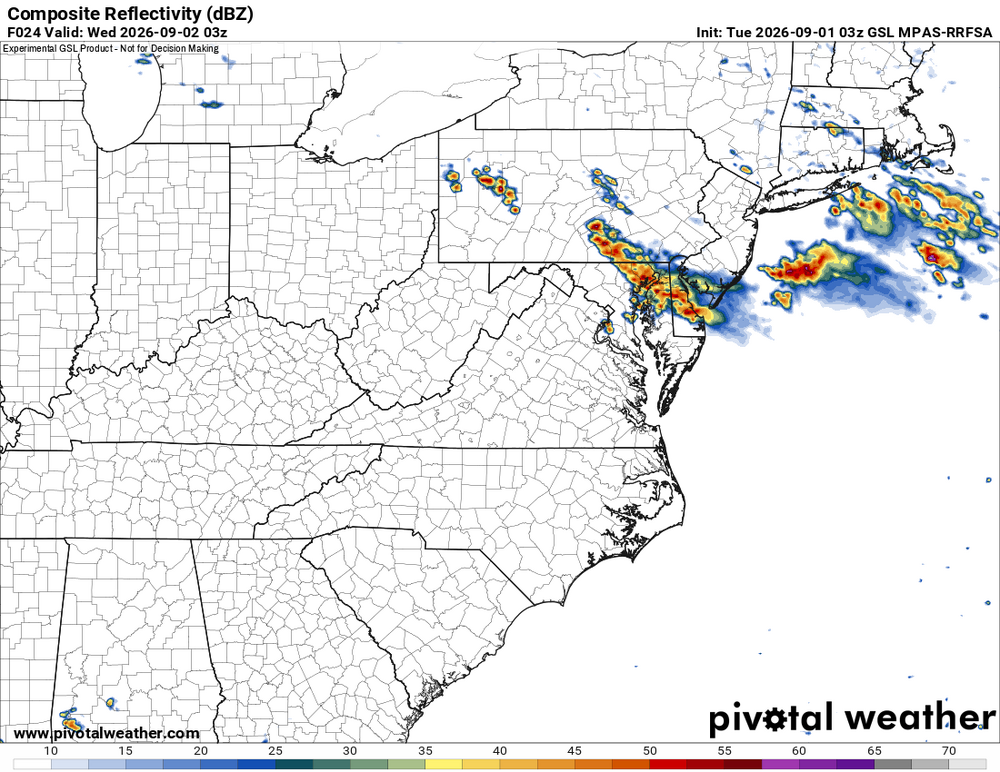
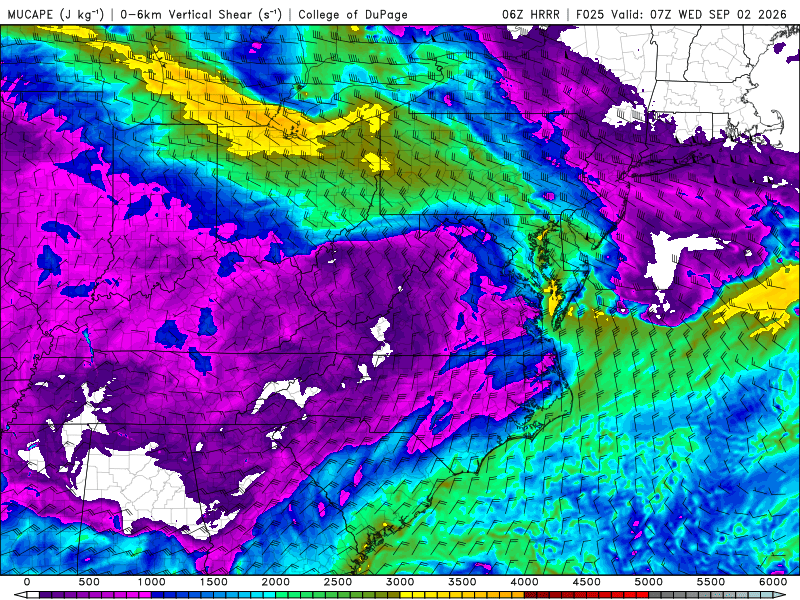
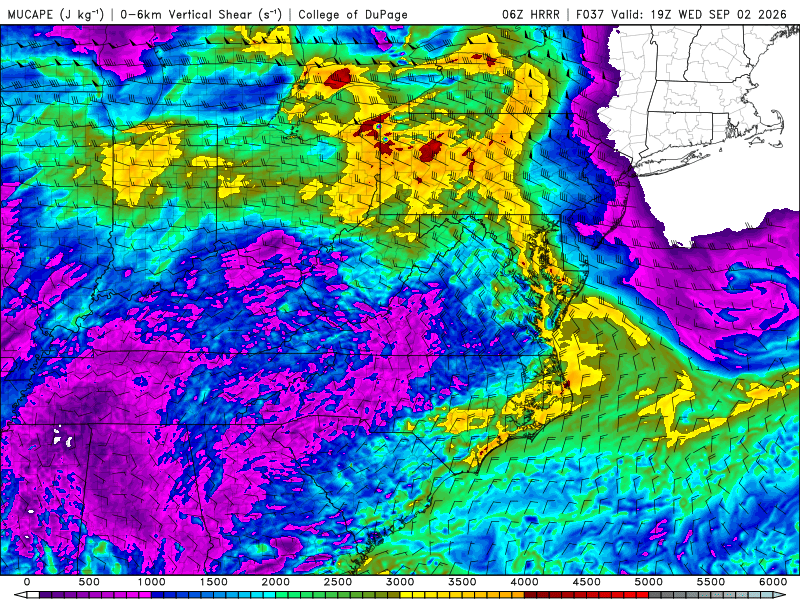
It appears today will remain capped. HRRR and RRFS have next to nothing. 700 temps warm from around 8C at 06z to 11 C by 00z and 1000-500 thk gets to 580, so that should cap things off. However, some nocturnal action appears possible as the BDF approaches from the NE. The RRFS MPAS looks impressive at 03z. It is on its own, but look at the MUCAPE axis on the HRRR at 07z Wed. And Wed aftn looks good w/ the front NNW to SSE across the areas. Surprised SPC does not have at least 2% tor risk in the area.
- 2,604 replies
-
- 2
-
-
- severe
- thunderstorms
- (and 7 more)
-
Monday, August 31 - Thursday, September 3, 2026 Convective Episodes
vortex95 replied to weatherwiz's topic in New England
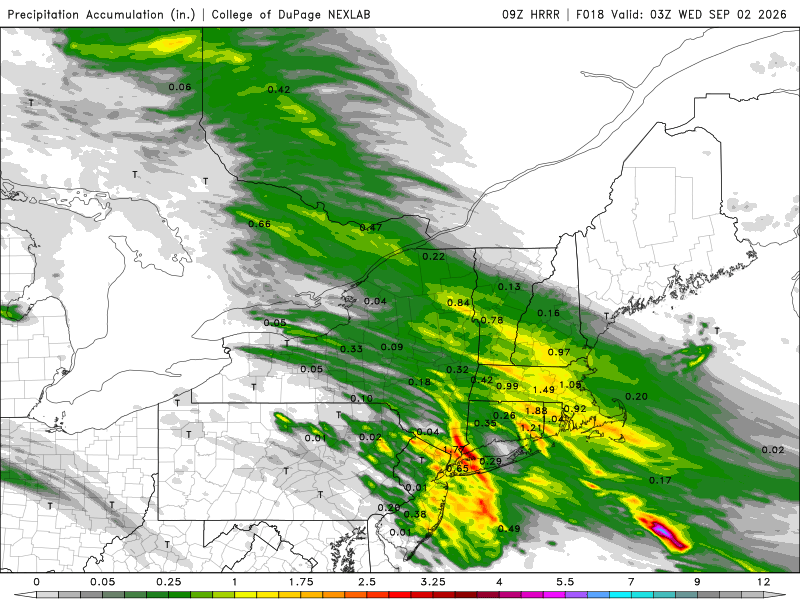
Swrn CT...again!!! Scott mad....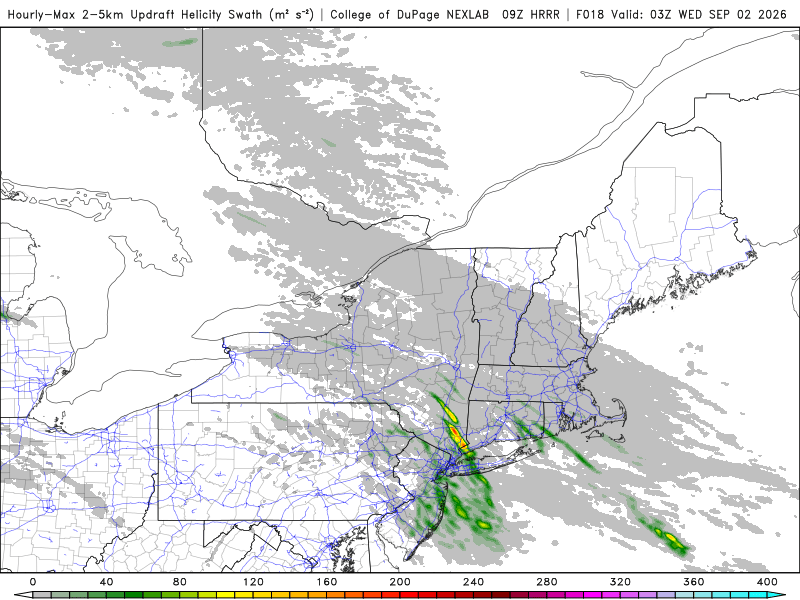
-
So much what was said in that post could have easily been condensed down to !~25% of its original and still said the same thing!
-
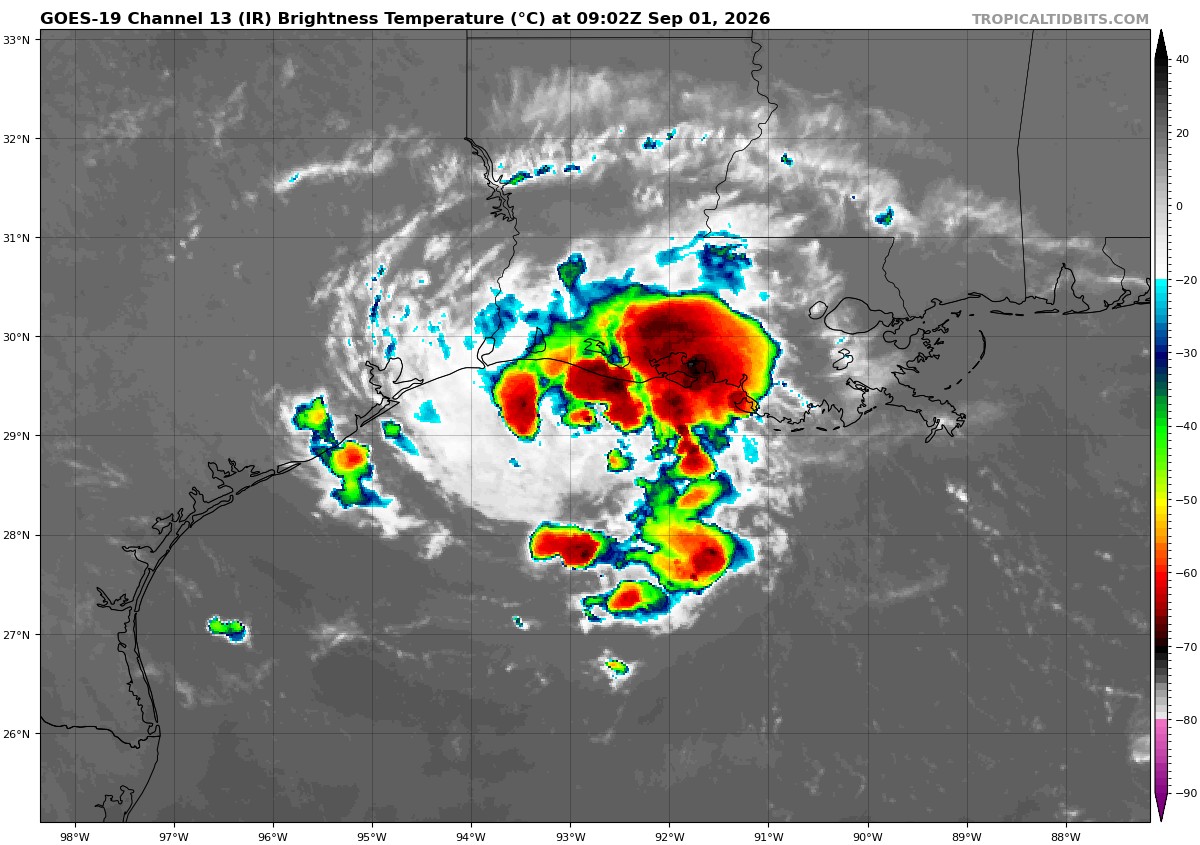
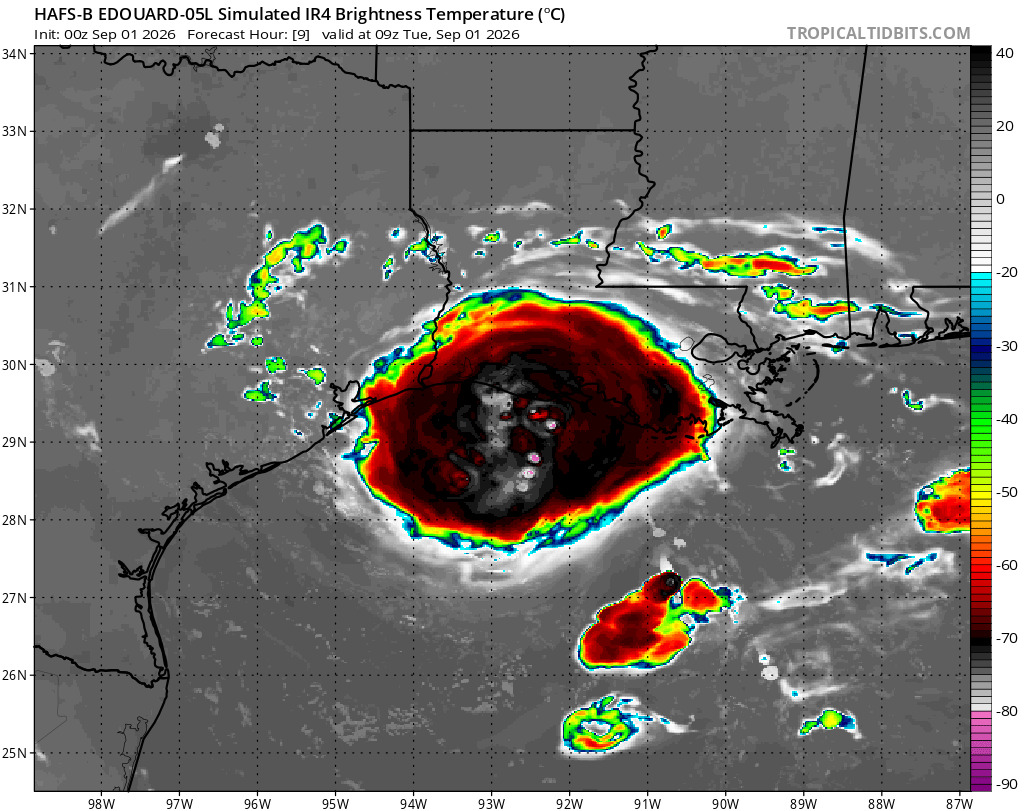
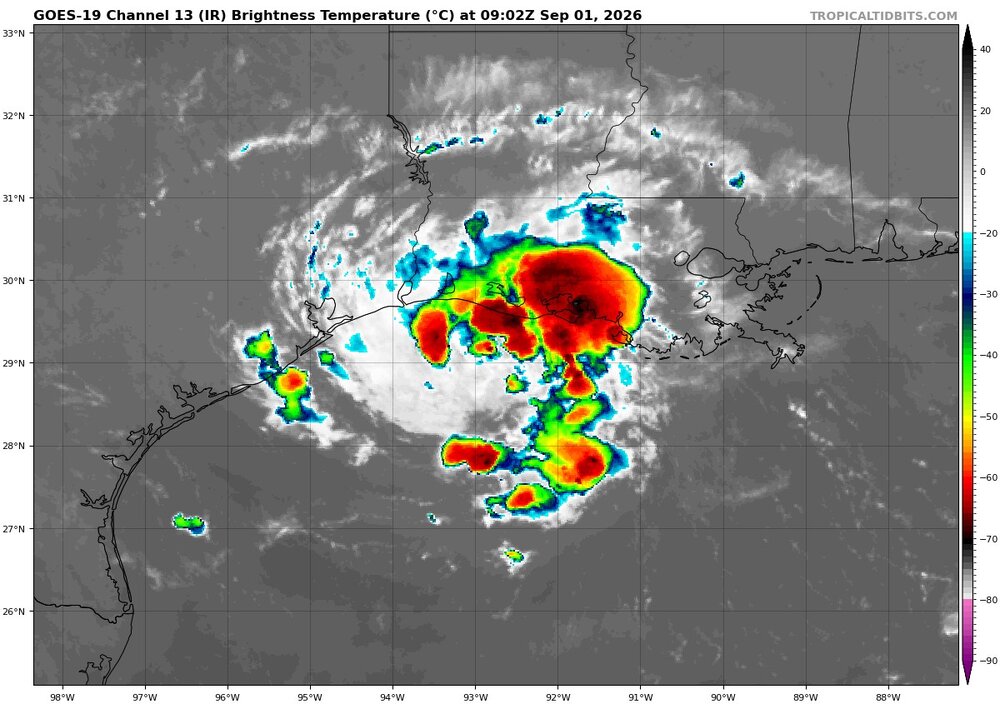
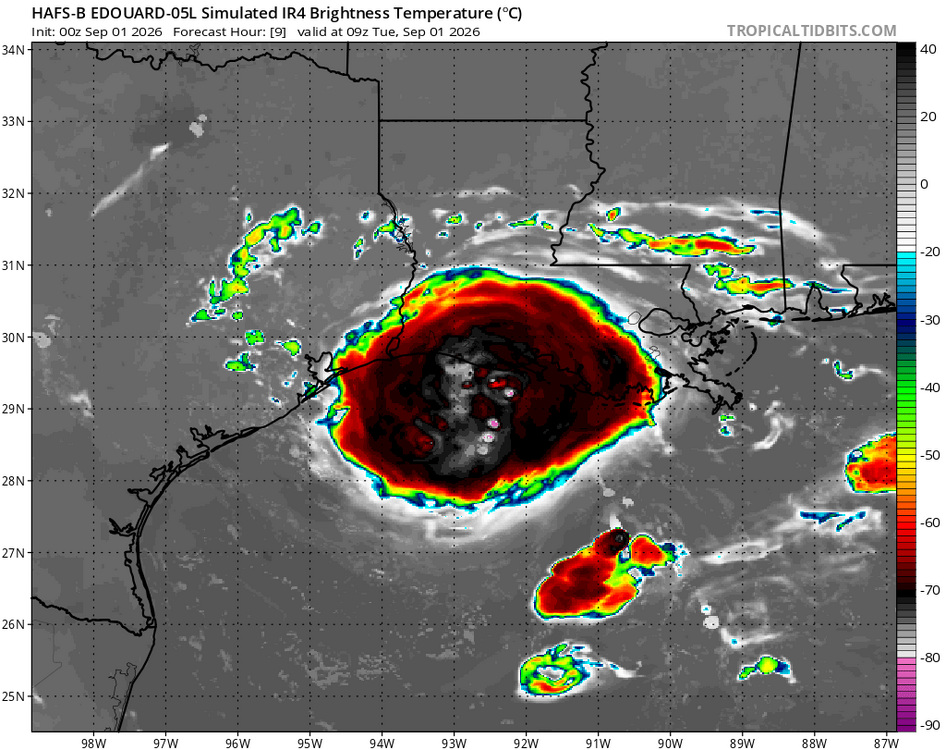
NHC follows the 00z HAFS-B, but here is the current 09z EIR, and the fcst EIR valid 09z from the HAFS-B. This I find a problem often the days, some stick to the model fcst and persist in not altering at all a fcst when the model is already wrong in its short-term verification. That's not good. Objectivity, the HAFS-B is quite wrong here for satellite presentation. Now I know that does not mean RI is off the table, but one just can't ignore the model shortcomings here and still stay the course on an earlier fcst. And NHC mentioned nothing about the ESE shear I pointed out earlier that was apparent on satellite, or the low environmental RH that persists, or how earlier more banded convection is now becoming more irregular (blobs). These are non-trivial observations as to what is going on real-time. Actual empirical observations override any model fcst every time.
-
I'm sorry, but IMHO the quoted post from another site @GaWx posted says a lot w/o saying much. To me, it seems like ChatGPT output that is tweaked and adjusted manually here and there to make it look like less AI or just explains the idealized TC intensification process. This statement is a red flag as to Edouard's state now: "Edouard is simply spending its energy aligning its low-level and mid-level circulation centers rather than fueling vertical updrafts" The environmental shear is low, so the low and mid-level vortex, how can they align in the first place? Yes there is some light shear, but not enough to make the vortex tilted in any meaningful way. Yes, the convection on the N side, but it is not sheared convection, it is more circular banding, and convection lacking in the S quad is due to dry air entrainment primarily. And a TC does not "spend energy" aligning a low and mid-level vortex. Oh it can fight off shear w/ repeated convective pulsing, but the shear needs to relax for real solid organization to take place most of the time. The environmental shear dominates, not the TC, esp. in nascent stages. "This is not land proximity or dry air entrainment (WV would show this)." Um, yes it is, at least for dry air entraiment. WV *does* show this, and so does the SHIPS output for 700-500 environmental RH (it is 42% at 06z (that's down from 48% at 00z). https://hurricanes.ral.ucar.edu/realtime/plots/northatlantic/2026/al052026/stext/26090106AL0526_ships.txt Also, look at the convection on the N and E side now, it pulsing up quickly in irregular blobs. I think that is due to some ESE shear impacting the system, as I noted in a previous post, and shear will make dry air entrainment easier. Land proximity is not too much of a big deal, not when that land is flat. If the environmental conditions are ideal, then it does not matter, Look what Michael did in Oct 2018 right up to the last minute and Charley in Aug 2004. Prolixity to land matters most when high mountains are present, like Hispaniola or Taiwan. You can get dry air downsoping that messes w/ the TC and its outer circulation disrupted, leading to some odd eye tracks/wobbles (Taiwan is famous for this). I think Edouard is slowly improving in organization overall. Environmental conditions are not overly hostile, but not that good either, so what we are seeing is to be about expected. And going back to the other site's post, I find it unnecessarily complex/technical, and as @GaWx said "I won't pretend to understand fully." What does that tell you? IMHO, mets that post practical and straightforward info, infused some more advanced stuff, but able to connect it to operational meteorology w/o making the avg met or wx enthusiast confused, is what to look for. Some ppl try to impress w/ a lot of tech talk and that convince others that "they must know what they are talking about!" So beware! It's good that the other site post was posted here for cross-examination. There are a lot of wx hustlers, armchairs mets, or ppl that just have more to learn. I have seen plenty and can spot them a mile away.
-
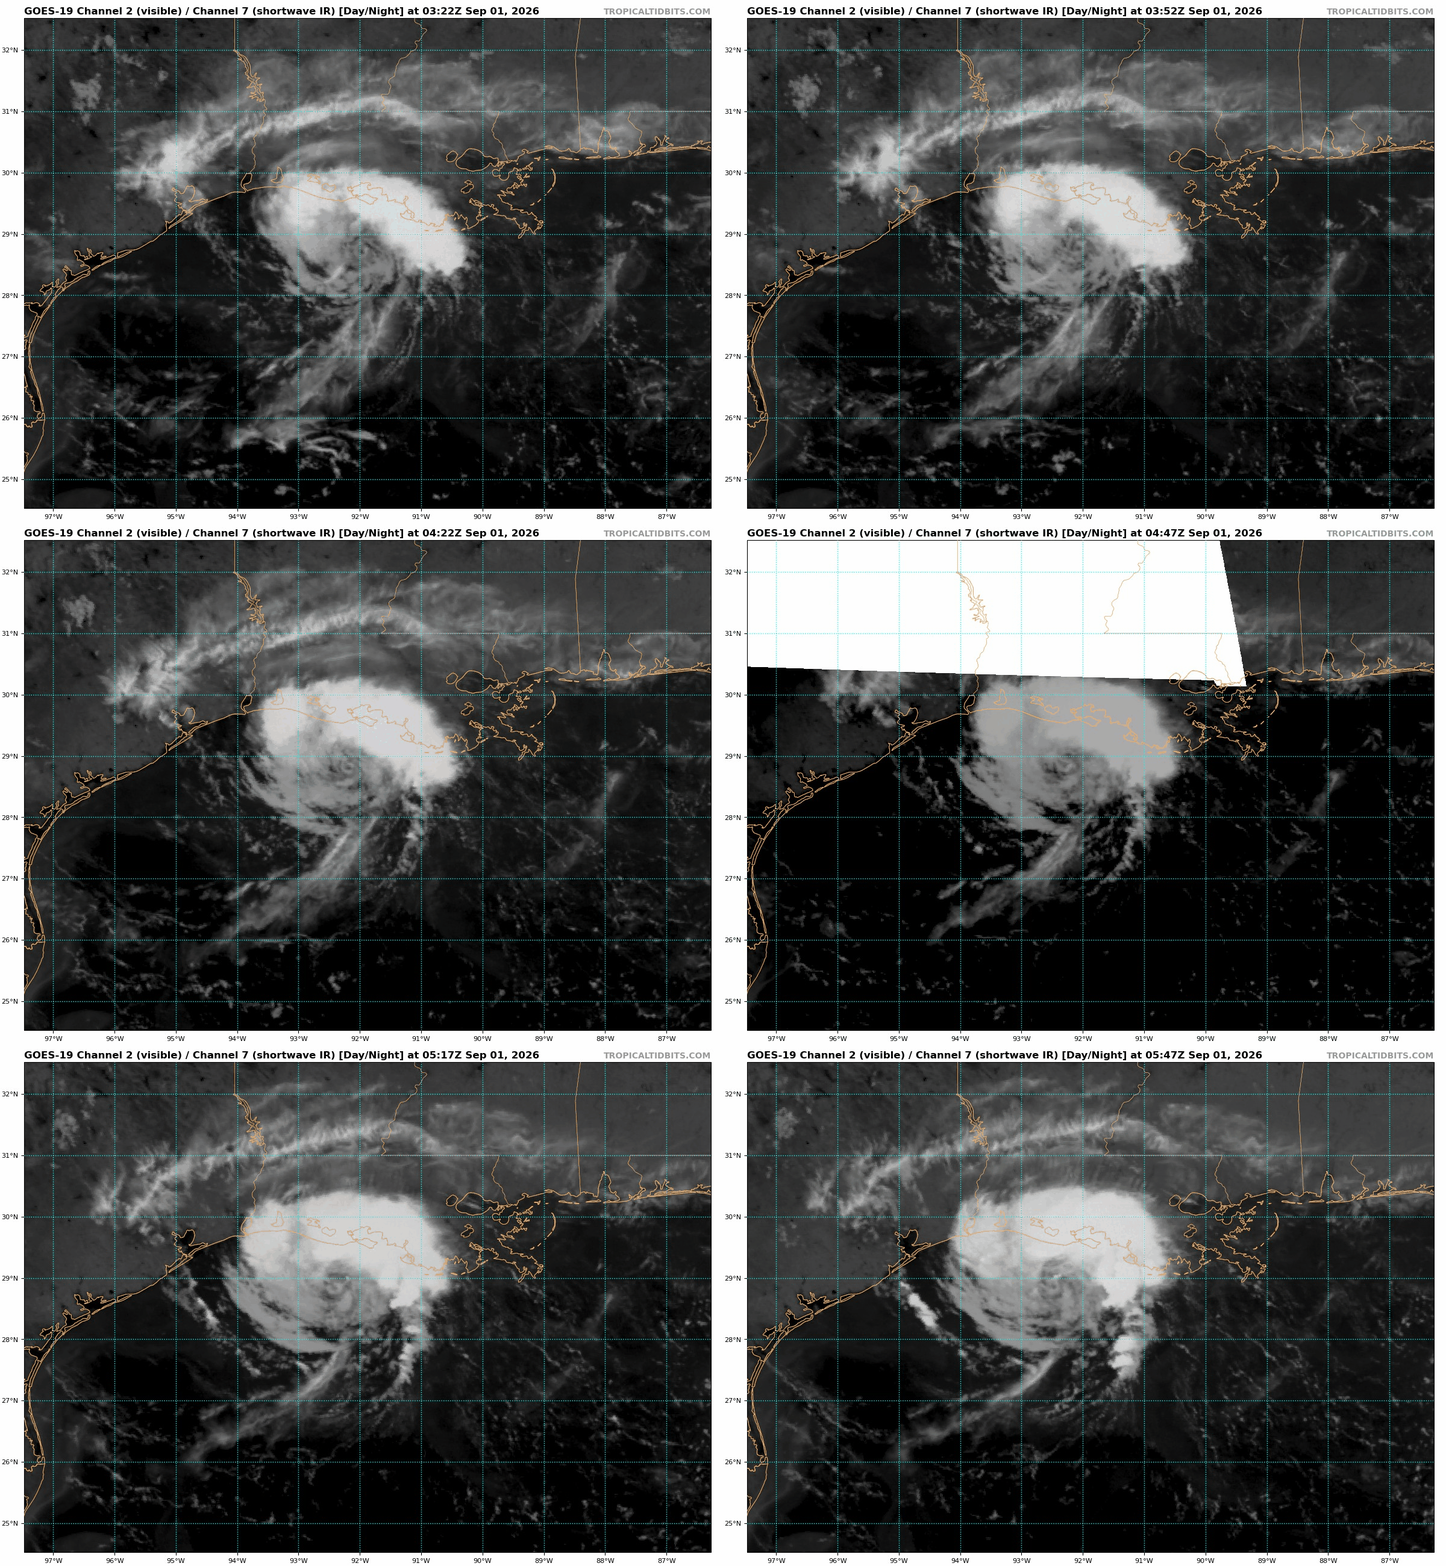
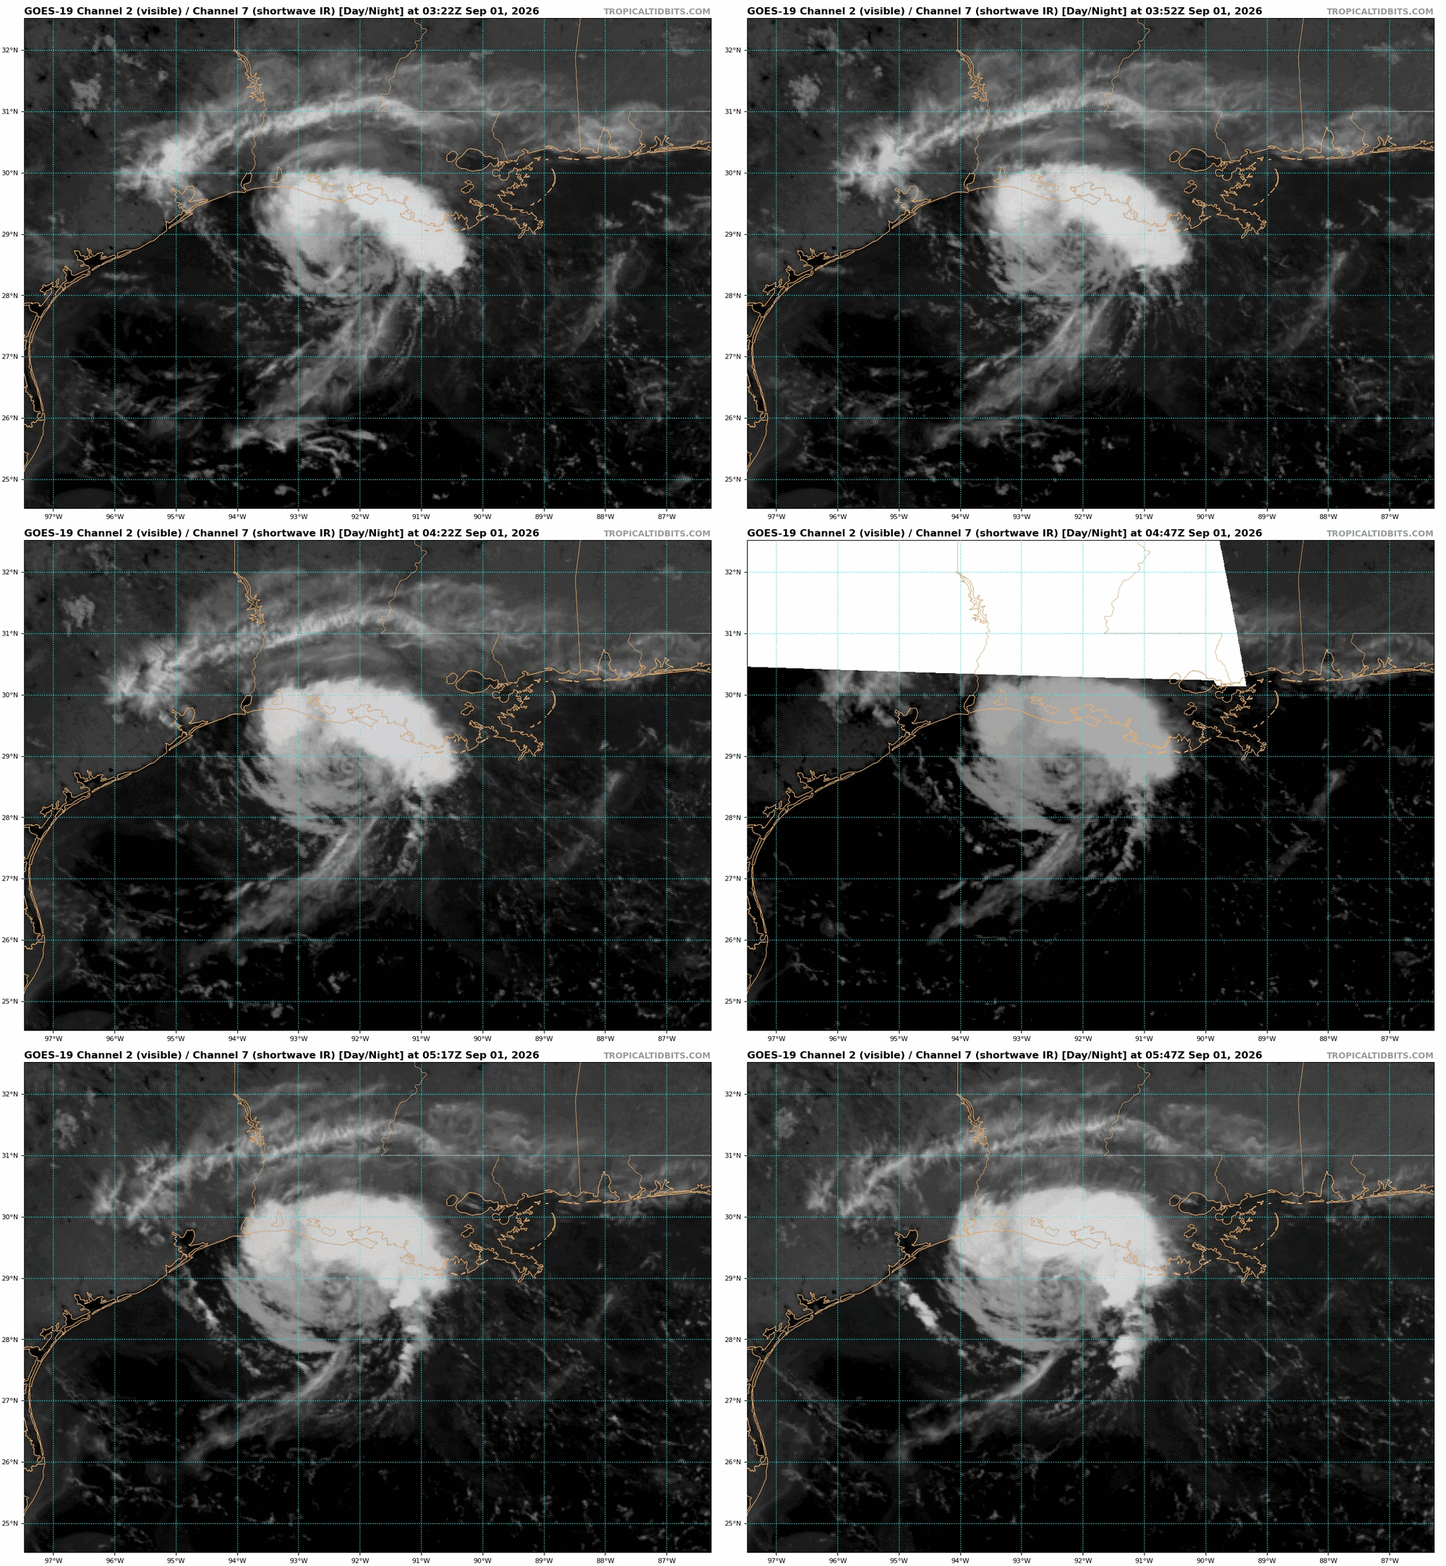
Here's something that I find very interesting I just noticed, and can't recall seeing or noticing this before. We know the shear is low overall, but look at the SWIR loop (channel can see LLCC better at night). Notice over the LLCC two tiny quick flares of convection shearing off to the NNE. So it appears there is some kind shear present, and given all the deep convection is on the N side, that makes sense there is some southerly shear present!. Also, on the SE side of the storm, look at the line of cirrus moving steadily WNW, faster than the storm is moving. Also, the convective band SE quad has it anvils shearing WNW. So this indicates some ESE shear impinging on the storm as well (different level?). For a TC of avg or large size, or one that was already strong, such shear would likely be brushed off and not a factor, but for a small, weak TC? This is what I meant about how sensitive small TCs can be to even subtle factors/changes in the environment. And all this analysis above is of value. First, as I noted I can't recall seem such localized shear over a LLCC like this when environmental is shear is low, so I add that to my TC analysts skill, and second, you can see how the finer details here can tell you a lot for nowcasting and have big implications to one's fcst thought process!
-
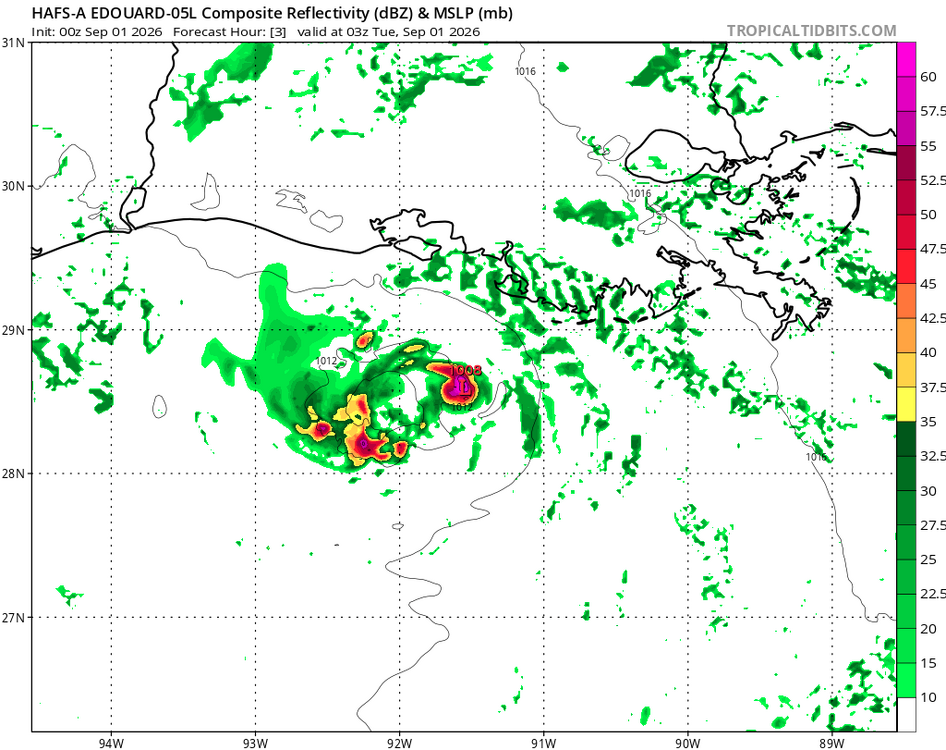
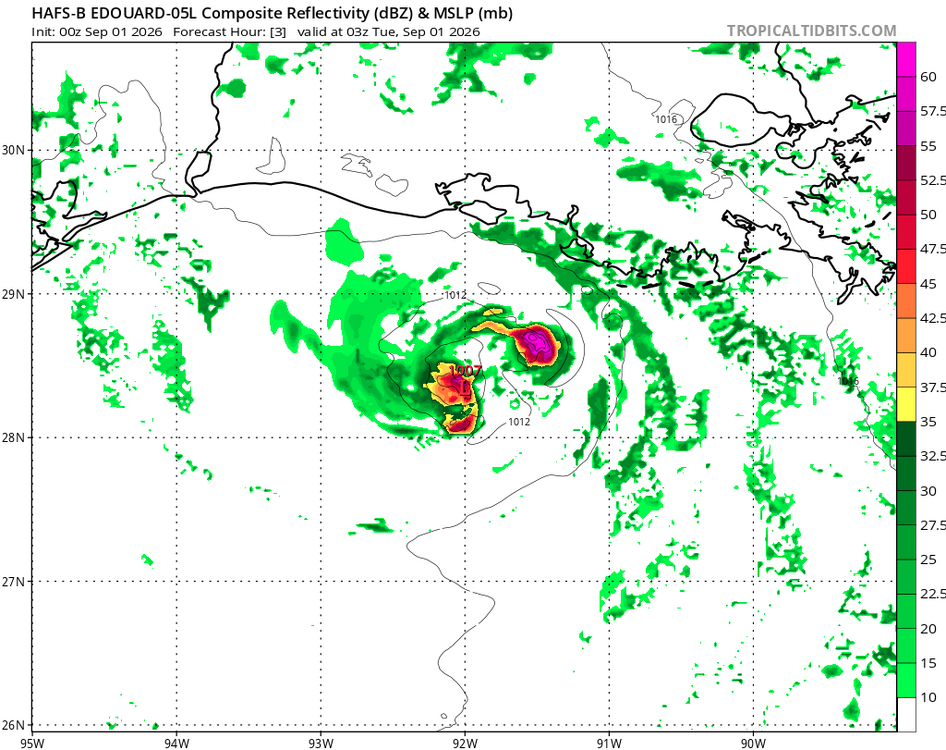
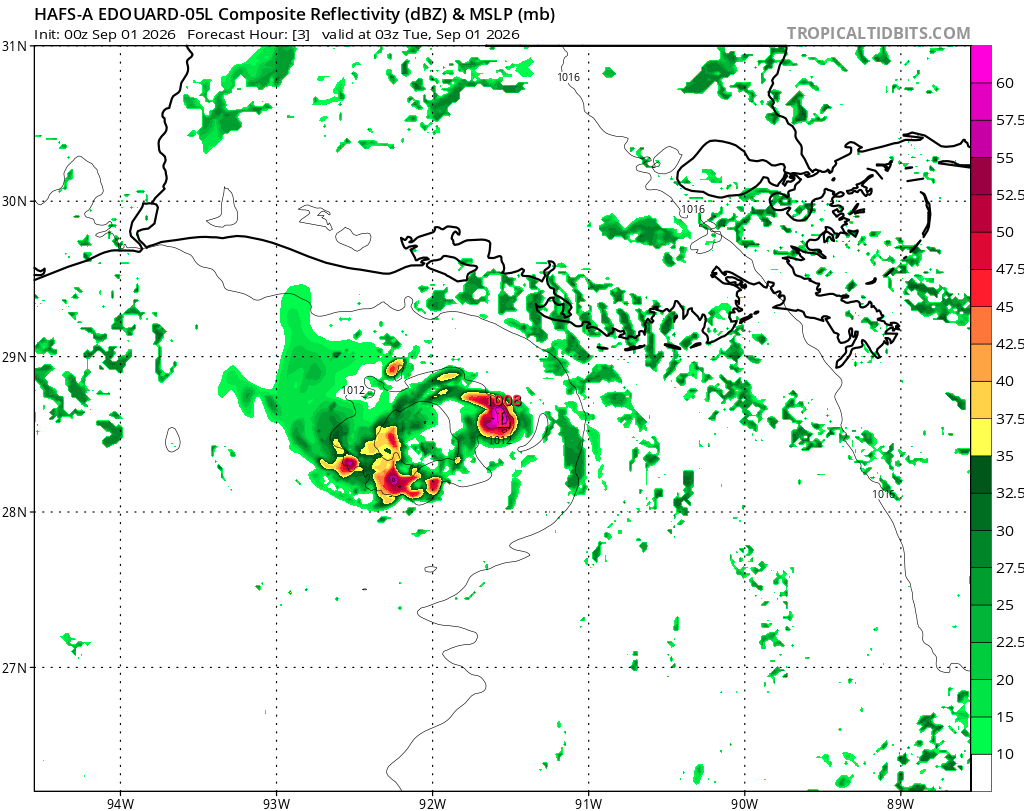
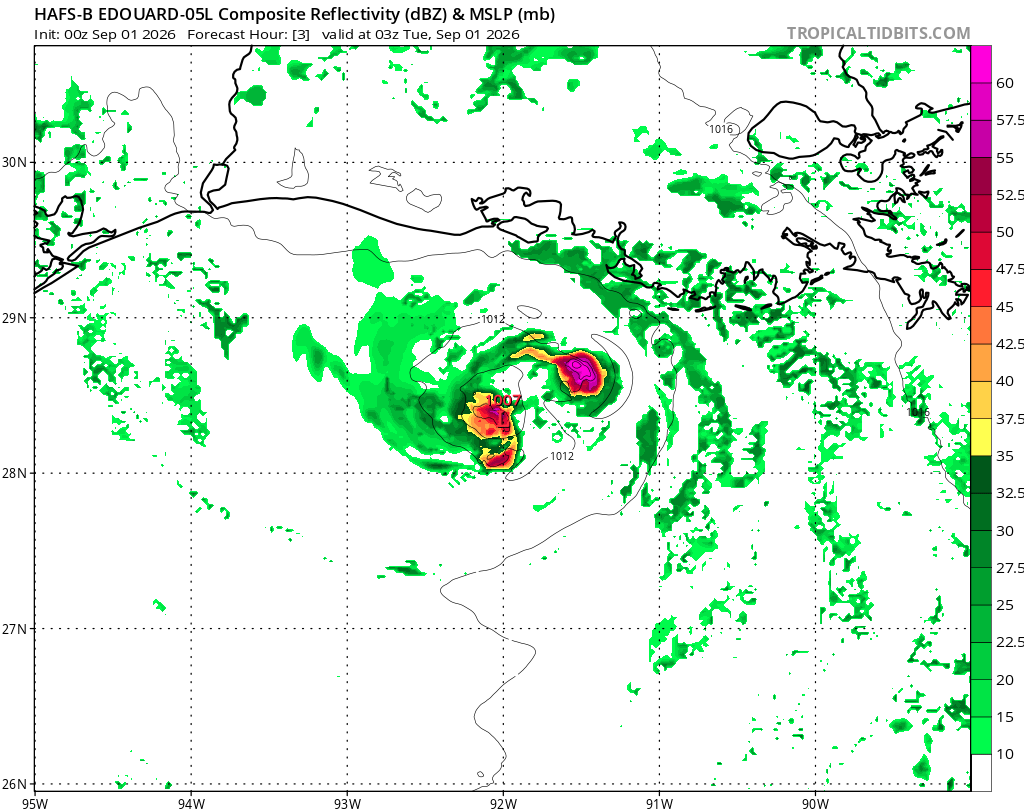
It appears HAFS-A/B are in error b/c they both show strong convection right over the LLCC 03 and 06z, and this is resulting in feedback. I attached the fcst hr 3 valid 03z from the HAFS-A/B. That did not verify. Also, the strong N side convective band on sat we see now is not handled well. So their later fcst hours are questionable. These small differences in initialization when dealing w/ convection and structure can result in large errors. The HAFS is known to do a great job, but tiny TCs like that are not common, and I don't have a feel for their performance in such cases. It is tempting to be impressed by the hires models now, but they can give very realistic and precise-looking output that can be precisely wrong. No change in in winds or pressure last recon pass 0444z. So I and hesitant on RI still. Sometimes, I go to myself, "prove it to me!" that X can happen, and sometimes I am proven wrong! But I try to not let "just b/c the models say so" or "NHC says this" influence independent judgement and gut in forecasting. Doing very short-term "what has happened up until now and trends" and what is current -- that I put more weight towards. Edouard's case is almost like what convection will do during a big svr day fcst, and you know how fickle and uncertain that can be!