gymengineer
-
Posts
3,363 -
Joined
-
Last visited
Content Type
Profiles
Blogs
Forums
American Weather
Media Demo
Store
Gallery
Everything posted by gymengineer
-
Charleston at 9+ ft above MLLW about half an hour ahead of high tide: https://tidesandcurrents.noaa.gov/map/index.html?id=8665530 This event could slip between Matthew and Irma for #4.
-
Time sensitive- but it’s fascinating to me that one of the planes’ sole flight pattern for the past couple of hours is to find winds- and maybe pressure, which it did find- to justify an 11 pm upgrade to Major Hurricane status. Meanwhile the other one is doing “normal” geographical sweeps through quadrants.
-
Whoops, glanced too quick. Thanks for pointing that out!
-
Two things that make Idalia seem ominous: 1) The forecast track adjustments for multiple advisories in a row is heading toward the biggest population centers, not away (e.g. Irma away from Miami, and at the end, Ian away from Tampa Bay). One more eastward adjustment brings landfall to Cedar Key, and that track change plus any increase in intensity forecast would send the 5-8’ storm surge zone to include Tampa Bay. 2) There was so much more notice for Ian and especially Irma (Cat 5 monster days away). Tuesday night, Idalia will be at the latitude of Tampa Bay. We’re going to be within the ideal start of the evacuation timeframe by the end of this evening.
-
It happens quite a bit… when recon is investigating but the package has to go out. The NHC isn’t shy about issuing updates whenever.
-
Or, you could have passed it off that you were trying to convey how the earlier intensity forecasts were way underdone for Michael’s landfall….which your map does show.
-
The LA 911 link above is showing multiple flooding calls, a debris flow, and a water rescue…within the past hour.
-
2023 Mid-Atlantic Severe Wx Thread (General Discussion)
gymengineer replied to Kmlwx's topic in Mid Atlantic
Significant power outages extend into much of northwestern VA, so the lines did have a fairly wide footprint in impacts. It just didn’t bullseye the DC metro area. https://poweroutage.us/area/state/virginia https://poweroutage.us/area/state/maryland- 2,785 replies
-
- 3
-

-

-
- severe
- thunderstorms
- (and 3 more)
-
2023 Mid-Atlantic Severe Wx Thread (General Discussion)
gymengineer replied to Kmlwx's topic in Mid Atlantic
Yeah, I think for the more immediate DMV region, this was a top-3 most power-disruptive event since the 2012 Derecho. (Sandy later that year was somewhat muted in outages). The big wind event in March 2018 was more than today, but I don’t think there are two other greater outage events since 2012. -
2023 Mid-Atlantic Severe Wx Thread (General Discussion)
gymengineer replied to Kmlwx's topic in Mid Atlantic
So it looks like peak outage for the more immediate DMV was 150,000+ customers, and 250,000+ customers for the states of VA and MD combined.- 2,785 replies
-
- 1
-
-
- severe
- thunderstorms
- (and 3 more)
-
2023 Mid-Atlantic Severe Wx Thread (General Discussion)
gymengineer replied to Kmlwx's topic in Mid Atlantic
Two days in a row of spectacular wind burst here in N. Bethesda. This one was/is accompanied by moments of complete whiteout. Right now is complete white-out again. One area across the street never got its power back before this round.- 2,785 replies
-
- 3
-
-
- severe
- thunderstorms
- (and 3 more)
-
Across from Pike and Rose in North Bethesda just now: wind gusts associated with rain just knocked roofing or siding from a construction high rise site, which hit a power line on Rockville Pike. A huge green flash and pop happened and now power is out in the neighborhood.
-
I know multiple people have pointed this out toward the beginning of the season, but watching this video just reiterates that the degree of “urgency” you may feel about this winter partly depends on whether you got flush-hit on 1/3/22. That was such a quality, high impact snowstorm for much- but of course not close to all- of this sub forum.
-
Lol, exactly. Now this is supposed to be about cities all around the country? And the obsessive troll responses to the same post…
-
Ah, there it is. That’s the whole agenda, lol.
-
December 22-23, 2022: Warm Rain to Arctic Chill
gymengineer replied to WxUSAF's topic in Mid Atlantic
Thanks! I am intrigued in the “by 8 pm” part. I’m sure there’s been some calm evening after a big snow where radiative cooling allowed the temp to plummet below 10F shortly after sunset. But for a CAA scenario, I can’t remember off the top of my head the last time we (I-95 corridor and close in suburbs) managed single digits so early in the evening. Of course we did it in 1/1994, but I must be missing a couple or a few other cases since. -
December 22-23, 2022: Warm Rain to Arctic Chill
gymengineer replied to WxUSAF's topic in Mid Atlantic
I don’t know if you keep records so specific, but have you ever/when was the last time your current location fell under 10F by 8 pm? -
December 22-23, 2022: Warm Rain to Arctic Chill
gymengineer replied to WxUSAF's topic in Mid Atlantic
This Buffalo blizzard has got to be among the most intense ever for a city of over 100,000 people in the US. The great New England ones have matched wind-wise for a period, but not as long this one is going to rage at 60+ mph. And of course, multiple instances of zero visibility is quite hard to achieve right at the official reporting station. -
December 22-23, 2022: Warm Rain to Arctic Chill
gymengineer replied to WxUSAF's topic in Mid Atlantic
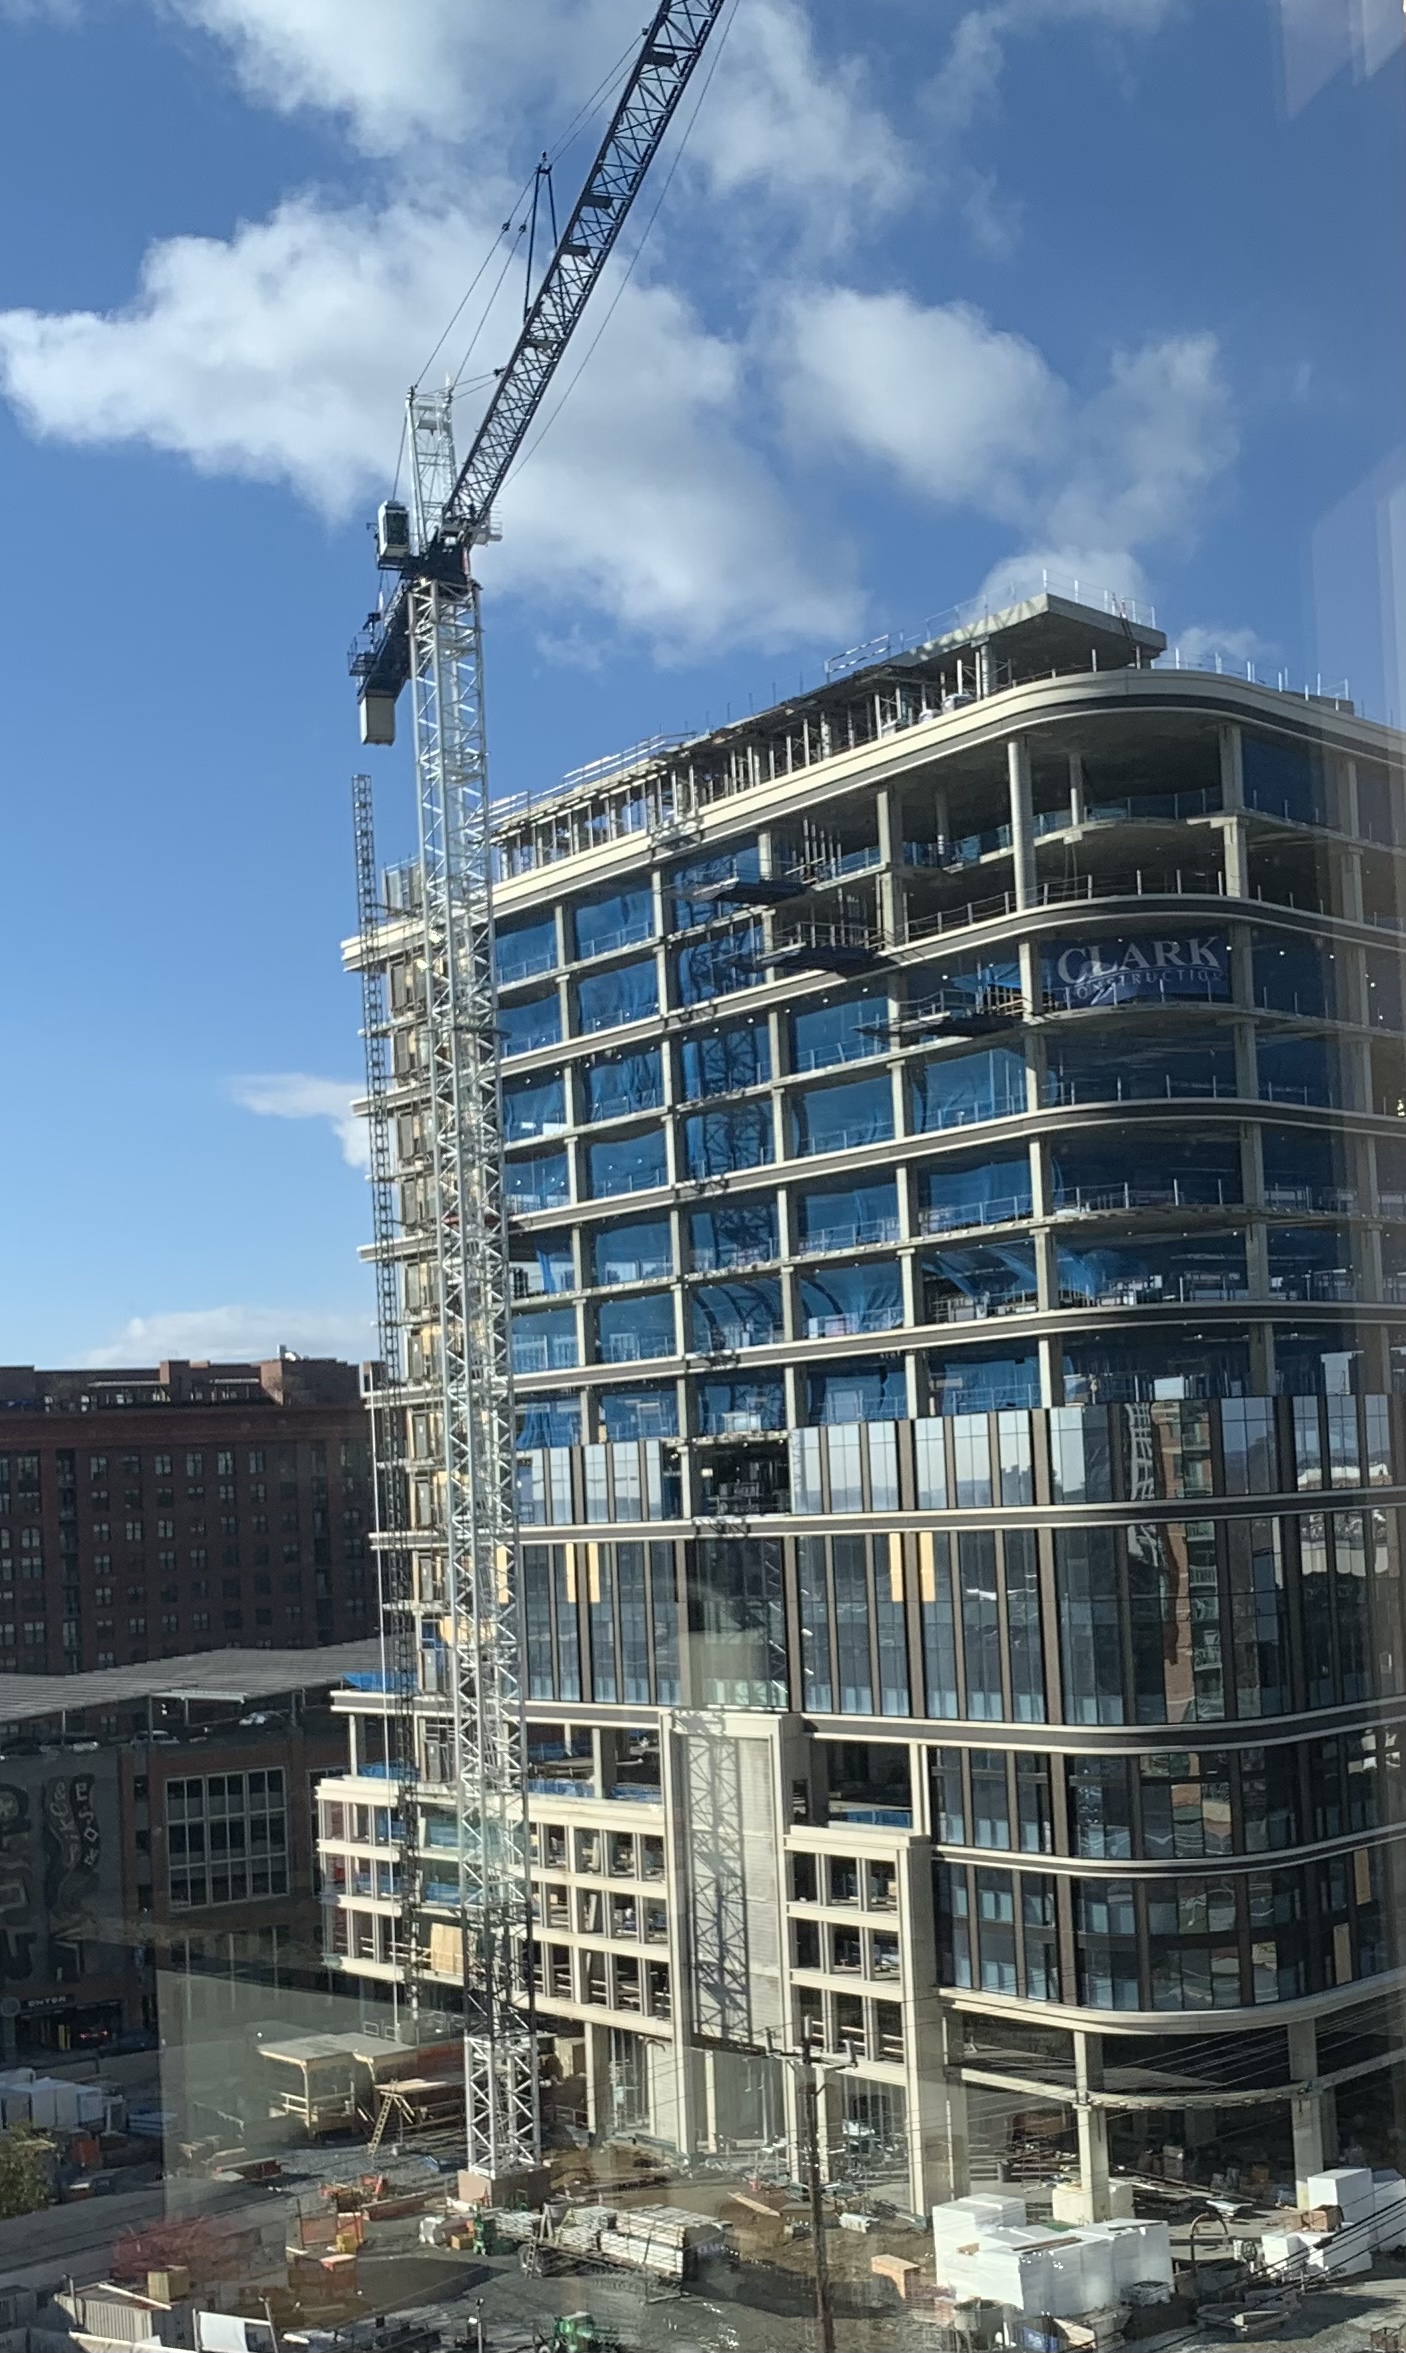
This construction crane has been swaying back and forth, and the arm has swung by more than 90 degrees.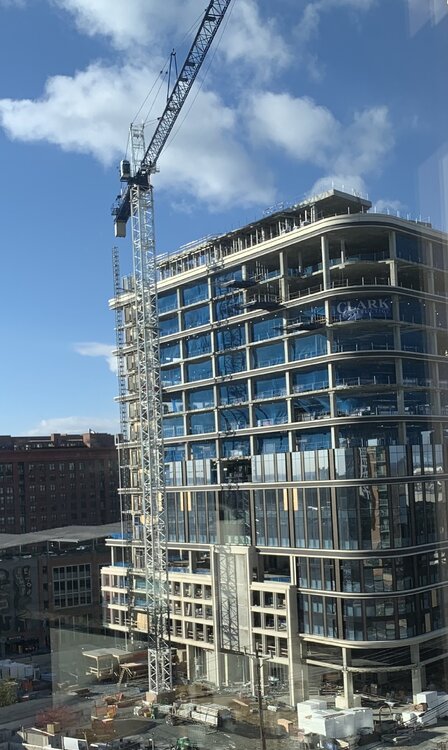
-
December 22-23, 2022: Warm Rain to Arctic Chill
gymengineer replied to WxUSAF's topic in Mid Atlantic
Lots of standing water in the parking lots around here. Shaded puddles are starting to freeze. -
December 22-23, 2022: Warm Rain to Arctic Chill
gymengineer replied to WxUSAF's topic in Mid Atlantic
https://poweroutage.us -
December 22-23, 2022: Warm Rain to Arctic Chill
gymengineer replied to WxUSAF's topic in Mid Atlantic
Three states now with over 100,000 customers without power: NC, VA, TN 11 more states with over 50,000 customers without power. -
December 22-23, 2022: Warm Rain to Arctic Chill
gymengineer replied to WxUSAF's topic in Mid Atlantic
92,000+ customers without power in VA now and rapidly climbing. -
December 22-23, 2022: Warm Rain to Arctic Chill
gymengineer replied to WxUSAF's topic in Mid Atlantic
Do you have a link to a source that lists what the warning hierarchy is to determine which color we see on the NWS map when multiple warnings/advisories are in place? Like, flash flood and tornado warnings will always be primary, but between a winter weather advisory and a wind chill advisory, for example, which one takes precedence on the map? Thanks in advance! -
I’m trying to remember what triggered that blowout fight amongst you, Matt, and maybe Ian was involved too, that resulted in you posting very NSFW pics. IIRC, meanwhile, Wes just calmly minded his own business and continued posting about the weather. Fun times!