gymengineer
Members-
Posts
3,363 -
Joined
-
Last visited
Content Type
Profiles
Blogs
Forums
American Weather
Media Demo
Store
Gallery
Everything posted by gymengineer
-
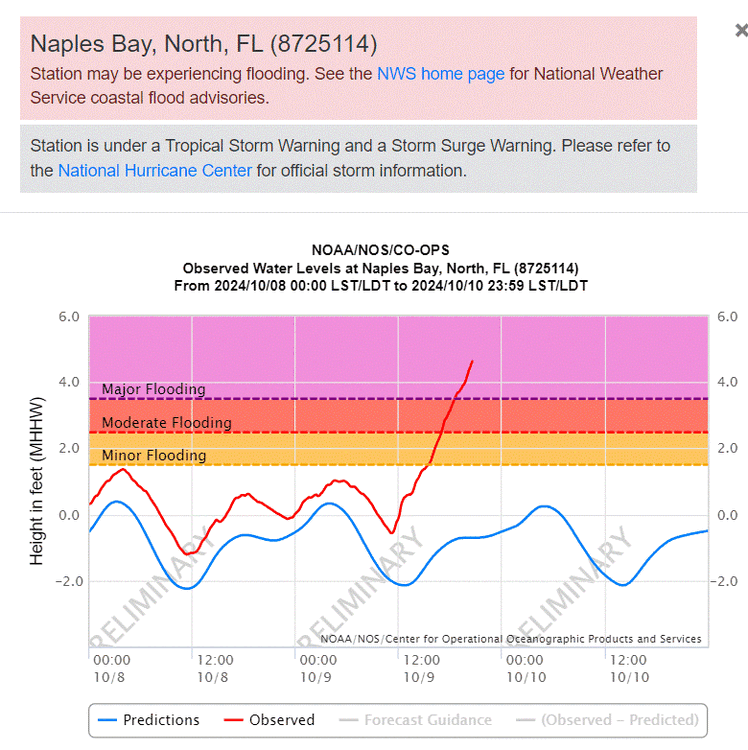
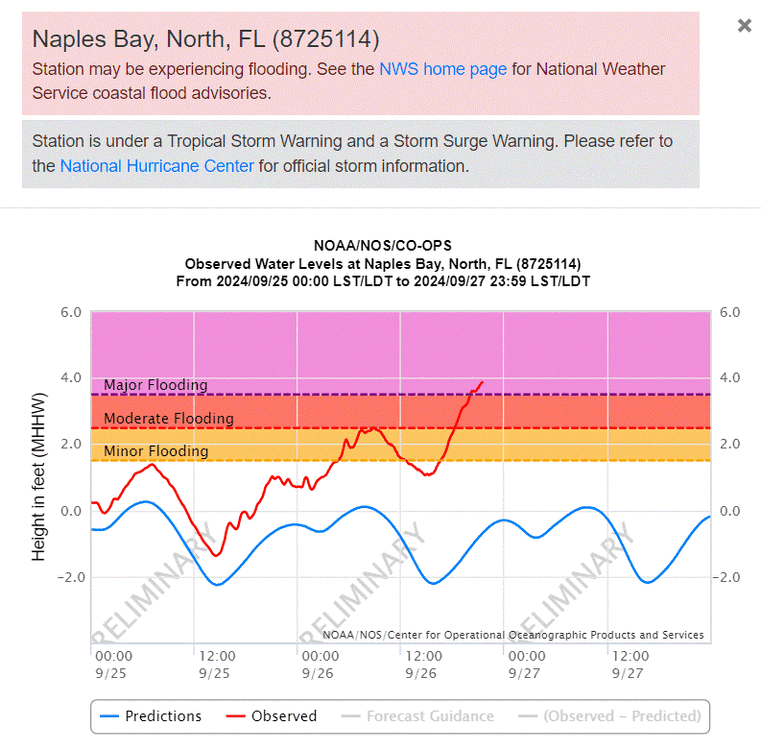
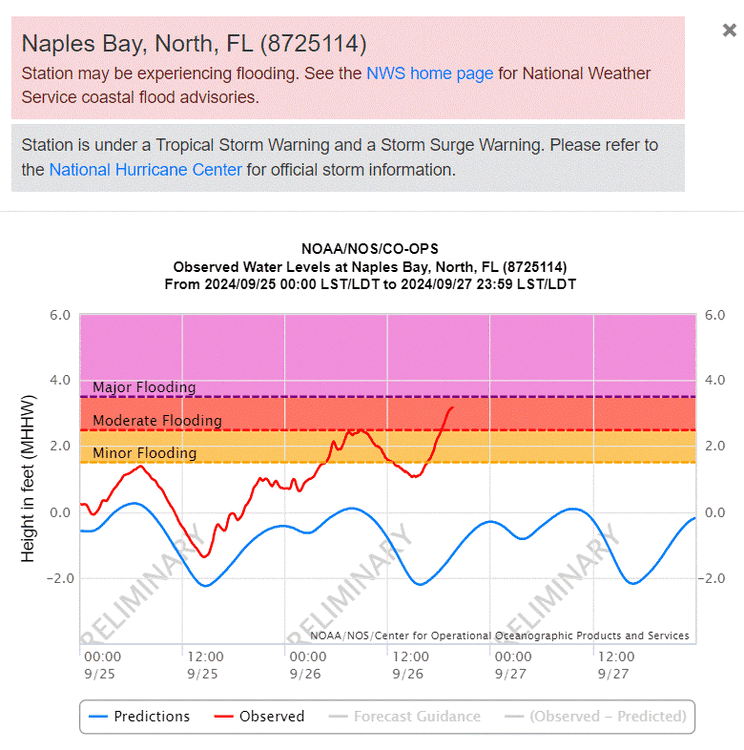
This water trace from Naples- still sharply rising- shows that Milton is not falling short of its potential for storm surge. The entire stretch of the FL coast from Venice to Naples is going to experience damaging surge.
-
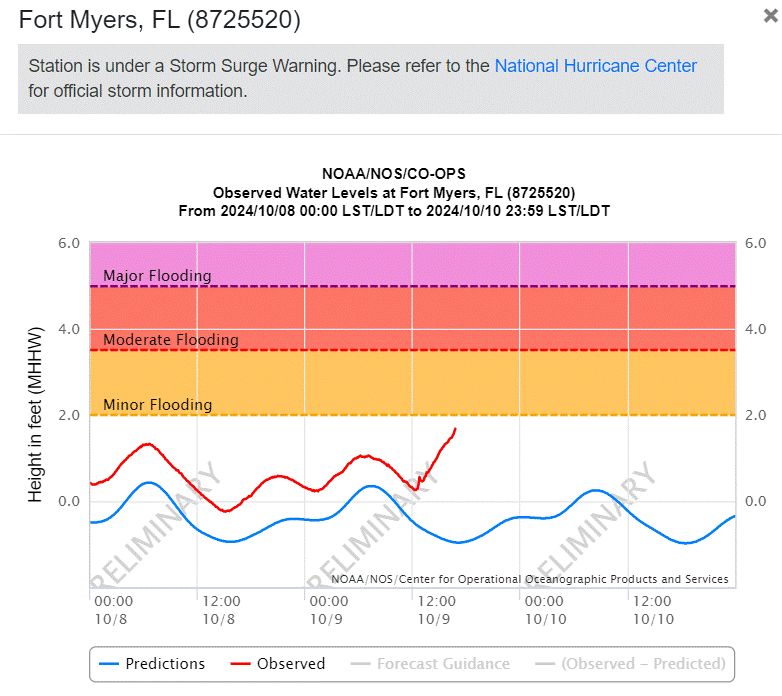
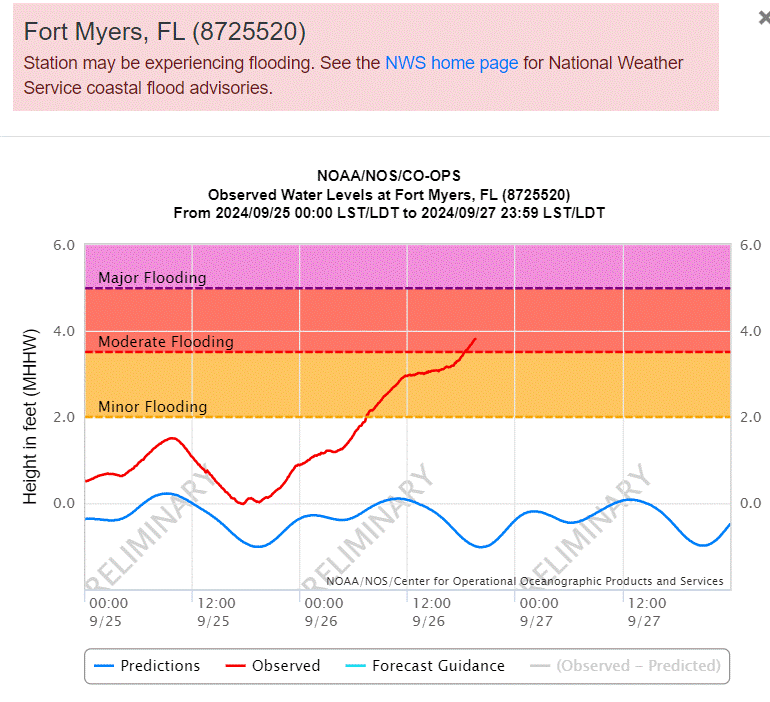
And up the coast from Naples, the increase in rate of water rise (slope) at Ft. Myers is coinciding with low tide.
-
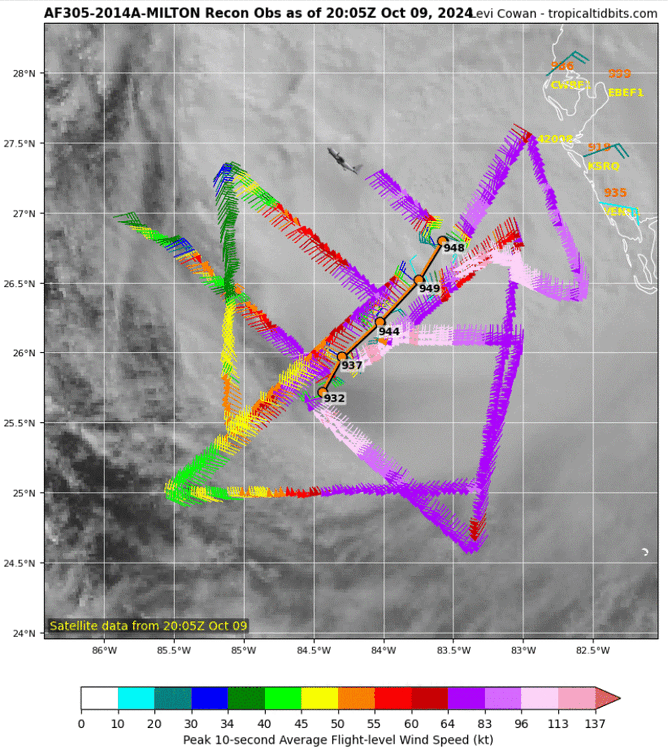
No need for wobble tracking. Using the center fixes from recon, the longer term motion has been clear.
-
St. Petersburg airport already at TS-force: 40 mph/gust 51 mph
-
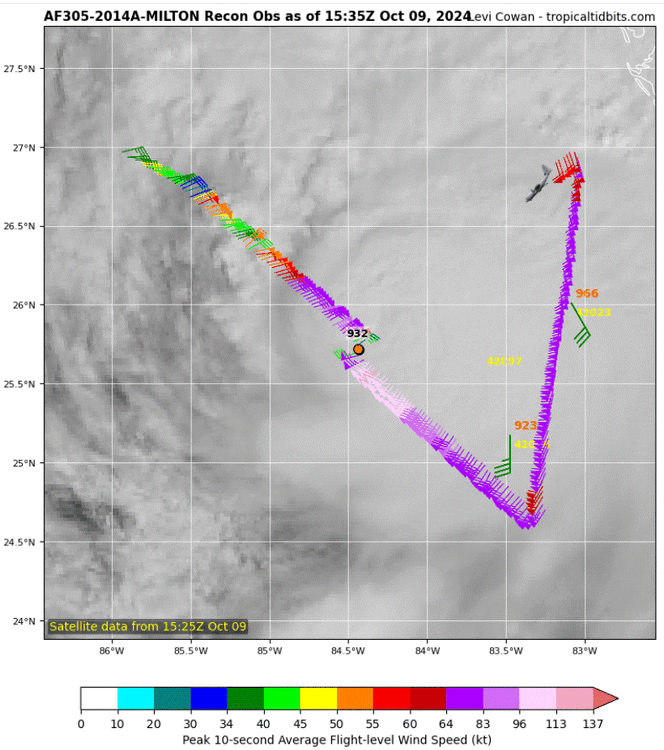
What's immediately noticeable on this recon flight so far is how far northeast of the center flight-level (not surface) hurricane force winds now extend.
-
Landfall intensity vs. impact rating
gymengineer replied to gymengineer's topic in Tropical Headquarters
Here are the TCRs. Again, Nicole ended up being downgraded to a tropical storm rating for the landfall list, while Jeanne kept its Category 3 landfall/impact. Nicole: https://www.nhc.noaa.gov/data/tcr/AL172022_Nicole.pdf (page 5 is especially relevant) Jeanne: https://www.nhc.noaa.gov/data/tcr/AL112004_Jeanne.pdf (page 2 is especially relevant) -
I recently queried AOML why Hurricane Nicole (2022) was missing from the list of landfalling US hurricanes; the TCR for Nicole had a 65-kt landfall at Vero Beach, FL: https://www.aoml.noaa.gov/hrd/hurdat/All_U.S._Hurricanes.html Surprisingly, Chris Landsea himself answered. The reason is that Nicole’s hurricane force winds at the time of landfall were not hitting land. They were clearly over water. So, Nicole was assigned as 60-kts on the tropical storms list: https://www.aoml.noaa.gov/hrd/hurdat/uststorms.html That reminded me of Hurricane Jeanne’s (2004) TCR, which explained that it was not determined whether the 105-kt winds at landfall made it onshore or remained over water. Mr. Landsea confirmed that Jeanne’s landfall was given the benefit of the doubt and therefore made it onto the landfall list as a Category 3 impact for FL. I wonder, as sources of data become richer and richer, whether we will see more discrepancies between an official landfall windspeed and what the impact rating ends up being. In other words, if every hurricane landfall is analyzed for whether the strongest winds at the time of landfall were in an onshore orientation, would that require many more mismatches between the two official sources?
- 1 reply
-
- 1
-

-
The NHC has used this phrasing multiple times now: "Note that this track is closer to the model fields rather than the model trackers which appear to be too far south." I wonder if this is related to the track adjustments during Helene where, at first, they did not prioritize the verbatim global model outputs showing a landfall in Taylor County, FL, and then a track through central GA instead of toward Atlanta.
-
There has been much discussion of a still high storm surge in a significantly weakening former Cat 4 or 5 hurricanes in the GOM. Aside from the obvious Katrina example, here are three other notable examples: Opal (1995)- 130 kt peak weakened to 100 kt at landfall with a storm surge of 10-15 ft in the Navarre Beach to Destin area, FL Lili (2002)- 125 kt peak weakened to 80 kt at landfall with a storm surge of 12 ft near Calumet and Vermillion Bay, LA Rita (2005)- 155 kt peak weakened to 100 kt at landfall with a storm surge of 15 ft at Cameron, LA In comparison, Ian (2022) had a maximum storm surge of 10-15 ft centered at Ft. Myers Beach as a 130 kt landfall. It looks like Milton's storm surge will really be building as its wind field expands most dramatically on Wednesday.
-
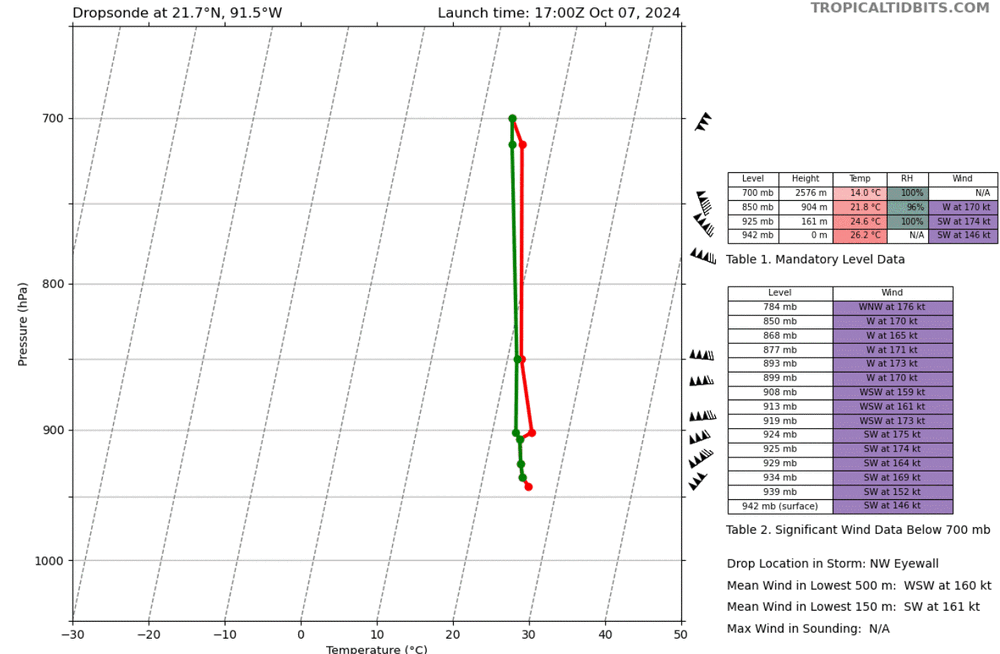
And an all timer of an eyewall dropsonde- look at the mean wind in the lowest 150 m and the surface wind.
-
Rita was 895 mb.
-
If Milton does reach Cat 3 and is a still a hurricane at landfall, that would be 9 total hurricanes, 4 major hurricanes, and 5 US hurricane landfalls by October 10th. This season has rightly justified the pre-season alarm, even if the total number of named storms is more modest.
-
I’ve noticed that the NHC more and more will update milestone increases in strength- upgrade to major or a category upgrade- at non-designated times. In Kirk’s case, there aren’t any watches or warnings, so they could have waited until 11 pm ET to announce the upgrade. Has there been a stated policy change? IMO, these off-time upgrades have been a great positive. For hurricanes that have been approaching land, they’ve been essential to generating breaking news headlines in media.
-
2024 Atlantic Hurricane Season
gymengineer replied to Stormchaserchuck1's topic in Tropical Headquarters
I still think you are missing the point. Atlantic hurricane names are either English, Spanish, or French, reflecting the people affected by those hurricanes. Helene is a French name. Isaias in 2020 was an example of a Spanish name that many US news broadcasters practiced pronouncing before speaking. -
These were the PNS's from GSP released Thursday and Wednesday. The Thursday language is as dire as I've seen for flooding. I still did see quite a few people on social media saying they were led to believe Helene was going to pass well west- the Atlanta track- so had no idea it was possibly going to be this bad. That track shift may explain the surprise over the extent of power outages, but doesn't explain ignorance about the impending flooding. I agree that people are probably just not getting their weather info from "old-school" sources anymore. Public Information Statement National Weather Service Greenville-Spartanburg SC 122 PM EDT Thu Sep 26 2024 ...CATASTROPHIC FLOODING AND LANDSLIDES FOR THE MOUNTAINS AND FOOTHILLS FROM HURRICANE HELENE... This will be one of the most significant weather events to happen in the western portions of the area in the modern era. Record flooding is forecasted and has been compared to the floods of 1916 in the Asheville area. The impacts from this event are expected to be greater than Tropical Storm Fred from August 2021, the mountains in 2004 from Frances and Ivan, and in Upstate South Carolina the Saluda River Basin flooding from 1949. We plead with everyone that you take every single weather warning very seriously through the entirety of this event as impacts will be life- threatening and make sure to have multiple ways to receive the alerts. The protection of life and property is the overall mission of the National Weather Service, and we pledge to stand by the folks of the western Carolinas and northeast Georgia. We cannot stress the significance of this event enough. Heed all evacuation orders from your local Emergency Managers and go to a storm shelter if you do not feel safe at your current location. Landslides, including fast-moving debris flows consisting of water, mud, falling rocks, trees, and other large debris, are most likely within small valleys that drain steep slopes. Landslides are powerful and potentially deadly, capable of washing out roads, bridges, and homes. People living in areas prone to landslides should be aware of the danger and be prepared to act. $$ Public Information Statement National Weather Service Greenville-Spartanburg SC 444 PM EDT Wed Sep 25 2024 ...INCREASED THREAT OF LANDSLIDES AND DEBRIS FLOWS ACROSS THE MOUNTAINS AND FOOTHILLS FROM LATE THIS EVENING INTO FRIDAY... A band of rain has already developed across the mountains, well in advance of the rain associated with Helene, and the rain band is expected to continue to develop across the western Carolinas and northeast Georgia tonight. Periods of heavy rain will occur tonight and through the day Thursday, followed by additional rounds of heavy rain associated with Helene Thursday night and Friday morning. The heavy rain is expected to result in significant flooding along creeks and streams. This has the potential to be an extremely rare event with significant and damaging flash-flooding along numerous streams. The excessive rain that falls through Thursday before Helene arrives will gradually raise the threat for landslides across the mountains and foothills. Enough rain is expected along and near the Blue Ridge Escarpment and upper French Broad Valley to result in a few landslides before Helene arrives. Once the rain from Helene moves in late Thursday, the threat for landslides and debris flows will increase sharply, and the threat will continue through Friday morning. Rainfall amounts of ten to fifteen inches are possible near the Blue Ridge Escarpment, before the rain moves out. Locally higher amounts are possible. Rainfall of ten inches or more in similar storms has been associated with a greatly increased risk of landslides and debris flows. Landslides, including fast-moving debris flows consisting of water, mud, falling rocks, trees, and other large debris, are most likely within small valleys that drain steep slopes. Landslides are powerful and potentially deadly, capable of washing out roads, bridges, and homes. People living in areas prone to landslides should be aware of the danger and be prepared to act. Here are recommended actions to consider both ahead of the storm and when the heavy rain begins. Before the Storm: 1. If you live on a mountainside or in a cove at the base of a mountain, especially near a stream, be ready to leave in advance of the storm or as quickly as possible should rising water, moving earth, or rocks threaten. Identify a sturdy shelter on higher ground such as a well-built home, church or school. 2. Stay alert. Monitor NOAA Weather Radio or local media for possible flash flood warnings. During the Storm: 1. Avoid driving near steep slopes or crossing stream valleys, particularly at night. Never try to drive across a flooded road. Potential hazards to drivers include washed-out roads, bridges, and falling or flowing large debris. Turn Around, Don`t Drown! 2. Immediately move away from steep slopes and small streams in steep valleys. Seek refuge on higher ground away from streams, preferably in a sturdy shelter. 3. Stay alert. Many landslide fatalities occur when people are sleeping. Be aware that short intense bursts of rainfall are most likely to cause landslides. 4. Keep tuned to NOAA Weather Radio or local media for the latest warnings and statements regarding this potentially dangerous weather event.
-
This drone footage from Keaton Beach is reminiscent of the drone footage from Grand Isle after Ida.
-
For Naples to hit Major Flood stage around the same time as Clearwater Beach shows just how huge the impact of Helene is/will be.
-
-
-
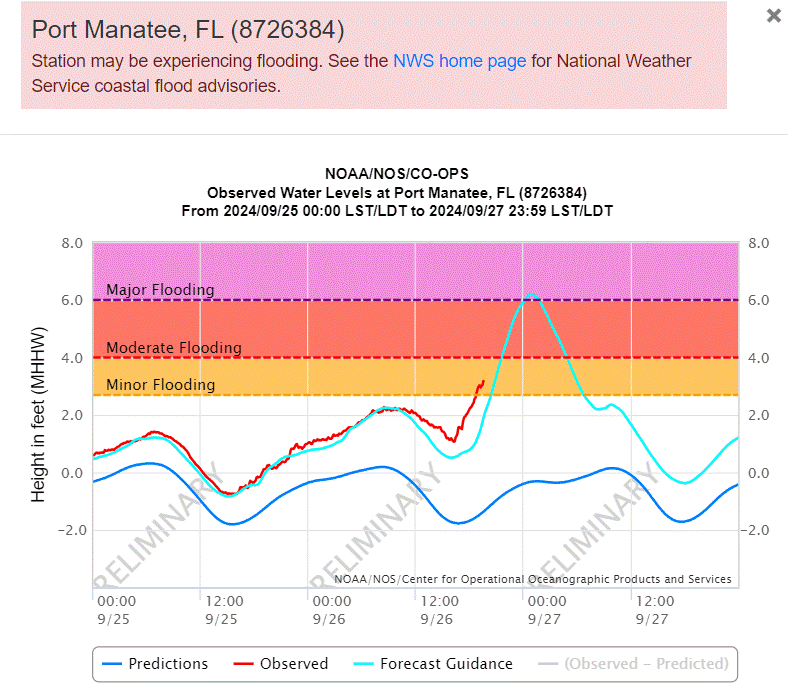
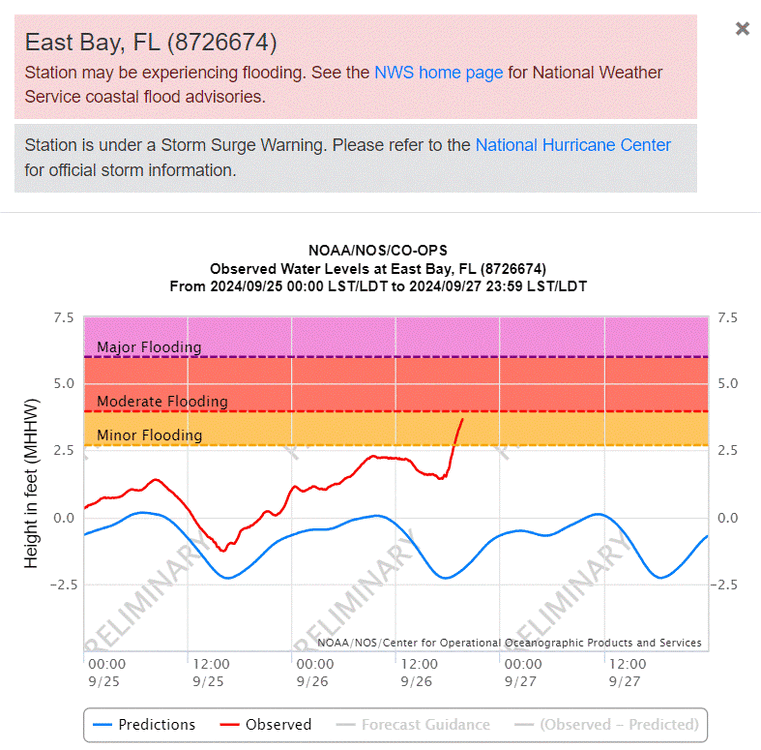
Ahead of forecast at Port Manatee and sharply rising at East Bay. But, you can check them out yourself at: https://tidesandcurrents.noaa.gov/inundationdb/cidstorm.html?stormname=Helene
-
Water rising sharply in Ft. Myers and Naples even though the center of Helene is well past their latitude.
-
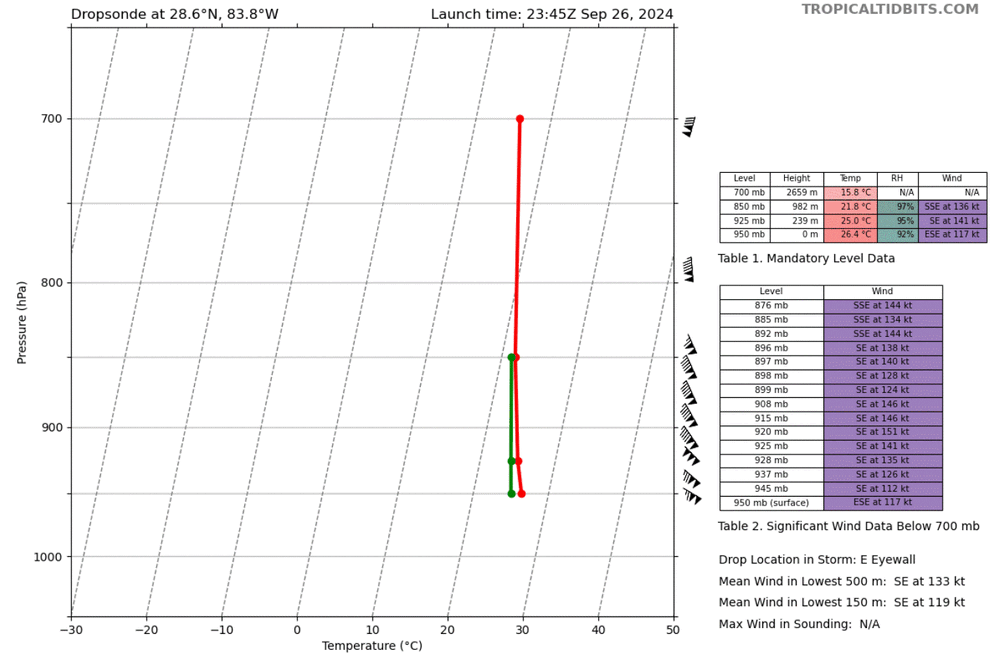
Dropsonde suggests 942 mb.
-
I find it kind of amazing Annapolis has been experiencing Moderate level high tide flooding every single day since Saturday, and it's just such a common occurrence now that it's not newsworthy.
-
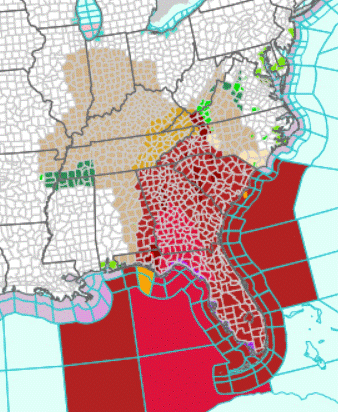
There aren't many hurricanes that have resulted in such a wide geographical area of wind products- 14 states!
-
NHC went with 959 mb at 3 pm to 951 mb at 4 pm (accounting for the 8-kt wind), so an even more impressive 8 mb drop in 1 hour in their Update Statements every hour.

