All Activity
- Past hour
-
Augdewst 2026: Summer's Last Stand
WxWatcher007 replied to Prismshine Productions's topic in New England
That's relief compared to what I've been paying. Gas was $4.89 at peak in SLK this summer and I paid $4.59 there yesterday. Brutal, brutal stuff. -
Thanks, Charlie, for posing that. None of what you posted from that article surprises me. I’m not at all expecting to take JB’s side, especially because he’s a proud denier of AGW being a significant factor in GW. But what do you know about his statement that Nepal hasn’t warmed in 400 years? Did he just make this up? From where would he have gotten accurate data so far back? Also, does that map of his that I reposted supposedly showing a somewhat cooler than normal summer along the Nepal-Tibet border have any significance even if accurate? I noticed it has no legend and no reference like the base period and the period these blue colors are representing. He’s saying this is the “wrong summer” to claim a disaster was based on GW. But even if it truly was cooler than normal this summer there, would that even matter being that melting supposedly would have already been put in motion due to supposedly prior warmer than normal periods?
-

Augdewst 2026: Summer's Last Stand
weatherwiz replied to Prismshine Productions's topic in New England
One gas station up the road went from $3.66 to $3.99 in a few days...if even a few days -
I dumped the latest data and asked AI to summarize: (will do August numbers when they come in, once that happens ill repost) The latest ENSO data continue to strongly support a major El Niño analog package for 2026–27. July 2026 monthly values show Niño 3.4 at +1.73°C, Niño 3 at +2.30°C, Niño 1+2 at +2.91°C, and Niño 4 at +1.42°C. This means the event is not just east-Pacific warm; it also has strong basinwide support. The atmospheric side is also very strongly coupled, with SOI at -4.00 and MEI.v2 at +2.41 for July 2026. ONI is already +1.40 through June, RONI is +1.34 for July, and the subsurface/thermocline indicators are supportive, including strong upper-ocean heat content and a much deeper-than-normal thermocline in the east. Compared with past El Niño events, the best current analogs remain the major-event years: 1997–98, 2015–16, and 1982–83. The 1997 analog still looks best for the explosive east-Pacific component, especially with the very warm Niño 1+2 and Niño 3 regions. The 2015 analog is also very strong because 2026 now has a more basinwide look, with Niño 4 also quite warm. 1982 remains a strong analog for the eventual major-event trajectory and atmospheric response, even though it was not as warm in July as 2026 is now. Secondary analogs include 1972–73, 2023–24, 1965–66, and 1957–58. By category, the top SST-structure analogs are 1997, 2015, 2023, 1972, and 1982. For Niño 3.4 intensity and projected peak, the best analogs are 2015, 1997, 1982, 1972, and 1965. For the far-eastern Pacific / Niño 1+2 component, the best analogs are 1997, 2023, 2015, 1972, and 1965. For Niño 4 / basinwide support, the best matches are 2015, 2002, 2023, 1997, and 2009. For atmospheric coupling using SOI and MEI, the best analogs are 1997, 2015, 1982, 1972, and 1965. Overall, the current blend favors 1997–98 first, 2015–16 second, 1982–83 third, then 1972–73, 2023–24, 1965–66, 1957–58, 1991–92, 2002–03, and 2009–10. Parameter Latest 2026 Reading Period What It Shows Niño 3.4 +1.73°C July 2026 Strong central/east-central El Niño Niño 3 +2.30°C July 2026 Very strong east-central warming Niño 1+2 +2.91°C July 2026 Very strong far-eastern Pacific warming Niño 4 +1.42°C July 2026 Basinwide support, not just coastal/eastern ONI +1.40°C June 2026 El Niño established on 3-month basis RONI +1.34°C July 2026 Strong relative Niño 3.4 signal MEI.v2 +2.41 July 2026 Very strong coupled ocean-atmosphere signal SOI -4.00 July 2026 Very strong atmospheric El Niño response OLR -1.20 July 2026 Enhanced central/eastern Pacific convection Heat Content +2.48 July 2026 Strong subsurface warm support 200mb Zonal Winds -6.79 July 2026 Upper-level easterly anomaly support 20°C Thermocline Depth, 95W +56.28 m July 2026 Much deeper-than-normal eastern thermocline Overall Rank Analog Match Level Main Reason 1 1997–98 Best overall Best blend of rapid onset, east-Pacific warmth, strong MEI, and major-event trajectory 2 2015–16 Very high Best basinwide/intensity match, especially with strong Niño 4 support 3 1982–83 High Excellent major-event trajectory and atmospheric response, though weaker July SSTs 4 1972–73 High Classic eastern-Pacific strong El Niño analog 5 2023–24 Moderate-high Excellent recent east-Pacific analog, but weaker coupling at the same stage 6 1965–66 Moderate-high Good east-Pacific and SOI secondary analog 7 1957–58 Moderate-high Strong historical El Niño, useful secondary analog 8 1991–92 Moderate Decent coupled warm-event analog, but weaker structure 9 2002–03 Moderate More central/basinwide, weaker eastern-Pacific match 10 2009–10 Lower-moderate El Niño winter analog, but weaker summer development/coupling Bottom line: the latest readings strengthen the case that 2026–27 belongs in the major El Niño analog group. The strongest overall comparisons are 1997–98, 2015–16, and 1982–83, with 1972–73 as the best classic eastern-Pacific secondary analog. What makes 2026 stand out is the combination of very warm Niño 1+2, strong Niño 3.4, strong Niño 4, a very negative SOI, and MEI.v2 above +2. That is a much stronger coupled signal than 2023 had at the same point.
-
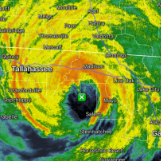
Invest 97L--70% Development Odds
WxWatcher007 replied to WxWatcher007's topic in Tropical Headquarters
Yep. We see this plenty of times--satellite looks good but when recon gets in there it's still a bit of a mess. This one is on its way to being a TC, but probably not quite there/borderline. Interested in what they find on the eastern flank & in that possible center. -

Occasional Thoughts on Climate Change
Typhoon Tip replied to donsutherland1's topic in Climate Change
It's hard to parse out what did what and how much, in the run up to this specific states and scenarios. In considering France's issues with agriculture, this was likely set into motion over decades when looking at this as an epistemic/a-priori approach. I'm not personally with any confidence that this specific 'onsetting' warm ENSO has much to do with it frankly. Quick primer ( I get it that you know this.. just for the general reader). As we know El Ninos typically begin to formulate during summers, then maturing during autumn and early winters. This one appears to fit that climatology so far... More importantly, during these prefaces of onset the wholesale seasonal gradients are still flaccid. That's a crucial consideration in the presumptions. Because... the gradient determines where the jet structures will ultimately bias; that becomes the El Nino characterization if/when the El Nino is sufficiently coupled. As an aside, the warming total atmosphere associated to CC is limiting the coupling. Why? because the gradient of winter is being lifted to higher latitudes - that is distancing that latitude (geometrically), so the coupling is getting amorphously defined. Enters RONI... Relative ONI is pure statistical approach to the resulting slipping/lowering observed effectivity. The 2nd aspect that makes the causal parsing a challenge is that the heat and drought has been an improving frequency and specter for decades, doing so regardless of a ENSO variances in either direction over that time. Having said all that, here's where there's an angle: I think there is a gray area in the completer understanding as to what actually triggers the modal oscillation of ENSO. In that area of speculation, conjecture and hypothesis, it may yet be shown that the circulation modes outside the tropics are somehow transitively being causing the tropical wind patterns to occasionally reverse. Like the noise over time organizes into a sinusoidal harmonic feedback, at a whole-Earth atmosphere scale. If something like that were taking place then it would be entirely possible/reasonable that machinery 'switching gears' did something to specifically enhance France's agricultural problems now. But, since the specter of heat and drought goes back years, parsing out what's to blame ...mm intuitively argues it's just a CC related matter in general. At some point, if the CC continues to change .. it may herald in a new behavior there and abroad. It's areas of the curve favor a phenomenon typology. -
Invest 97L--70% Development Odds
NorthHillsWx replied to WxWatcher007's topic in Tropical Headquarters
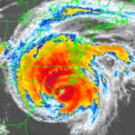
Looks pretty broad/open on south side. That mid level feature looks more impressive than what’s under the hood. This is why NHC waits for solid data before designating systems even close to land. Could see PTC at 11 tho -
Invest 97L--70% Development Odds
WxWatcher007 replied to WxWatcher007's topic in Tropical Headquarters
We've gotten names for less I kid, I kid... -
Monday, August 31 - Wednesday, September 2, 2026 Convective Episodes
weatherwiz replied to weatherwiz's topic in New England
It's usually difficult for us not to get at least one day in when we have these type of setups. Tomorrow is going to be interesting to see play out, its been a heavy mix on how tomorrow evolves. A good part of CT may end up right along the instability gradient -
 mexican online mail order pharmacy [url=http://mexiph.com/#]pharmacy mexico[/url] : pharmacy delivery
 -

Augdewst 2026: Summer's Last Stand
CoastalWx replied to Prismshine Productions's topic in New England
Just don’t know what to do with all this winning -
Invest 97L--70% Development Odds
NorthHillsWx replied to WxWatcher007's topic in Tropical Headquarters
A light breeze based on that pass -
Gas prices jumped considerably this morning. Winning.
-
-
One of the odd years PHL had less 90 degree days than northern areas maybe the one exception for NYC sites. EWR has had more than PHL or equal on many occasions. Year EWR PHL LGA NYC JFK 2025 39 37 26 14 15 2024 33 32 21 21 6 2023 29 24 16 12 8 2022 49 48 30 25 16 2021 41 37 25 17 10 2020 31 36 34 20 12 2019 27 35 26 15 7 2018 36 30 38 21 8 2017 22 26 17 13 9 2016 40 46 32 22 15 2015 35 37 20 20 12 2014 15 19 6 8 2 2013 25 20 21 17 9 2012 33 39 28 19 16 2011 31 33 19 20 13 2010 54 55 48 37 32 2009 14 15 8 7 6 2008 22 23 19 12 9 2007 21 24 23 10 7 2006 27 27 22 8 12 2005 37 29 30 23 17 2004 13 9 7 2 1 2003 20 23 17 8 12 2002 41 46 35 32 21 2001 22 23 17 15 8 2000 16 10 12 7 6 1999 33 35 26 27 14 1998 21 31 11 8 5 1997 20 20 17 12 10 1996 9 7 6 3 4 1995 33 49 23 29 15 1994 39 36 22 19 7 1993 49 41 26 39 13 1992 22 14 9 9 6 1991 41 53 34 39 17 1990 26 23 10 12 6 1989 27 19 17 16 9 1988 43 49 26 32 14 1987 37 31 19 22 11 1986 22 33 9 11 8 1985 11 12 8 9 5 1984 22 7 9 10 13 1983 40 41 31 36 26 1982 12 12 6 11 4 1981 21 15 15 16 11 1980 27 36 22 32 11
-
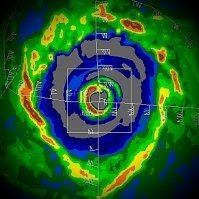
No surprise. The MCS appears to be drilling down at that location with a very small vmax underway. We may have a depression. We'll see what the NHC does. I imagine they would at least go with a PTC at 11AM/10AM CT.
-
Augdewst 2026: Summer's Last Stand
WxWatcher007 replied to Prismshine Productions's topic in New England
Must've been absolutely frigid up at SLK. -
Septorcher 2026 Discussion - Endless Summer
WxWatcher007 replied to Damage In Tolland's topic in New England
It might be in a SUPER Nino -
Monday, August 31 - Wednesday, September 2, 2026 Convective Episodes
CoastalWx replied to weatherwiz's topic in New England
Yeah Thursday beat potential but tomorrow will have some. CT favored. -

Augdewst 2026: Summer's Last Stand
Snowedin replied to Prismshine Productions's topic in New England
Iirc a good portion of that Feb was a straight up torch in much of sne with a few days topping 70. I remember taking the dog outside late at night and was shocked how pleasant it felt. I wouldn’t be totally surprised to see a few good surges of warmth next winter with the way things look to be setting up, at least south of Worcester. -

2026 Spring/Summer Mountain Thread
BlueRidgeFolklore replied to Buckethead's topic in Southeastern States
We made it to the last day of August. I hope someone is ready to fire up the Fall/Winter thread tomorrow. Maybe it'll bring good luck! -
(002).thumb.png.6e3d9d46bca5fe41aab7a74871dd8af8.png)
Central PA Summer 2026 Discussion/Obs Thread
ChescoWx replied to Voyager's topic in Upstate New York/Pennsylvania
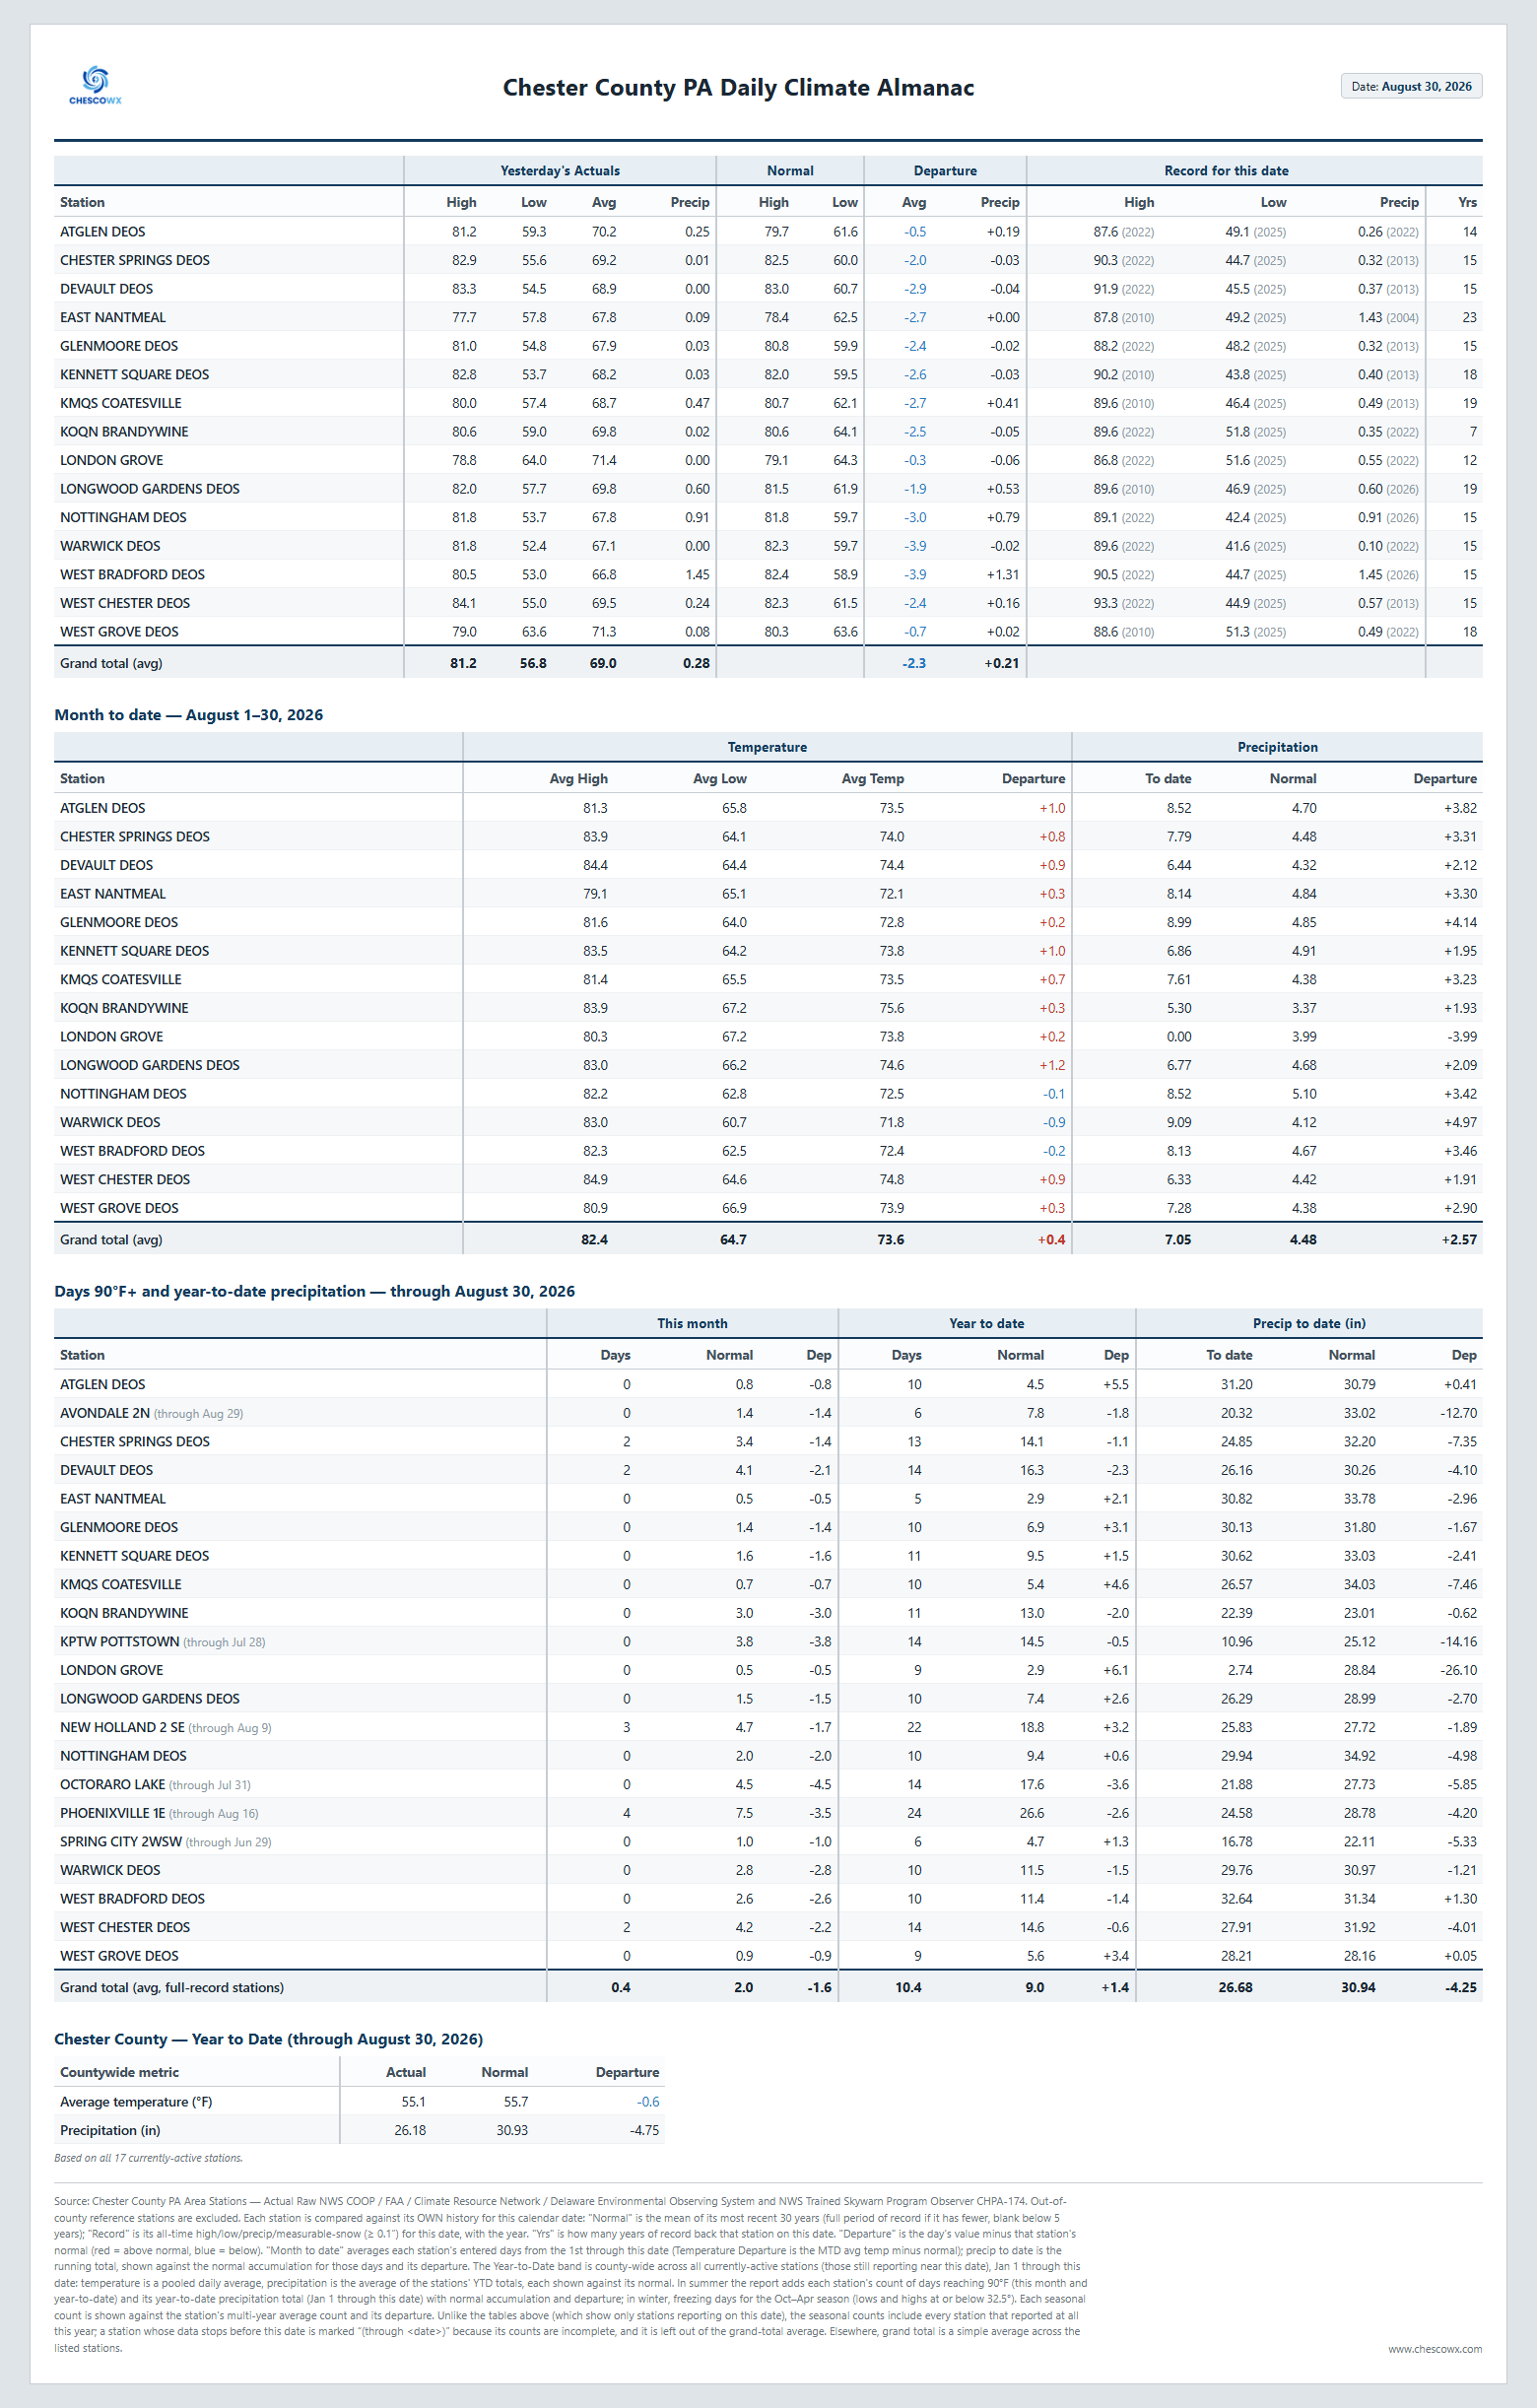
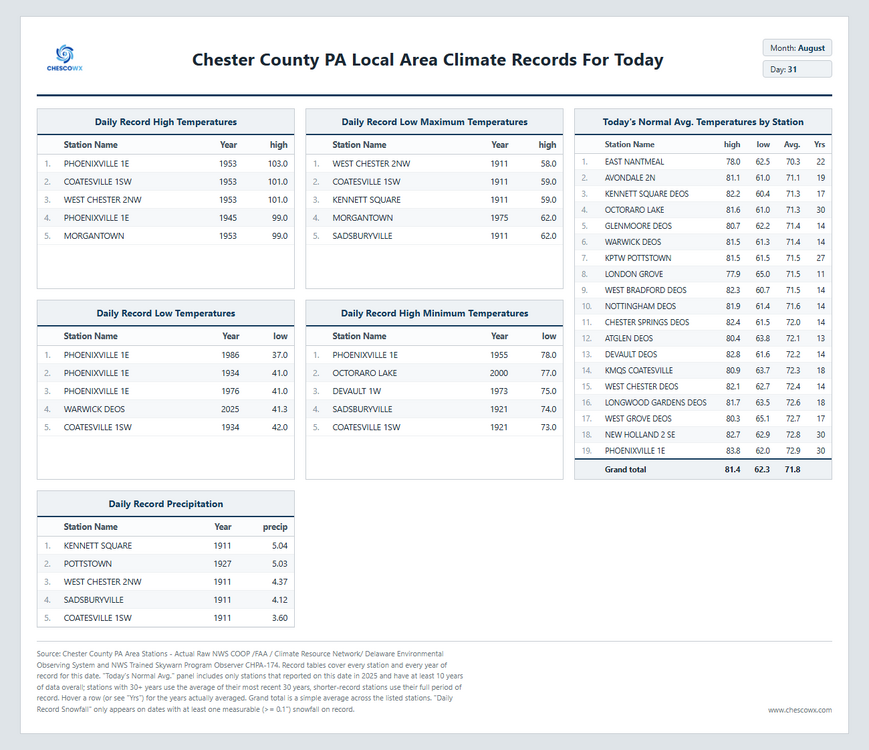
Warm, humid with some showers possible for much of the week before we turn much cooler and clearer by the end of the work week and the start of Labor Day Weekend. The warmest day of the week looks to be tomorrow with highs well into the 80's. The best chance of rain will be tomorrow night into Wednesday.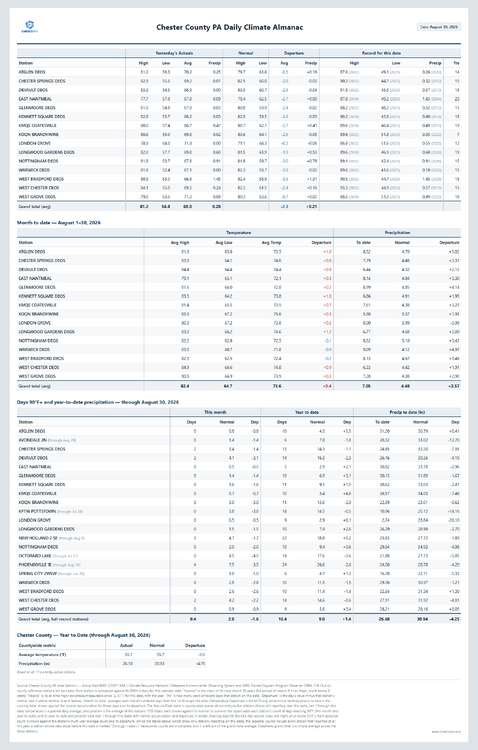
-
Weekly:
-
E PA/NJ/DE Summer 2026 Obs/Discussion
ChescoWx replied to PhiEaglesfan712's topic in Philadelphia Region
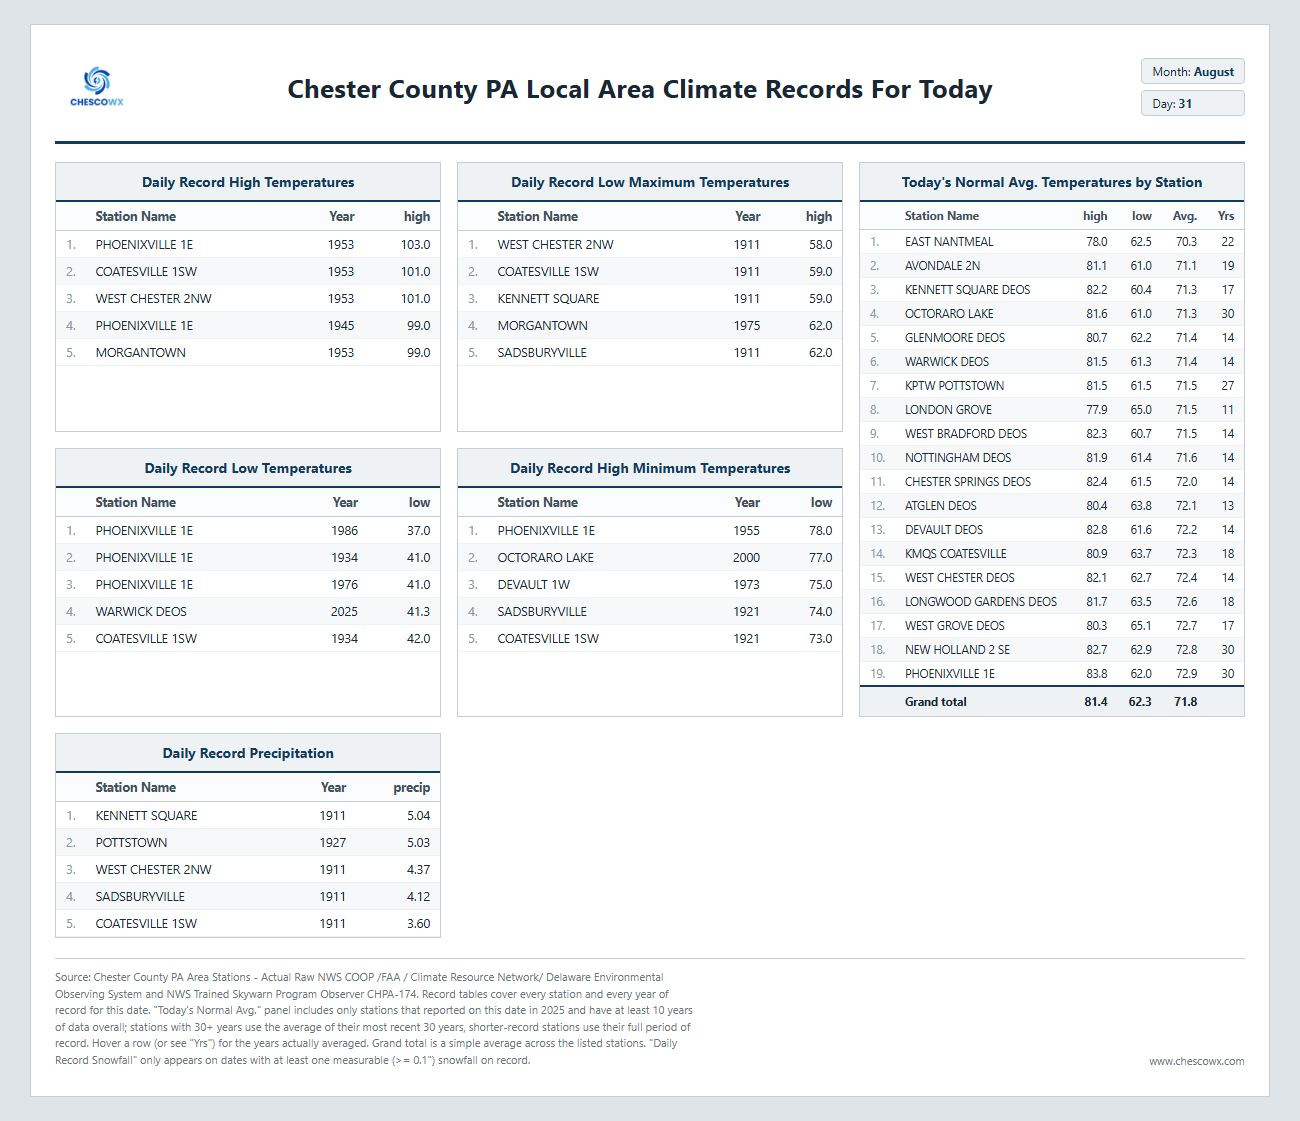
Warm, humid with some showers possible for much of the week before we turn much cooler and clearer by the end of the work week and the start of Labor Day Weekend. The warmest day of the week looks to be tomorrow with highs well into the 80's. The best chance of rain will be tomorrow night into Wednesday.
-
Records: Highs: EWR: 102 (1953) NYC: 100 (1953) LGA: 100 (1953) JFK: 97 (2010) Lows: EWR: 47 (1934) NYC: 50 (1976) LGA: 52 (1976) JFK: 46 (1965) Historical: 1587: Admiral Drake encountered a hurricane at Roanoke Island during the following year. Strong northeast gales caused him and his crew to "cut his cables" and set out to sea. It took six days to regroup after this treacherous storm. (Ref. for Hurricane of 1587) 1886 - A magnitude 7.3 earthquake shook Charleston, South Carolina around 9:50 pm on this day. This earthquake is the most damaging quake to occur in the southeast United States. This earthquake caused 60 deaths and between 5 to 6 million dollars in damage to over 2,000 buildings in the southeastern United States. 1886: The Charleston Earthquake of 1886 was the most damaging quake to hit the Southeastern United States. It occurred at 9:50 p.m. on August 31, 1886, and lasted just under a minute. The earthquake caused severe damage in Charleston, South Carolina, damaging 2,000 buildings and causing $6 million worth in damages, while in the whole city the buildings were only valued at approximately $24 million. Between 60 and 110 lives were lost. Some of the damage is still seen today. It was felt as far away as Boston to the north, Chicago and Milwaukee to the northwest, as far west as New Orleans, as far south as Cuba, and as far east as Bermuda. The earthquake is estimated to have been between 6.6 and 7.3 on the Richter scale with a Mercalli Intensity of X. The 1886 earthquake is a heavily studied example of an intraplate earthquake. The earthquake is believed to have occurred on faults formed during the break-up of Pangaea. (Ref. AccWeather Weather History) 1915 - The temperature at Bartlesville, OK, dipped to 38 degrees to establish a state record for the month of August. (The Weather Channel) 1922 - An incredible hailstorm occurred near West Chester, PA dropped so much hail that fields were covered with up to two feet of drifted hail the next day. 1934: A cool 49° minimum temperature equaled August record set on 24th in 1890 in Washington, DC. (Ref. Washington Weather Records - KDCA) A cool 46° minimum is the lowest August temperature on record for Richmond, VA. (Ref. Richmond Weather Records) Boston, Massachusetts recorded its highest pressure 30.48 inches of mercury for the month of August. (Ref. NOAA Boston Weather Events) 1935 - The most intense hurricane to make landfall was a modest tropical depression on this day. Called the Labor Day Hurricane, this storm went through phenomenal intensification to become a Category 5 hurricane by September 2nd. 1936: Among the many heat-related records established during the summer of 1936 was the number of days with highs 90° or above. Springfield, IL reported 69 such days during the year, 57 of which occurred between June and August. At Peoria, IL the total for the year was 64, a few days shy of the record of 68 degrees set in 1887. It was the hottest month ever recorded in Oklahoma City, OK with an average temperature of 88.7°. This is 7.5° above the normal for August, and 0.4° warmer than the second hottest months, a tie between July 1980 and July 1934. Also, the two hottest daily temperatures ever recorded in August in Oklahoma City occurred in 1936, along with the warmest daily minimum temperature ever recorded in the city. Many of the daily record highs set in 1936 are still records for their respective dates. (Ref. Wilson Wx. History) 1949: Earliest snowfall known for Minnesota. A trace of snow fell at the new Duluth, MN Airport. (Ref. AccWeather Weather History) 1953: Areas from the upper Plains, Midwest and Great Lakes to the East Coast were in the midst of a late summer heat wave that continued into early September. Record highs included: Richmond, VA: 102°, Baltimore, MD: 102°, Newark, NJ: 102°, Bismarck, ND: 101°, Louisville, KY: 101°, Rockford, IL: 101°, Huntington, WV: 101°, Wilmington, DE: 101°, Philadelphia, PA: 101°, St. Louis, MO: 100°, Paducah, KY: 100°, New York (Central Park), NY: 100°, New York (LaGuardia Airport), NY: 100°, Washington, DC: 100°-Tied, Chicago, IL: 99°, Hartford, CT: 98°, Cincinnati, OH: 98°-Tied, Atlantic City, NJ: 97°, Boston, MA: 97°, Beckley, WV: 94°-Tied, Elkins, WV: 92 °F.(Ref. Many Additional Temperatures Listed On This Link) 1954 - Hurricane Carol swept across eastern New England killing sixty persons and causing 450 million dollars damage. It was the first of three hurricanes to affect New England that year. (David Ludlum) 1964: 11.40 inches of rain fell at Norfolk, VA, from Hurricane Cleo, setting their all-time 24 hour rainfall record. (Ref. AccWeather Weather History) 1967: Hurricane Kathleen brought a 3-day barrage of wind and storm surge to the Mexican coast, destroying the town of San Felipe and leaving 2,500 people homeless while sinking 60 vessels. (Ref. Wilson Wx. History) 1971 - The low of 84 degrees and high of 108 degrees at Death Valley, CA, were the coolest of the month. The average daily high was 115.7 degrees that August, and the average daily low was 93.4 degrees. (The Weather Channel) 1974: Idabel, Okla.--Lightning struck and killed a 9- year-old boy while he was playing in his treehouse. (Ref. Lightning-The Underrated Killer.pdf) 1979: Hurricane David brought over $1 billion dollars in damage to Santo Domingo in the Dominican Republic and killed over 1,200 people. Before making landfall, the Category 5 storm had maximum sustained winds of 175 mph. (Ref. Wilson Wx. History) 1984 - Lightning ignited several forest fires in Montana, one of which burned through 100,000 acres of timber and grassland. (The Weather Channel) 1985: Hurricane Elena stalled off the coast of West Central Florida. More than 300,000 residents fled their homes. Although Elena never came closer than 80 miles to the Tampa Bay area, its 40 to 50 mph sustained winds caused tides 6 feet above normal on the beaches and 7 feet above normal in the bay. The storm killed 4 people, destroyed more than 250 homes and damaged thousands of others before reversing course and coming ashore in Mississippi. Total damages to man-made property in Florida were estimated at $213 million dollars. (Ref. AccWeather Weather History) 1987 - Eight cities in Washington and Oregon reported record high temperatures for the date, including Eugene OR and Portland OR with afternoon highs of 102 degrees. The high of 102 degrees at Portland smashed their previous record for the date by twelve degrees. Frost was reported in South Dakota. Aberdeen SD established a record for the month of August with a morning low of 32 degrees, and Britton SD dipped to 31 degrees. (The National Weather Summary) 1988 - August ended on a relatively mild and tranquil note for most of the nation. Forest fires in the northwestern U.S. scorched 180,000 acres of land during the last week of August. (The National Weather Summary) 1989 - Thunderstorms developing along a stationary front spread severe weather from Minnesota to Indiana through the course of the day and night. Thunderstorms in Minnesota produced baseball size hail near Saint Michael and Hutchinson, and drenched Moose Lake with nine inches of rain in six hours. Tucson AZ hit 100 degrees for a record 79th time in the year, surpassing a record established the previous year. (The National Weather Summary) (Storm Data) 1991: Portland, ME ended up with 15.22 inches of rain for the month, setting a new all-time monthly rainfall record for any month. The old record was 13.50 inches set in November 1983. (Ref. Wilson Wx. History) 1993: Hurricane Emily raked the North Carolina Outer Banks. Winds reached 98 mph at the Cape Hatteras Weather Service Office along with 7.51 inches of rain. Another anemometer in the area recorded a wind gust to 107 mph. Diamond Shoals Coastal Marine Buoy was in the eye and recorded a low pressure of 964 millibars or 28.47 inches of mercury. After the eye passed, sustained winds hit 103 mph with a peak gust of 148 mph. (Ref. AccWeather Weather History) 1997: This year was only the third year in recorded history that no tropical storm occurred in August. The other two years were 1941 and 1961. (Ref. AccWeather Weather History) 1999: Residents of the low-lying North Carolina Outer Banks were on the run for a second time as unpredictable Hurricane Dennis. Dennis continued to perplex weather forecasters by lumbering back toward the coast after heading out to sea the day before. As the hurricane retrograded, blocked by high pressure, gale force winds and 14 foot seas pounded the coast. Roads were under water along Hatteras Island. At least 7 inches of rain fell in Brunswick County, North Carolina. (Ref. Wilson Wx. History) 2004: Hurricane Gaston made landfall north of Charleston, SC on Sunday morning 29 August 2004. It weakened to a tropical depression as it moved north into North Carolina. Rainfall in North Carolina was generally in the 50 to 100 mm (2-4 inches) range. During the early morning of 30 August 2004, Gaston was losing strength and no flooding rain was anticipated for Virginia. Later, as the storm moved across southern and central Virginia, supercell thunderstorms developed evolving into a very heavy rain event for central Virginia. Gaston strengthened back to a tropical storm as it moved off the Delmarva coast early 31 August 2004. The maximum unofficial rainfall report was 324 mm (12.60 inches) recorded in the city of Richmond, VA. (Ref. Monthly Weather Review)Richmond International Airport recorded 16.30 inches of rain for August making it the third wettest month on their records back to 1871. (Ref. Richmond International Airport Records) 179 tornadoes occurred for the month in the U.S. to set a new record for most tornadoes in August. (Ref. Wilson Wx. History) 2017: Harvey was a Category 4 hurricane at its peak. On Tuesday afternoon the 29th, the Mont Belvieu industrial suburb east of Houston recorded 51.12 inches of water, breaking the highest previous record of 48 inches from 1978’s Tropical Storm Amelia in Medina, Texas. Hurricane Harvey was the first major hurricane[nb 1] to make landfall in the United States since Wilma in 2005, ending a record 12-year period with no major hurricanes making landfall in the United States. In a four-day period, many areas received more than 40 inches (1,000 mm) of rain as the system meandered over eastern Texas and adjacent waters, causing catastrophic flooding. With peak accumulations of 51.88 in (1,318 mm), Harvey is the wettest tropical cyclone on record in the contiguous United States. The resulting floods inundated hundreds of thousands of homes, displaced more than 30,000 people, and prompted more than 17,000 rescues. The eighth named storm, third hurricane, and the first major hurricane of the 2017 Atlantic hurricane season. Harvey has caused at least 51 confirmed deaths; 1 in Guyana, and 50 in the United States. Catastrophic inland flooding is ongoing in the Greater Houston metropolitan area. FEMA director Brock Long called Harvey the worst disaster in Texas history, and expected the recovery to take many years. Preliminary estimates of economic losses range from $30 billion to $150 billion, with a large portion of the losses sustained by uninsured homeowners. “This is as catastrophic as you could possibly imagine from a Category 4 storm.” (SE,TX After 30 to 45 inches of rain and more to come)