All Activity
- Past hour
-
 DCA _ NYC _ BOS _ ORD _ ATL _ IAH _ DEN _ PHX _ SEA 1.8 1.6 1.8 0.4 0.5 0.8 1.8 -0.2 -0.2
 -
NYC METRO AREA – ALL-TIME TOP HIGHEST TEMPERATURES ============================================================ NEWARK LIBERTY INTERNATIONAL AIRPORT (EWR) ============================================================ Rank Temperature Date 1 108°F Jul 22, 2011 2 105°F Jul 3, 1966 2 105°F Jul 4, 1949 2 105°F Jul 8, 1993 2 105°F Jul 10, 1993 2 105°F Aug 7, 1918* 2 105°F Aug 9, 2001 2 105°F Sep 2, 1953 3 104°F Jul 9, 1993 3 104°F Jul 15, 1995 4 103°F Jun 30, 2021 4 103°F Jun 24, 2025 ============================================================ CENTRAL PARK (NYC) ============================================================ Rank Temperature Date 1 106°F Jul 9, 1936 2 104°F Jul 21, 1977 2 104°F Jul 22, 2011 2 104°F Aug 7, 1918 3 103°F Jul 3, 1966 3 103°F Jul 6, 2010 3 103°F Aug 9, 2001 3 103°F Aug 26, 1948 4 102°F Sep 2, 1953 4 102°F Jul 10, 1993 4 102°F Jul 4, 1949 4 102°F Jul 8, 1936 ============================================================ LAGUARDIA AIRPORT (LGA) ============================================================ Rank Temperature Date 1 107°F Jul 3, 1966 2 104°F Jul 22, 2011 2 104°F Aug 9, 2001 3 103°F Jul 6, 2010 3 103°F Jul 15, 1995 3 103°F Aug 26, 1948 4 102°F Aug 2, 2006 4 102°F Sep 2, 1953 5 101°F Jun 24, 2025 5 101°F Jun 13, 2017 5 101°F Jul 18, 2012 5 101°F Jul 7, 2010 ============================================================ JOHN F. KENNEDY INTERNATIONAL AIRPORT (JFK) ============================================================ Rank Temperature Date 1 104°F Jul 3, 1966 2 103°F Jul 22, 2011 3 102°F Jun 25, 2025 3 102°F Jun 24, 2025 3 102°F Jul 23, 2011 3 102°F Jul 5, 1999 3 102°F Jul 1, 1963 4 101°F Jul 18, 2012 4 101°F Jul 6, 2010 4 101°F Jul 4, 2010 4 101°F Jul 9, 1993 4 101°F Aug 27, 1948 ============================================================ PHILADELPHIA (PHL) ALL-TIME TOP HIGHEST TEMPERATURES ============================================================ Rank Temperature Date 1 106°F Aug 7, 1918 2 104°F Jul 10, 1936 2 104°F Jul 3, 1966 3 103°F Jul 2, 1901 3 103°F Jul 21, 1930 3 103°F Jul 9, 1936 3 103°F Jul 4, 1966 3 103°F Jul 7, 2010 3 103°F Jul 15, 1995 3 103°F Jul 22, 2011 4 102°F Jul 23, 2011 4 102°F Jul 8, 2012 4 102°F Aug 9, 2001 4 102°F Sep 2, 1953 4 102°F Jul 8, 1993 4 102°F Jul 20, 1991 4 102°F Jul 6, 1999
-
My total for June 3.10" Highest temp 93....lowest 50.
-
EWR top temps last 8 years Year #1 #2 #3 #4 #5 2025 103° (Jun 24) 101° (Jun 23) 101° (Jun 25) 101° (Jul 29) 100° (Jul 8/25/30 tie) 2024 100° (Jun 21) 100° (Aug 1) 99° (Jun 23) 99° (Jul 16) 98° (Jun 26/Jul 15 tie) 2023 97° (Sep 6) 96° (Jul 27) 96° (Sep 7) 95° (Jul 12) 95° (Jul 28/Sep 5 tie) 2022 101° (Aug 9) 99° (Jul 1) 99° (Aug 8) 98° (May 31) 98° (Jul 12/Aug 4 tie) 2021 103° (Jun 30) 102° (Jun 29) 99° (Jun 28) 99° (Aug 13) 98° (Aug 12) 2020 96° (Jul 19) 96° (Jul 20) 95° (Jul 2) 95° (Jul 5) 94° (Jul 3) 2019 99° (Jul 21) 98° (Jul 20) 97° (Jul 19) 96° (Jul 5) 96° (Jul 22) 2018 98° (Jul 2) 97° (Aug 29) 96° (Aug 28) 95° (Jul 5) 95° (Jul 4) NYC Year #1 #2 #3 #4 #5 2025 99° (Jun 24) 97° (Jul 29) 96° (Jun 23) 96° (Jun 25) 95° (Jul 30 / Jul 25 tie) 2024 95° (Aug 1) 95° (Jun 21) 94° (Jul 16) 93° (Jun 22) 93° (Jul 15 tie) 2023 93° (Sep 7) 93° (Sep 6) 93° (Jul 5) 92° (Sep 5) 92° (Jul 28 tie) 2022 97° (Aug 9) 96° (Jul 24) 95° (Jul 20) 95° (Jul 21) 94° (Aug 4) 2021 98° (Jun 30) 97° (Jun 29) 95° (Aug 13) 94° (Aug 12) 93° (Jul 8) 2020 96° (Jul 6) 94° (Jul 19) 93° (Jul 28) 93° (Jul 27) 93° (Jul 20) 2019 95° (Jul 21) 95° (Jul 20) 93° (Oct 2) 93° (Jul 17) 92° (Jul 30) 2018 96° (Jul 1) 95° (Jul 2) 94° (Aug 28) 93° (Sep 6) 93° (Jul 10 / Jun 30 tie) LGA Year #1 #2 #3 #4 #5 2025 101° (Jun 24) 100° (Jul 29) 99° (Jul 30) 99° (Jul 25) 99° (Jun 25) 2024 97° (Jul 16) 97° (Jul 15) 97° (Jun 21) 96° (Jul 31) 95° (Aug 1) 2023 96° (Sep 7) 95° (Jul 27) 94° (Jul 28) 94° (Jul 5) 93° (Sep 6) 2022 98° (Aug 9) 98° (Jul 24) 97° (Jul 23) 97° (Jul 21) 97° (Jul 20) 2021 100° (Jun 30) 98° (Aug 13) 98° (Aug 12) 98° (Jun 29) 96° (Jul 7) 2020 97° (Jul 28) 97° (Jul 27) 97° (Jul 20) 97° (Jul 19) 96° (Jul 30) 2019 100° (Jul 21) 99° (Jul 20) 95° (Oct 2) 95° (Jul 30) 95° (Jul 19) 2018 98° (Aug 28) 97° (Aug 29) 97° (Jul 10) 97° (Jul 1) 96° (Sep 6) JFK: Year #1 #2 #3 #4 #5 2025 102° (Jun 25) 102° (Jun 24) 96° (Jul 29) 95° (Jul 30) 93° (Jul 28) 2024 95° (Aug 28) 93° (Aug 1) 91° (Aug 2) 91° (Jul 31) 91° (Jun 25) 2023 93° (Sep 6) 93° (Sep 5) 92° (Sep 7) 92° (Jul 27) 91° (Jul 28) 2022 96° (Jul 24) 96° (Jul 23) 95° (Jul 22) 95° (Jul 20) 94° (Jul 19) 2021 94° (May 22) 93° (Aug 27) 92° (May 23) 91° (Aug 24) 91° (Aug 14) 2020 97° (Jul 20) 94° (Jul 27) 93° (Jul 28) 93° (Jul 26) 92° (Aug 27) 2019 99° (Jul 21) 99° (Jul 20) 95° (Oct 2) 93° (Jul 14) 91° (Jun 27) 2018 94° (Jul 1) 93° (Sep 4) 92° (Aug 30) 92° (Aug 29) 91° (Jul 2)
-
 It's actually not the convective element up there the NAM's using. It's actually just erupting a smattering of convection over and E of the Tug Hill country of N NYS, from diurnal instability, and then quasi converting the mass of it all into a very steeply arc tan angled right turn. I don't wanna trash the idea of some convective response today, entirely. The NAM used to be the ETA, and when it was the ETA, it was a superior ( lesser known) skilled tool for convective initiation. Basically, it's QPF smatters that we largely think of as noise tended to be eerily on point. I've never look to see if the NAM may have inherited that same trait - might be a testing op. Anyway, the broad synoptic illustration would argue suppression but this isn't absolute, either.
 -
Records: Highs: EWR: 100 (1963) NYC: 100 (1901) LGA: 97 (2018) JFK: 102 (1963) Lows: EWR: 52 (1943) NYC: 52 (1943) LGA: 56 (1988) JFK: 56 (1988) Historical: 1792 - A tremendous storm (a tornado or hurricane) hit Philadelphia and New York City. Many young people were drowned while out boating on that Sunday. (David Ludlum) 1814: A tornado crossed Saint Helena Sound in South Carolina, drowning 23 people who were out on the sound in ships. (Ref. Wilson Wx. History) 1876: In the Douglas, WI area, a 25 square mile ice field was still in existence at the head of Lake Superior. (Ref. Wilson Wx. History) 1891: The U.S. Weather Bureau was born as the equipment, stations and personnel of the U.S. Army Signal Service were passed to the new agency, which was part of the Department of Agriculture. (Ref. Wilson Wx. History) 1911 - The high of just 79 degrees at Phoenix AZ was their coolest daily maximum of record for the month of July. The normal daily high for July 1st is 105 degrees. (The Weather Channel) 1915: Pawtucket, RI received a deluge of rain containing 5.10 inches in 24 hours, beginning a very wet July for the area. (Ref. Wilson Wx. History) 1933: Lightning struck the Texas Oil Company plant near Elizabeth, NJ causing 300,000 barrels of oil to go up in flames. (Ref. Wilson Wx. History) 1953: A severe thunder squall struck parts of Grand Island, the Tonawandas, and north Buffalo, NY during the evening. Destructive winds at the airport of 59 mph, heavy rain with one inch in a 10-minute period, and hail caused damage estimated around $2 million dollars. (Ref. Wilson Wx. History) 1972: The Lake Creek community, just north of Granite in Greer County, Oklahoma was pounded by a severe thunderstorm. The storm produced 2.5 inch diameter hail, winds 75 mph, and 2.25 inches of rain. (Ref. Wilson Wx. History) 1974: Larimer County, Colo.--A girl was killed by lightning at the Iceberg Lake parking area at 12,000 feet above mean sea level on Trail Ridge Road. (Ref. Lightning-The Underrated Killer.pdf) 1979 - It snowed almost half a foot (5.8 inches) at Stampede Pass WA, a July record. (The Weather Channel) 1981: Tropical storm Bret formed well off the North Carolina coast, but moved toward the west then northwest across the mouth of the Chesapeake Bay and into Virginia. Philadelphia, PA received 0.49 inches of rain. (Ref. Wilson Wx. History) 1986: Chadron, NE was struck by a severe thunderstorm with large hail and 80 mph winds. An automobile dealership had its windows blown out and many buildings had large holes punched in their roofs by the hailstones. (Ref. Wilson Wx. History) 1987 - Lake Charles LA was drenched with a month's worth of rain during the early morning. More than five inches of rain soaked the city, including 2.68 inches in one hour. A thunderstorm in the southern Yakima Valley of Washington State produced high winds which downed trees up to six feet in diameter. (Storm Data) (The National Weather Summary) 1988 - Twenty-six cities in the north central and northeastern U.S. reported record low temperatures for the date. Lows of 48 degrees at Providence RI, 48 degrees at Roanoke VA, 49 degrees at Stratford CT, and 48 degrees at Wilmington, DE, were records for the month of July. Boston MA equalled their record for July with a low of 50 degrees. Five inches of snow whitened Mount Washington NH. (The National Weather Summary) 1989 - Showers and thunderstorms associated with the low pressure system which was once Tropical Storm Allison continued to drench parts of Mississippi, Louisiana and eastern Texas. Late night thunderstorms produced 12.58 inches of rain at Biloxi, MS, in six hours, and 10.73 inches at Gulfport MS. Flooding in Mississippi over the first six days of the month caused 55 million dollars damage. (The National Weather Summary) (Storm Data) 1991: Two inches of rain fell in 30 minutes about 3.5 miles south southeast of Trousdale, KS. The heavy rain washed out roads and left water holes that measured 100 feet long. (Ref. Wilson Wx. History) 1993: Not a good place to be. Hail as large as 2 inches in diameter plummeted the Bismarck North Dakota vicinity for more than 20 minutes. Three girls were stranded in the swirling waters of the Missouri River during the vicious hailstorm. All three were injured by the hailstones. (Ref. Weather Guide Calendar with Phenomenal Weather Events 2007 Accord Pub. 2006, USA) (Weather Guide Calendar with Phenomenal Weather Events 2011 Accord Pub. 2010, USA) 1994: A microburst over the south side of Cheyenne, WY blew windows out of 15 cars. (Ref. Wilson Wx. History) 1995: A 53-year-old male golfer was killed instantly at the Ibis Golf & Country Club 9 miles northwest of Palm Beach, FL, when lightning struck his 7-iron on the follow through, after a foursome had halted play because of lightning in the area. The lightning struck when the group resumed play.(Ref. Wilson Wx. History) 2002: San Antonio, Texas recorded 9.52 inches of rain on this day to set a new record for its greatest rainfall for the entire month of July. 2003: A few secondary roads were under 6 inches of water 5 miles north east of Rose Hill in Jasper County, MS. Several secondary roads were underwater along with a few streets flooded in Stonewall and Quitman. Heavy rains caused several streams to flood and cover portions of a few roads in Meridian, MS. These events were associated with Tropical Storm Bill. (Ref. Wilson Wx. History)
-
 I am really curious to see how it unfolds. I totally agree the rising heights are a big negative in this, on the other hand, if we are pushing MLCAPE values >2500-3000 J and get any sort of subtle energy rotating through aloft, is even subtle energy enough to set things off? I think that's why I'm intrigued in this. If we were dealing with MLCAPE that was only like 1500 I probably wouldn't be as intrigued.
 -
One saving grace during this heat wave will be somewhat lower humidity will lend to heat index’s staying in advisory territory. Will be damn hot but at least we won’t have the normal humidity to deal with too
-
80 / 68 the heat is on day 3 / 2 / 1 of the heatwave pending on where you are today. Mid / upper 90s in the hottest areas. Century mark Thu - Sat in the hottest locals with isolated storms Friday and scattered storms on the sat 4th but still think most get their fireworks off and have a mainly dry day. Sun / Mon dealing with the front and localized some heavy rain. Sunday a matter of how much sun gets through to extend the heatwave otherwise Monday locked in the 80s or 70s pending on the rain. Clear out / dry out Tue and fall back near normal overall 7/7 - 7/15 (straggler 90s if any) with next surge of heat building out west and expanding east by mid month massive ridge builds into the west and expands east the second half of July. 7/1 - 7/5 : Hot - Peaking 7/1- 7/4, 7/5 storms 7/5- 7/6 : Storms front 7/7 - 7/15 : Overall near normal maybe a 90 or two stragglers 7/16 - beyond : Warm - hot - overall - next heat push
-
I could be wrong about this, but I doubt it means much down here. Perhaps NNE... but even there, the building heights that begin the main surge today, that's a neg interference. We'll see.
-
Approximately lol. I think it has more to do with getting the measurement point reasonably high enough so that heat from near the surface has less influence. My station is probably 4 1/2 feet. Having it in shade is a bigger deal. A radiation shield and proper ventilation can minimize errors when in direct sun.
-

2026-2027 Super El Nino
GaWx replied to Stormchaserchuck1's topic in Weather Forecasting and Discussion
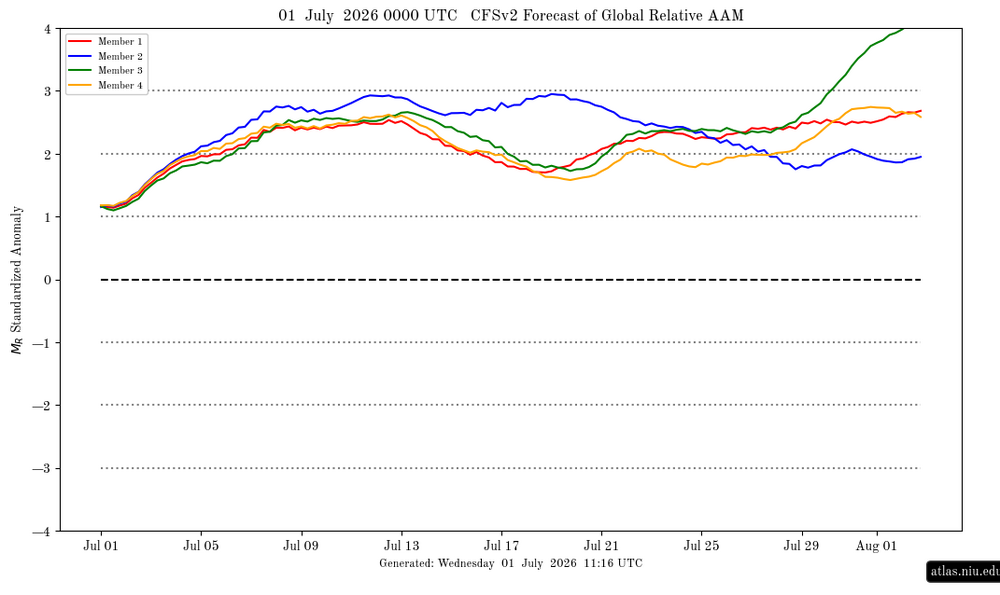
The CFS AAM forecast at the site I follow just updated for the first time in 6 days: Prior run there is 0Z of 6/25: strongest multi week mean I’ve ever seen/saved with it way up at a mean of +2.8 to +3.3 July 8th to end of run, which is July 29th: Brand new run (0Z of 7/1): still a very strong +AAM but not surprisingly no longer to the near record breaking levels of the 0Z 6/25 run as mean is ~+2.5 on July 8th instead of +2.8, mean then has a near term peak of ~+2.65 on July 12th-13th, and then it’s mainly low to mid +2s July 14-29th instead of +2.8 to +3.3: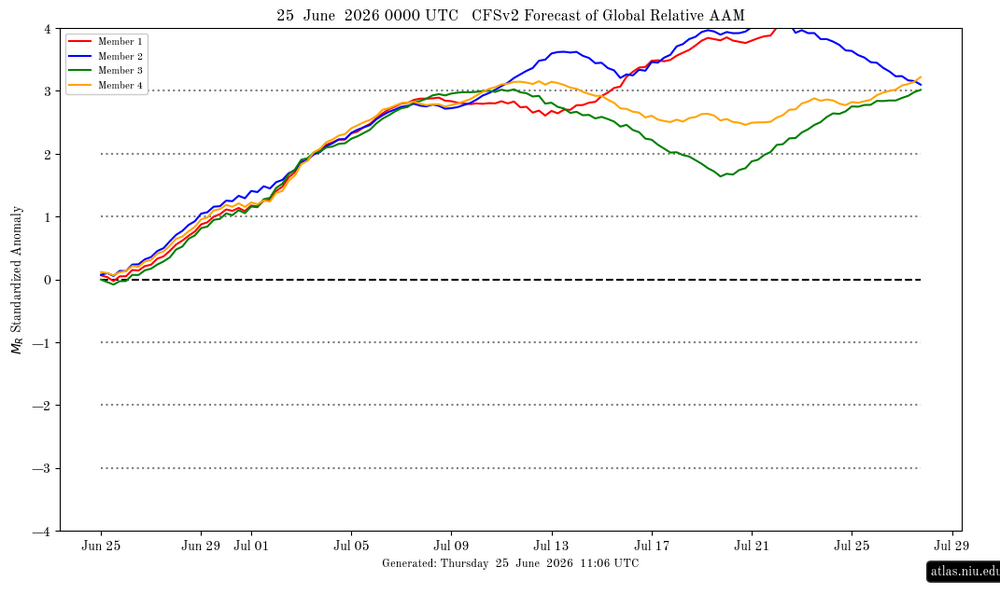
-

2026-2027 Super El Nino
40/70 Benchmark replied to Stormchaserchuck1's topic in Weather Forecasting and Discussion
I tried to clarify this yesterday...but all I mean when I call it "basin-wide" is just that-the intense anomalies are not relegated to only the east. Yes, they are strongest in the east, but given the magnitude it doesn't really matter. This is why the most intense El Nino events are all warm...because it spills into the eastern zones. Well, same situation here....we aren't getting a cold season because there is so much warmth in the eastern zones, but there is enough in the central and western flank to introduce some variability. I am not trying to imply that this is an excuse to forecast a 2002-2003 redux in the seasonal mean because there is too much warmth too far east-but what I am favoring is a warm overall season with some episodes of MC and Modoki forcing mixed in. Thus this is what I am trying to convey with any mentions of the 2002 and 2009 analogs, not a redux of those particular seasons. This is why why we have analog COMPOSITES. I agree that anyone forecasting a season as cold as 2002 is delusional, but that doesn't mean the analog can not be incorporated into a composite. -
Yeah..that'll be a fun test tonight and more likely tomorrow night. Do the climo-favored warm nocturnal therm sites hold 80+ ? It seems to me that's a tough one. It happens from time to time, but it seems more usual to end up with a 5 minute, 78.4 or 79.4 blip on an otherwise 80 80 80 ... 80 score card.
-
It's going to be an interesting afternoon I think in terms of convective development. Have to watch this area here. Not a ton going on right now but the NAM seems to blossom from this.

-
 RRFS, MSSL, ARW
 -
Hi res is higher
-
Heat kicks into high gear today and peaks tomorrow and Friday. June rainfall here was 5.51". Got lucky with a rather localized heavier total. Y.T.D. = 23.82. Some places far below these number across the metro area.
-

2026-2027 Super El Nino
mitchnick replied to Stormchaserchuck1's topic in Weather Forecasting and Discussion
I'm inland at 600', but the hills to my N & NE would be the better spot. Of course, if that was to happen, I'd say it would then be a shutout for most until January. -
Euro is super wet Monday
-
 Which model?
 -
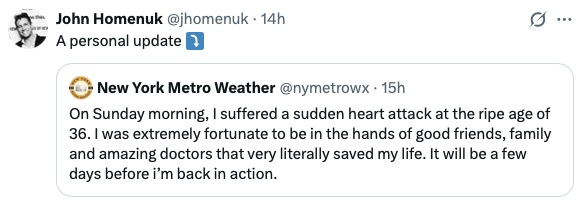
Came across this kind of by accident just now. This is "Earthlight" who used to be a regular and great poster on this forum. Wishing him well. Way too young for this. Jeez.
-
MOS/NBM are 76/77. But I'll say they get to 78
-
2026-2027 Super El Nino
40/70 Benchmark replied to Stormchaserchuck1's topic in Weather Forecasting and Discussion
Yea, I agree. Probably higher and deeper into the interior than my locale. -
no ... I think you're gonna find that no amount of distaste for heat, hot patterns, or those that like to rhetorically emphasize the significance of it... will change the reality that these are not very interfering, typical nocturnally enhance cloud types that are in the process ( like normal ...) of melting away with the diurnal processing of the sun - already evidence on high res sat. Heights are rising. That's intrinsically a DVM exertion. This will be a suppressive cloud factor as the day goes forward. Probably there will be mainly sunny conditions from 11 ... 11:30 on if not sooner. Should expect full realization of at least machine numbers. Probably a mean of 94 with outliers higher. Given the thrust of ridge bulging for the next 36 or so hours .. this will neg interfere with MCS mechanisms. I believe that MCS is not as much of a risk going forward until the other side, when we see the evolution of this ridge receding over the weekend. Perhaps Friday night?