All Activity
- Past hour
-
Yeah, needing a classic summer few days of nighttime MCS's; but those seems to be a things of the past.
-
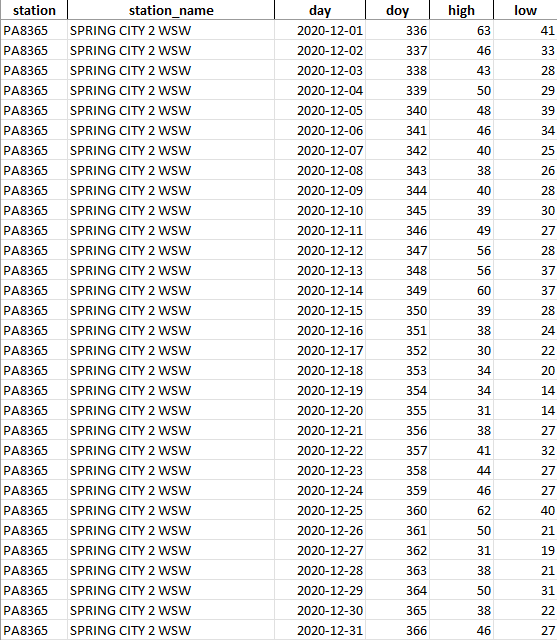
 Looks like some more recent ghost station activity being captured....this time at the newest COOP Location in Chester County PA. Station SPRING CITY 2 WSW, PA which began it's first ghastly estimated data on January 1, 2020.....yet the first actual true temperature record was not made for almost 3 and 1/2 years later or 40 months later in late May of 2023! Below is the NOAA COOP report from December 2020 and then the ghost data now incorporated for estimations.
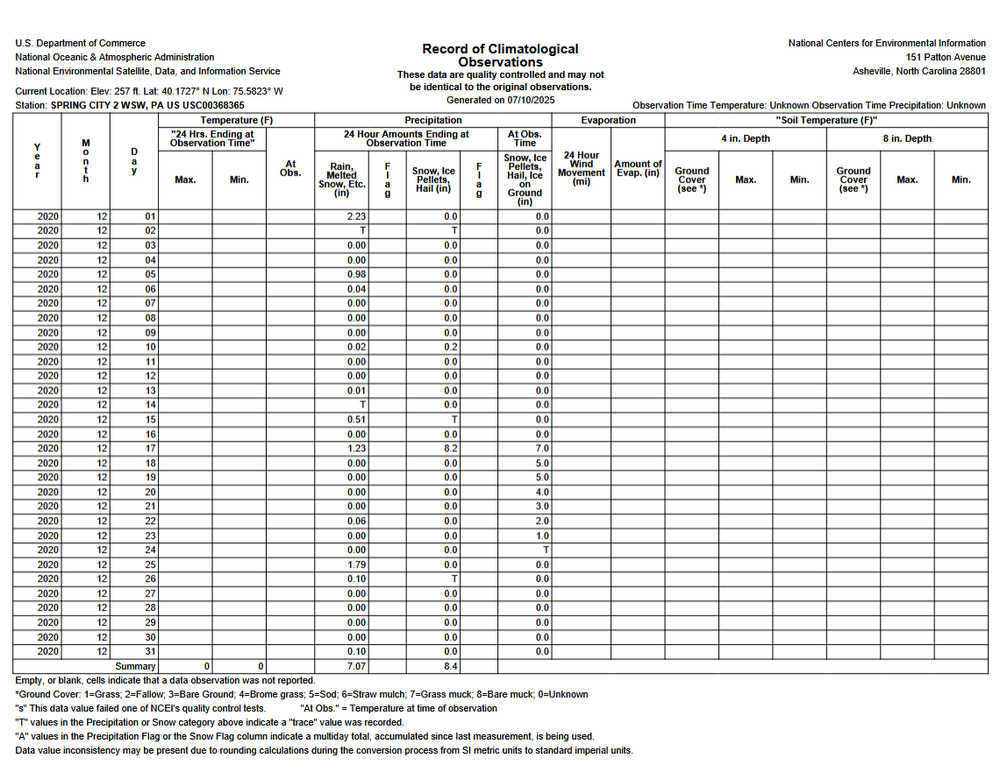
-
I signed a contract for a new roof so it can stop raining for 3 o4 so weeks so it can get put on kthnx Also anyone want to gift me cash? Ha!
-
Implies SE ridge dominance?
-

2025-2026 ENSO
Stormchaserchuck1 replied to 40/70 Benchmark's topic in Weather Forecasting and Discussion
July Euro seasonal forecast for NDJ (that's as far out as I saw it go) -

July 2025 Discussion-OBS - seasonable summer variability
rclab replied to wdrag's topic in New York City Metro
Liberty you’re amazing. You can post and landscape at the same time. Stay well, as always ….. -
The exception was S and E of the I-95 corridor; the storms just couldn't make much progress past there. I got brushed with 0.17". Hoping for more today (although hoping the places which have been inundated stay dry)
-
Climate Alarmists really are a tolerant bunch....fortunately we are starting to get more and more young meteorology professionals like Chris! Sadly, there are many older and younger professionals that Chris and I speak with in private....who share our concern about the damage being done by climate alarmists and zealots. Yet they feel forced to remain silent with their dissenting views that there is in fact no climate emergency at all. Fortunately the tide is turning and folks are coming back to common sense and calm around our always changing climate! https://freebeacon.com/policy/im-a-young-meteorologist-who-questioned-the-idea-of-man-made-climate-change-the-climate-zealots-wanted-me-punished-silenced-and-expelled/
-

July 2025 Obs/Disco ... possible historic month for heat
CoastalWx replied to Typhoon Tip's topic in New England
I'll burn everything from I-91 east if that happens. -
July 2025 Obs/Disco ... possible historic month for heat
rclab replied to Typhoon Tip's topic in New England
….. and harder too ….. as always …..
-

July 2025 Obs/Disco ... possible historic month for heat
Damage In Tolland replied to Typhoon Tip's topic in New England
He”ll be back this winter there -
July 2025 Obs/Disco ... possible historic month for heat
CoastalWx replied to Typhoon Tip's topic in New England
His webbed hand pushing me down gone limp...like the Alien's arm coming out of the space ship at the end of War of the Worlds -
Looking good EJ

-
EWR has three more 90 degree days than PHL lol
-

July 2025 Discussion-OBS - seasonable summer variability
LibertyBell replied to wdrag's topic in New York City Metro
I noticed 1967 is on this list too, it came right after the historic 1966 summer! This follows a common pattern: we get a great hot summer (1966), then a great snowy winter (1966-67), followed by a dud summer (1967) followed by a dud winter (1967-68) we get a great hot summer (1995), then a great snowy winter (1995-96), followed by a dud summer (1996) followed by a dud winter (1996-97) -

July 2025 Discussion-OBS - seasonable summer variability
Brian5671 replied to wdrag's topic in New York City Metro
looks done. models show little to nothing and sun is starting to poke through in some places -
July 2025 Discussion-OBS - seasonable summer variability
LibertyBell replied to wdrag's topic in New York City Metro
Yes, looks like today is the only cloudy day. No rain during the day either, we did have some last night but it's been dry since I woke up this morning. -

July 2025 Obs/Disco ... possible historic month for heat
Torch Tiger replied to Typhoon Tip's topic in New England
Stein dead and buried there -
Thanks Tim!!! Correct will update formula and going forward - also need to update the normal number - great catch - thanks again!!
-
July 2025 Discussion-OBS - seasonable summer variability
LibertyBell replied to wdrag's topic in New York City Metro
Yes, and these so-called *fees* are being used to line their own pockets, this is what Hochul pointed out yesterday. All those profits go right to their execs and shareholders. They remind me of Big Pharma and their overpriced meds, both are vultures who feed off the underprivileged. -
July 2025 Discussion-OBS - seasonable summer variability
LibertyBell replied to wdrag's topic in New York City Metro
It's their fault in the sense of how much money their execs and shareholders make, they get fat on our backs. We need a salary cap for execs too. -
July 2025 Discussion-OBS - seasonable summer variability
LibertyBell replied to wdrag's topic in New York City Metro
Hochul pointed this out as why she was against Con Ed increasing costs, the execs get fat on our backs. exec salaries should be chopped in half. I would go even further and create a ceiling on how much they can make. -

2025 Atlantic Hurricane Season
BarryStantonGBP replied to BarryStantonGBP's topic in Tropical Headquarters
below average in gta 5 - Today
-
July 2025 Discussion-OBS - seasonable summer variability
LibertyBell replied to wdrag's topic in New York City Metro
I've been doing landscaping work this morning since 9 am and it's actually perfect weather for it. -
2025 Atlantic Hurricane Season
BarryStantonGBP replied to BarryStantonGBP's topic in Tropical Headquarters
it won't happen