All Activity
- Past hour
-

July 2025 Obs/Disco ... possible historic month for heat
dendrite replied to Typhoon Tip's topic in New England
Hopefully you get a foot of rain. -
I'd let it run out to 5 days but day 6-15 should be scrapped-total garbage
-

July 2025 Obs/Disco ... possible historic month for heat
weathafella replied to Typhoon Tip's topic in New England
Particularly when heat and hurricanes are kind of a necessary tandem. -

July 2025 Discussion-OBS - seasonable summer variability
LibertyBell replied to wdrag's topic in New York City Metro
Yes, that's the way we are getting higher average temperatures. High temperatures are going up too, but at a slower rate than low temperatures. I think at some point the high temperatures will flatten out depending on how close you are to the ocean. For example, JFK's average high temperatures will probably flatten out at under 90 but higher than 85 (based on the temperature increase data I've looked at.) While EWR's average high temperatures will probably flatten out at under 95 but higher than 90. -
July 2025 Obs/Disco ... possible historic month for heat
dendrite replied to Typhoon Tip's topic in New England
83.0/67 BKN Loving the daily mid 80s. Perfect. -
July 2025 Discussion-OBS - seasonable summer variability
LibertyBell replied to wdrag's topic in New York City Metro
And several more 90 degree days, JFK is out to a similar lead that they had in 2010. Do you think Central Park should have broken its all time 90 degree day record in 2010 just like JFK, LGA, and EWR did and perhaps even have had more 100 degree days, Don? It would be interesting to do a reanalysis of Central Park's data from 2010 to see if they should have broken the records they set in 1991 and 1993 of 39 90 degree days. -
July 2025 Discussion-OBS - seasonable summer variability
LibertyBell replied to wdrag's topic in New York City Metro
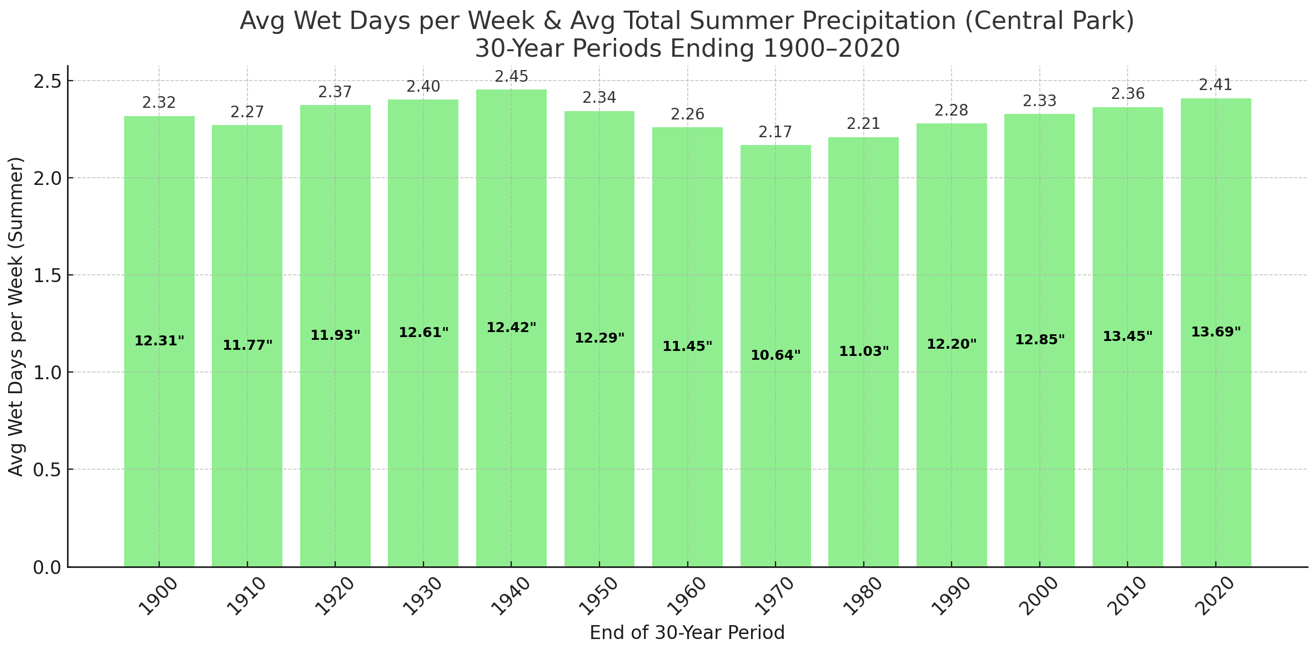
it's amazing how dry 1941-1970 and secondly 1951-1980 were compared to the 30 year periods that came before and after those two periods. No wonder they had so many 100 degree days and 7+ day heatwaves. -

July 2025 Obs/Disco ... possible historic month for heat
Great Snow 1717 replied to Typhoon Tip's topic in New England
Something tells me that you will not be a candidate for the "Best Poster of Summer 2025 Award".. -

July 2025 Obs/Disco ... possible historic month for heat
weatherwiz replied to Typhoon Tip's topic in New England
the is one strong shortwave digging through tomorrow for early July. Convection (CONVECTION NOT SEVERE) should overperform. Thought maybe convergence could be a little meh but it doesn't seem bad. What we really need to watch are dews...if we can pool dews another 3-4F that would make things a bit more interesting for some localized severe weather. -
July 2025 Discussion-OBS - seasonable summer variability
LibertyBell replied to wdrag's topic in New York City Metro
Thanks Don, so the rainfall amounts are still rising even compared to the 1990-2020 period. From 2.41 days per week and average total summer rainfall of 13.69 inches to 2.42 days per week and 13.99 inches of average total summer rainfall for 1995-2024. At this rate the 2001-2030 period should be the first one that averages 14.00 inches of average total summer rainfall. Something else I noted from your graphs, is that although the 1911-1940 period peaked with 2.45 rain days per week, it only averaged 12.42 inches of rain per summer. The driest period was 1941-1970 which was also during our big heatwave/100+ degree bonanza period of the 1940s, 1950s and 1960s (not a coincidence) when we averaged 2.17 rain days per week and only 10.64 inches of rain per summer. The dryness probably led to the extreme heat and longer heatwaves of that era. There is no other 30 year period that comes close to matching 1941-1970 for dryness and the second driest period came right after it, 1951-1980 with 2.21 rain days per week and 11.03 inches average total summer rainfall. All the other periods are near 12 inches of total summer rainfall or above. -
1.85" last 18 hrs. This was a good start for what will be a wet July. 41% of the long-term monthly total during the first 2 days is nothing to sneeze at.
-

July 2025 Obs/Disco ... possible historic month for heat
ineedsnow replied to Typhoon Tip's topic in New England
I hope it messes with the heat coming up -
 nebby joined the community
 -

July 2025 Obs/Disco ... possible historic month for heat
Typhoon Tip replied to Typhoon Tip's topic in New England
that chart does not signify "no sign" - to say so doesn't do this source any help in confidence they know how to interpret -

July 2025 Obs/Disco ... possible historic month for heat
NoCORH4L replied to Typhoon Tip's topic in New England
My folks still don't have AC. Granted they are at 1,200', but still, some of the few around that don't have it I bet, do they even build new house without central AC? -

July 2025 Discussion-OBS - seasonable summer variability
donsutherland1 replied to wdrag's topic in New York City Metro
Yes, all things being equal, a wetter climate can temper heatwave intensity and duration. -
July 2025 Obs/Disco ... possible historic month for heat
Typhoon Tip replied to Typhoon Tip's topic in New England
I actually completely agree with this source's "hot take" on the outlook. -
July 2025 Discussion-OBS - seasonable summer variability
donsutherland1 replied to wdrag's topic in New York City Metro
That's something the data can't really illustrate. But one would expect similar trends in the nearby locations as one is seeing at Central Park if synoptic developments were largely responsible. Instead, Central Park has been decoupling from the nearby locations when it comes to high temperatures. Indeed, absent the trees, Central Park would likely have had two 100° days so far, including a June record 102° high (pre-2000 regression equation). -
July 2025 Discussion-OBS - seasonable summer variability
LibertyBell replied to wdrag's topic in New York City Metro
Yes, it's completely out of range compared to the other reporting stations. But the wetter climate might be shortening the length of heatwaves and also limiting the frequency of 100 degree temperatures (compared to how frequent 7 day heatwaves and 100 degree temperatures were during the 1990s for example.) -
July 2025 Discussion-OBS - seasonable summer variability
LibertyBell replied to wdrag's topic in New York City Metro
But what about these fronts stalling near the coast, something we really did not see at least in the month of July in summers like 1991, 1993, 1999, 2002, etc (basically the summers with the longest heatwaves since 1953.) From what I remember of 1993 and 1999 and 2002 especially, the fronts always died out before they made it into our region (at least in July.) This enabled us to have extra long heatwaves without being interrupted with days of rain. -
July 2025 Discussion-OBS - seasonable summer variability
donsutherland1 replied to wdrag's topic in New York City Metro
Wetter summers but not more frequent rainfall. But the decoupling between Central Park, JFK, LaGuardia, and Newark, which are experiencing similar rainfall trends suggests its Central Park's local environment that is playing the larger role in somewhat reduced high temperatures. -
July 2025 Discussion-OBS - seasonable summer variability
donsutherland1 replied to wdrag's topic in New York City Metro
The average number of days with 0.01" or more rainfall per week during the summer hasn't really changed too much. The amount of rainfall has increased and was at its highest 30-year average for the 30-year period ending in 2020. If one goes beyond 2020, the most recent 30-year period (1995-2024) averaged 2.42 days per week with 0.01" or more rain during the summer and average total summer rainfall of 13.99". -
July 2025 Discussion-OBS - seasonable summer variability
LibertyBell replied to wdrag's topic in New York City Metro
also much rainier summers and shorter heatwaves, something which I outlined in an earlier post.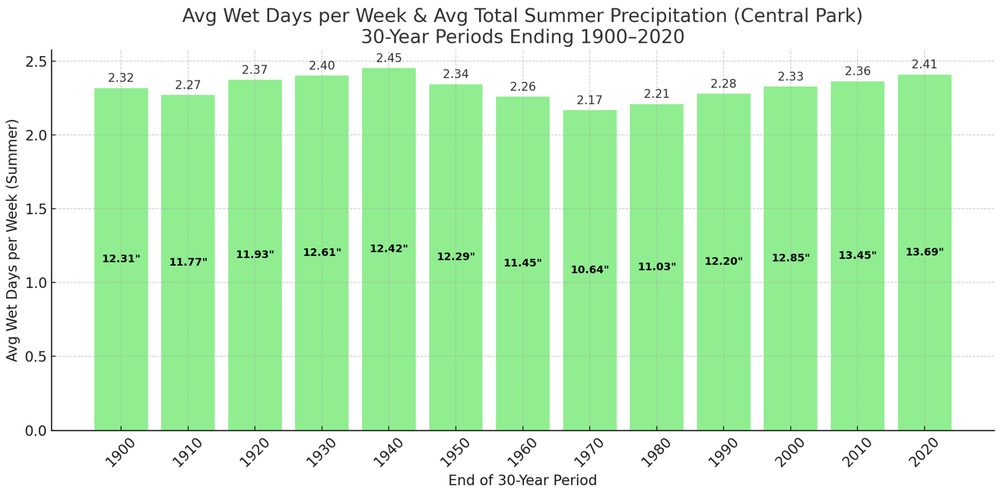
-
July 2025 Discussion-OBS - seasonable summer variability
LibertyBell replied to wdrag's topic in New York City Metro
Yes, nothing like the extreme heat we had in 1966 or 1993 or 1999 around the same time frame. This is why I say our extreme heat has flatlined. -
The Split was real on Tuesday. However, MBY did fine the previous several days. After the hot temps July 4-8/9 the benign weather pattern is still forecast for a good chunk of July. Forecast looks seasonably hot but temps not much if any above normal. Greater anomalies should be north. CFS has the GL mild but it's an outlier. EC and GEFS weeklies have a hot Midwest, but that's OK. AN heights north leaves ours near normal, which will allow scattered pm t-storms. The latter two weekly products also line up with most teleconnections. Very end of July is still up in the air. The PNA pattern may get stale by then which would let in more heat, but not necessarily for long. We'll see.
-

July 2025 Discussion-OBS - seasonable summer variability
SACRUS replied to wdrag's topic in New York City Metro
more familiar heat over the top from 2020's next week, but still heat getting here. The earlier 100 heat potential seems to be focused inland s-w with low - mid 90s in the usual non coatsal hotter spots - 7/6 - 7/9