All Activity
- Past hour
-

Augdewst 2026: Summer's Last Stand
CoastalWx replied to Prismshine Productions's topic in New England
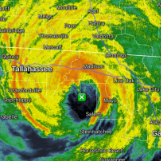
Into RI and the Cape. Today they ride he outflow from earlier convection. Stein exhaust here. -

Central PA Summer 2026 Discussion/Obs Thread
Itstrainingtime replied to Voyager's topic in Upstate New York/Pennsylvania
Yep - I've had less than 3" of rain since June. This map is typical it seems for the past 6 weeks or so: -
I’m not sure it can get any greener
-

Central PA Summer 2026 Discussion/Obs Thread
canderson replied to Voyager's topic in Upstate New York/Pennsylvania
I’m 10000% ready for fall -
Augdewst 2026: Summer's Last Stand
CT Valley Snowman replied to Prismshine Productions's topic in New England
That's a problematic looking rain train from from Providence down to Old Saybrook. -
grass will be more green after this
-
Everything is green...including the crickets in my basement. Could do without them honestly.
-

Augdewst 2026: Summer's Last Stand
Damage In Tolland replied to Prismshine Productions's topic in New England
Every scout in water . Ginx there ? -
.thumb.gif.f92b16c631a1d15d405ed77b33f0710d.gif)
Augdewst 2026: Summer's Last Stand
Torch Tiger replied to Prismshine Productions's topic in New England
double-digit amounts? -
Classic El Niño summer. Everything is lush and green.
-
Augdewst 2026: Summer's Last Stand
OrangeCTWX replied to Prismshine Productions's topic in New England
Have a friend in Old Lyme who is at 3.50 inches with plenty more to come it looks like. -
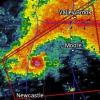
Radar looks like a benchmark snowstorm.
-
 click here for details ordering your supply from abroad https://clients1.google.com.eg/url?q=https://mexicorxnews.online ordering your supply from abroad [url=https://clients1.google.dj/url?q=https://mexicorxnews.online]overseas alternatives[/url] MexiMedsExpress website
 -
Don’t laugh, I drive by there all the time on Rt 138; was gonna take a pic to post. Deluge currently in n Cranston
-

Augdewst 2026: Summer's Last Stand
nutmegfriar replied to Prismshine Productions's topic in New England
I hear the train a-comin, it's rollin' round the bend. Yikes, it's been a deluge at and near the mouth of the CT River. -
Augdewst 2026: Summer's Last Stand
WxWatcher007 replied to Prismshine Productions's topic in New England
Southern CT year. Big snows. Big rains. -
Augdewst 2026: Summer's Last Stand
CoastalWx replied to Prismshine Productions's topic in New England
South coast summer -
Augdewst 2026: Summer's Last Stand
CT Valley Snowman replied to Prismshine Productions's topic in New England
Wouldn't be shocked if some of us in the interior west of the heavy rain axis pick up like .5 to 1.5" in afternoon convection. -

Augdewst 2026: Summer's Last Stand
jlauderdal replied to Prismshine Productions's topic in New England
Squall line west of albany looks promising -
Hope we can see some clearing / sun after this line of storms /rain moves through.
-
E PA/NJ/DE Summer 2026 Obs/Discussion
BBasile replied to PhiEaglesfan712's topic in Philadelphia Region
Right in a valley! Blah. Still have 0.92", so can't complain too much.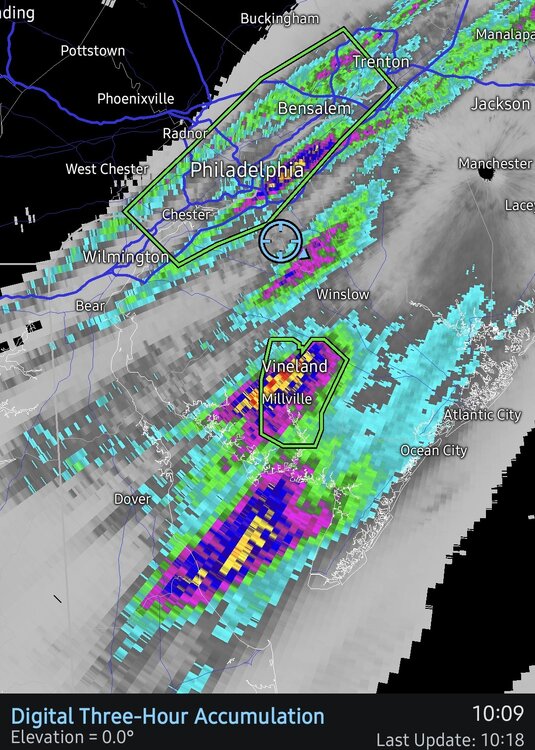
-

2026-2027 Super El Nino
FPizz replied to Stormchaserchuck1's topic in Weather Forecasting and Discussion
I think he was taking people saying how it could become one too seriously, but he also must follow a bunch of weenies because I haven't really seen anyone with a degree say it only some hopeful hobbiests pondering about it. -
2026-2027 Super El Nino
LakePaste25 replied to Stormchaserchuck1's topic in Weather Forecasting and Discussion
PDO correlation +PDO = more troughing in the east. 97-98 would’ve been an extreme torch without the +PDO.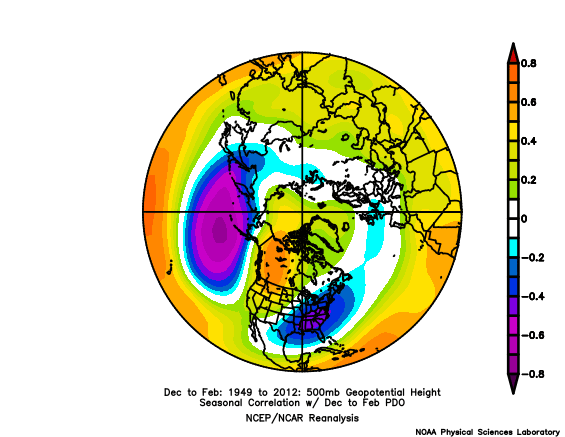
-

2026-2027 Super El Nino
PhiEaglesfan712 replied to Stormchaserchuck1's topic in Weather Forecasting and Discussion
I think somewhere close to neutral PDO is the best scenario for a robust el nino. Strong/super el ninos have busted when the PDO was highly negative or highly positive. A near neutral PDO is the sweet spot (see 1965-66 and 2009-10). -
1.50” so far and more to come. I’m sure we’ll hear more drought talk