All Activity
- Past hour
-
Farmingdale only starts in 1999 so several warmer rankings prior to that would be missing. Islip finished 12th warmest. The strong onshore flow kept LI cooler in the rankings than NYC. Time Series Summary for ISLIP-LI MACARTHUR AP, NY Click column heading to sort ascending, click again to sort descending. 1 2012-04-29 49.8 0 2 2010-04-29 49.0 0 3 2025-04-29 48.6 0 4 2024-04-29 47.9 0 5 1973-04-29 47.5 0 6 2023-04-29 47.3 0 - 2016-04-29 47.3 0 7 1991-04-29 47.1 0 8 2002-04-29 47.0 0 9 2021-04-29 46.4 0 - 1977-04-29 46.4 0 10 1976-04-29 46.3 0 11 1985-04-29 46.1 0 12 2026-04-29 46.0 0 - 2022-04-29 46.0 0 13 2020-04-29 45.8 0 - 1998-04-29 45.8 0 - 1995-04-29 45.8 0 14 2008-04-29 45.7 0 15 1999-04-29 45.6 0
-
Popes brain a box of rocks
.thumb.png.1aed429958da6fe4d223468a4194bab4.png)
-

2026-2027 Strong El Nino
bluewave replied to Stormchaserchuck1's topic in Weather Forecasting and Discussion
You still haven’t apologized for your fake criticism of me that NYC, LGA, and JFK would struggle to reach 50” of snow which I made several years back. -
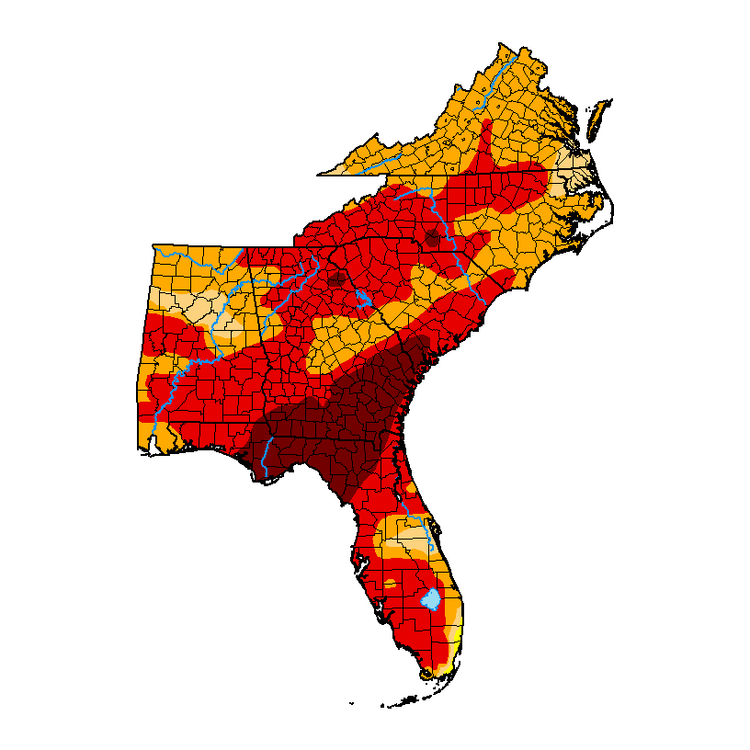
My theory for this is that it's hard for 1" of rain to be enough to drop a county a whole category when much of the state has been in some form of drought for 3+ months... FFC mentioned in their discussion today that even the 1-2" in store for central GA Saturday will not "put much of a dent in the drought." I think we will need at least multiple days/weeks of good sustained rainfall to improve by enough to drop a category. This image posted on FFC's Twitter I think does a nice job explaining... we would need over 10" in a month to get back to near-normal. Regardless, I do expect some improvement in next week's update.
-

2026-2027 Strong El Nino
40/70 Benchmark replied to Stormchaserchuck1's topic in Weather Forecasting and Discussion
I have learned the hard way to not mock alternative viewpoints. I know I teased Chuck about the -PDO following strong El Nino push back, but that was just because the data is supportive of it right now. He could ultimately be right, but we will need to confirm that posthumously...hence my sarcasm. -

Central PA Spring 2026 Discussion/Obs Thread
Voyager replied to Voyager's topic in Upstate New York/Pennsylvania
Anyone seeing rain/drizzle? Up here in wretched Hazleton today, and of course I'm getting rained on. If there's one place I hate, it's Hazleton. The weather is always shitty in one form or another up here. -
No one was referring to NNE. Complete pattern change Mr NNE (actually (CNE) coastal boy 2026-04-14 80 48 64.0 15.3 2026-04-15 84 51 67.5 18.4 2026-04-16 86 53 69.5 20 2026-04-17 74 49 61.5 11.6 3 2026-04-18 55 46 50.5 0. 3 2026-04-19 53 37 45.0 -5.6 2026-04-20 52 35 43.5 -7.5 2026-04-21 49 34 41.5 -9.8 2026-04-22 47 34 40.5 -11.2 2026-04-23 68 44 56.0 3.9 2026-04-24 59 40 49.5 -2.9 2026-04-25 53 35 44.0 -8. 2026-04-26 59 42 50.5 -2.6 2026-04-27 68 37 52.5 -0.9 2026-04-28 66 40 53.0 -0.8 2026-04-29 65 45 55.0 0.9
-
2026-2027 Strong El Nino
40/70 Benchmark replied to Stormchaserchuck1's topic in Weather Forecasting and Discussion
Well, everything was initially "bunk", until it wasn't. I have no issue with it, as long the presenter is transparent about it. He admitted it's a pioneer concept, but that doesn't necessarily mean that it's incorrect. -

2026-2027 Strong El Nino
FPizz replied to Stormchaserchuck1's topic in Weather Forecasting and Discussion
I'm going to make up stuff too and then say you wont find much (probably because its bunk). -
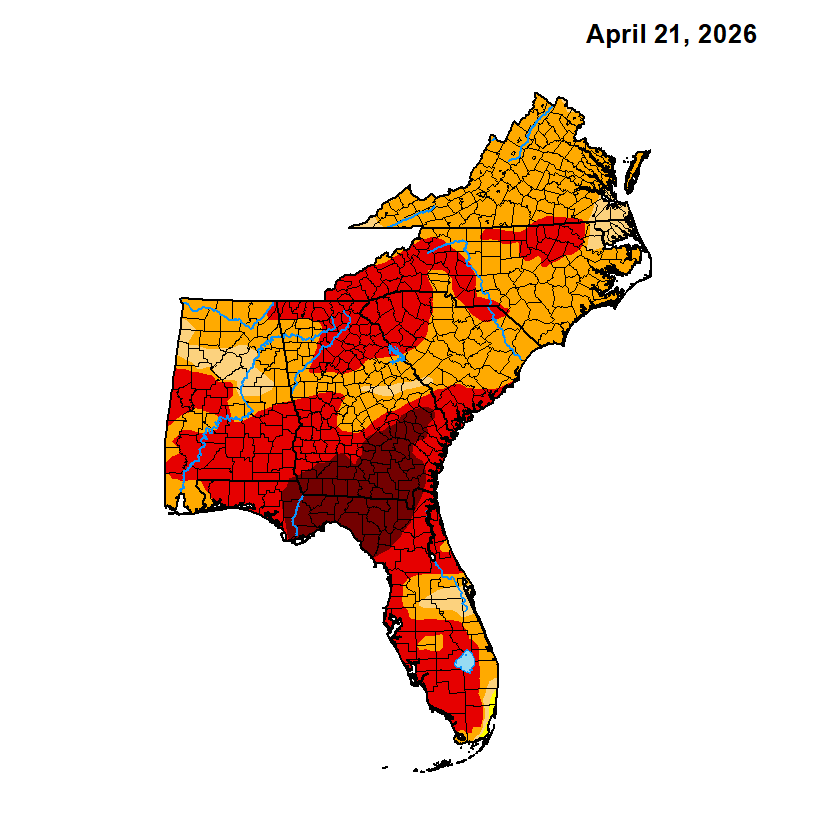
Extreme Drought % (SE Region): VA - 8.07% AL - 47.93% NC - 54.87% FL - 78.51% SC - 79.03% GA - 80.72% Extreme drought grew significantly in North Carolina and South Carolina. Georgia continues to have some of the worst drought in the region, with fires growing in the southern counties. While we have received a few days of overnight rainfall now, it will be difficult for 1-2 inches of rain to overcome 3 months of drought. My area in Atlanta has received 1.75" of rain in the last 3 days, with hopefully more coming Friday overnight into Saturday. I do expect some improvement in next week's map.
-
2026-2027 Strong El Nino
40/70 Benchmark replied to Stormchaserchuck1's topic in Weather Forecasting and Discussion
All ribbing aside, I love the fact that you think outside of the box...I think that is necessary because if the "inner box" conceptualizations were working, we would have gleaned a modicum of skill with the seasonal forecasting arena. -
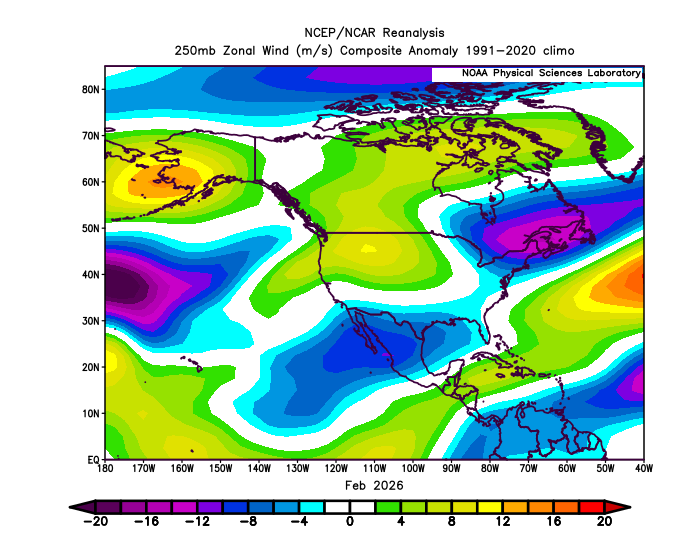
it’s interesting that Tue/Wed lower trop synopsis in there considering the local hemisphere
-
2026-2027 Strong El Nino
bluewave replied to Stormchaserchuck1's topic in Weather Forecasting and Discussion
It may be that the SSW in late November set off a chain of events that allowed the Northern Stream to weaken enough by late February for the KU BM event. This almost reminds me of a dance between the Northern Stream and Southern Stream. When the NS becomes too overpowering, it’s like it keeps stepping on the feet of the STJ dance partner suppressing it too much. When the Northern Stream backs off just enough and allows the STJ to lead, then it opens the door for great Benchmark KU events like in late February.
-
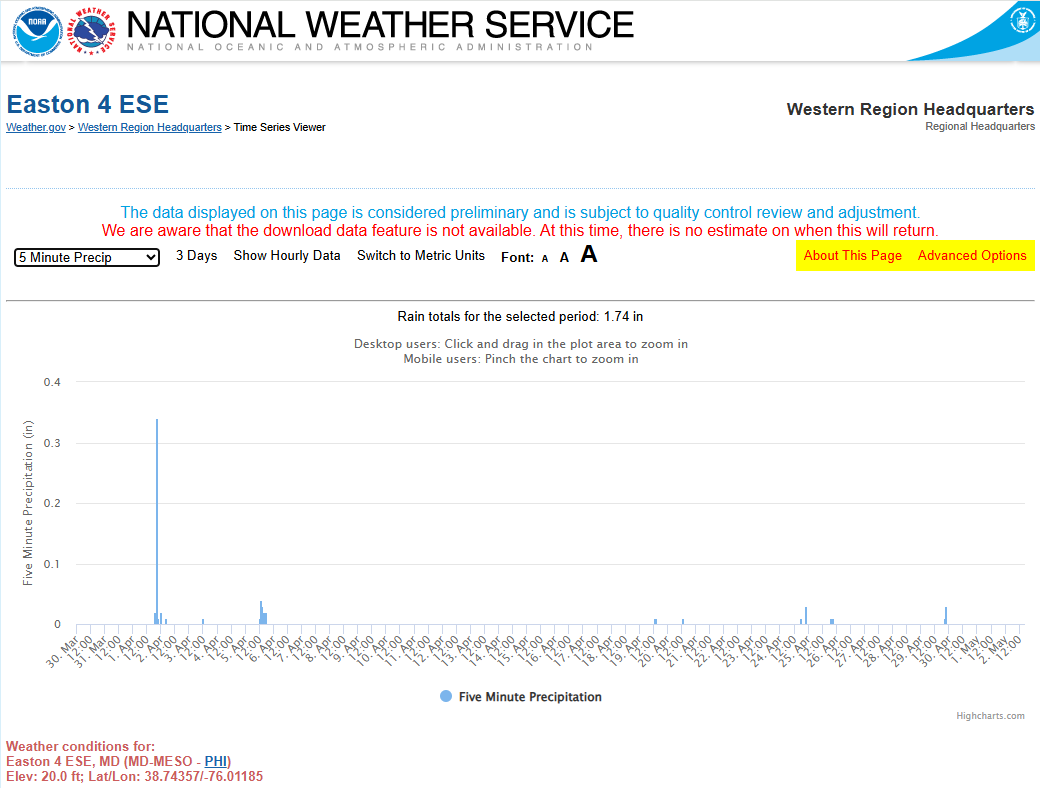
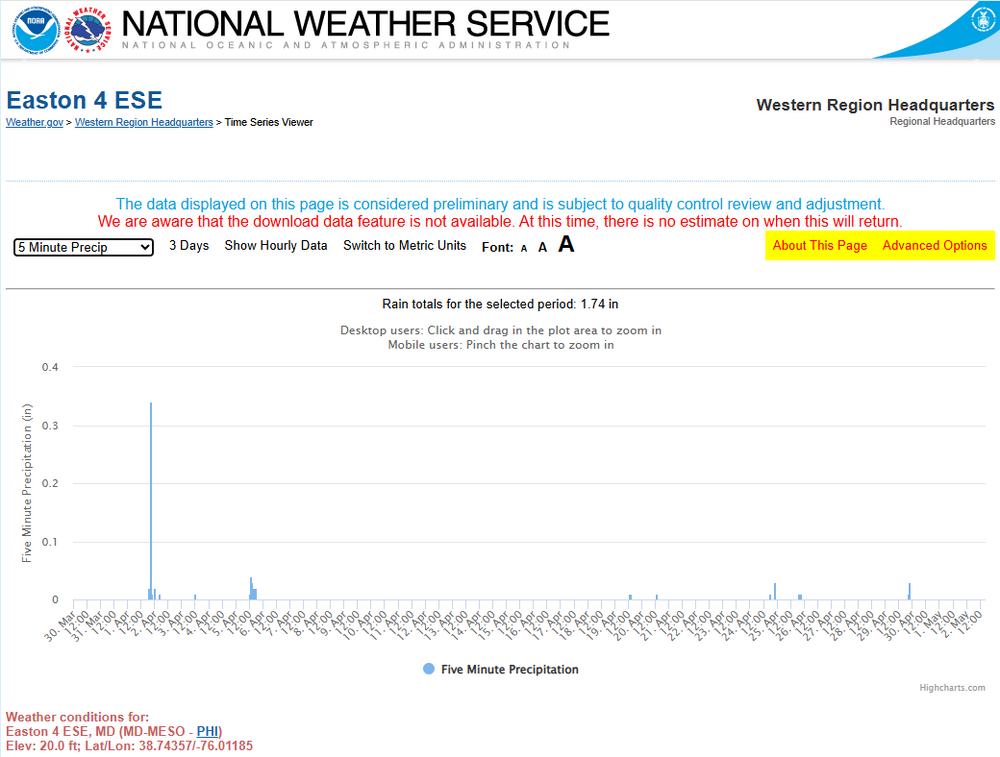
Rainfall data from Easton site-
-
I believe that there’s notable reporting lag. I don’t mean just that the map is as of 8AM of two days ago (4/28). Note that not a single area of the SE got better on the map released today vs the map released one week ago (in addition to many areas getting worse). See the maps below. I don’t see how that’s reflecting reality. Based on looking at rainfall reports across the SE for prior to 8AM on Tue there was moderate to heavy rainfall in portions of especially N AL to S NC during the several days prior to April 28th. Despite that, some of those counties actually got worse vs the map as of the prior weekly map. I believe that due to the time needed to gather reports that there’s reporting lag of perhaps a few days. In other words, these maps as of Tue at 8AM are in reality probably reflecting closer to, say, an average of 8AM on Saturday or whatever. Tue at 8AM is just the deadline to get reports in so they have time to compile the map for the Thu AM release. In reality, there’d be reports coming in before Tue…say on a Saturday for example. And then that Sat submission could have been based on a Fri or Thu observation. Map released one week ago: Map released today: no improvement anywhere and worse in many spots: not realistic imho…example much of my county got nearly 1” of rain on Sunday (heaviest since March 6th), well before Tue 8AM deadline for submission, and yet my county got a worse designation!

-
Another cool day with a mix of rn/sn shwrs on tap.
-
The Annual Countdown to May 1st Thread ©
40/70 Benchmark replied to weatherwiz's topic in New England
-
What a perfect 10 day stretch for the lawns and gardens. We Ireland. Landscape spring-up tracking a few weeks ahead of last year.
-
I set it for 5 min obs and picked the max hours(720). A bar graph shows each time it rained/amount, and at the top of the graph it displays total for the period.
-
2026-2027 Strong El Nino
40/70 Benchmark replied to Stormchaserchuck1's topic in Weather Forecasting and Discussion
So it sounds pretty frontier and skeptical....but I am open to it. -
Oh, month to date rainfall. Interesting. @wxmeddler might be a useful product to add to the page!
-
0.25”
-
Would recommend a Tempest as a quick replacement. I've had one for several years and it's quite cost effective. If you get a backup power pack from them, your data will be preserved and uploaded post-event for documentation. It's a very nice backyard product.
-

2026-2027 Strong El Nino
snowman19 replied to Stormchaserchuck1's topic in Weather Forecasting and Discussion
You don’t get better ocean/atmosphere coupling (Bjerknes feedback) then this: -
Down to the final day!

.png.60d5fdcc8d55acb409313ee0bb367f42.png)